Comparative Analysis of Different Air Pollutants on the Health of Asian Population by Application of AIRQ+ Tool
Abstract
This study presents a comparative analysis of air pollutant–attributed health risks across 15 urban centers in India, China, and Japan using the WHO’s AirQ+ model (V2.2.3). Four major pollutants PM2.5, PM10, NO2, and O3 were assessed for their contribution to natural mortality, lung cancer, chronic bronchitis, postneonatal infant mortality, and respiratory-related deaths. Using city-level annual mean concentration data from 2022 and a modified demographic cohort (adults aged 18+), the study estimated attributable proportion (AP%), relative risk (RR), and number of excess cases (NE) per pollutant–health endpoint pair. Patna, India, exhibited the highest AP for PM2.5-related natural mortality (77.49%) and lung cancer. Suqian, China, showed similarly high APs for PM2.5 and PM10, while Shizuoka, Japan, recorded the highest PM10-related chronic bronchitis and infant mortality within its cohort. Mumbai, India, recorded the highest NO2-attributed AP for bronchitis in asthmatic children (AP: 16.7%). Xian, China, had the highest AP (up to 13.2%) for respiratory mortality due to O3 exposure. Episodic events such as dust storms and agricultural burning were found to elevate annual PM concentrations by 10%–30%, influencing the overall AP calculations. Statistically, PM2.5-related AP correlated strongly with urban industrialization and seasonal pollution peaks. The study further integrated spatial variance, adjusting for meteorological and topographic influences across cities. By incorporating nondefault age groups (18+), high-resolution monitoring data, and city-specific exposure sources, the research offers a granular and regionally differentiated health impact profile of air pollution across Asia.
1. Introduction
Outdoor air pollution remains a major threat to public health, with the World Health Organization (WHO) attributing approximately 4.1 million premature deaths globally to ambient air pollution in the year 2020 (WHO, 2020). Multiple independent investigations have consistently documented the severe short- and long-term health impacts of such exposure, particularly across regions in South, East, and Southeast Asia. These studies clearly establish a connection between ambient air pollution and elevated morbidity and mortality rates [1–5]. While particulate matter (PM) is often used as a key indicator of pollution in these studies [6], the harmful effects of gaseous pollutants such as nitrogen dioxide (NO2), ozone (O3), PM2.5, and PM10 are also well recognized. Their widespread contribution to increased health risks reinforces the urgency of implementing effective pollution control strategies to reduce this growing burden.
Among all air pollutants, PM is especially harmful due to its chemical complexity and deep penetration into human respiratory systems. Inhalation of PM over extended periods is associated with a rise in respiratory ailments, including recurrent infections and asthma. Evidence also links PM exposure to an increased risk of premature death from multiple diseases. Similarly, NO2, a byproduct of high-temperature fuel combustion in vehicles and power plants, has been shown to cause cellular damage in the heart, kidneys, and liver. Long-term NO2 exposure has also been associated with chronic respiratory disorders such as chronic obstructive pulmonary disease (COPD), allergic airway inflammation, and increased vulnerability to infections [7]. These findings make it evident that curbing PM and NO2 pollution must be prioritized to protect human health.
Tropospheric O3, a highly reactive secondary pollutant, significantly contributes to the deterioration of air quality [8]. Epidemiological studies have long associated O3 exposure with elevated mortality rates, particularly due to its inflammatory effects on lung tissues. Research in both human and animal models shows that sustained exposure to O3 can lead to epithelial injury, heightened cytokine production, and weakened lung defenses, making individuals more susceptible to respiratory diseases [9]. These outcomes underscore the necessity of regulating O3 levels to prevent serious health effects.
In this context, the present study utilizes the WHO-developed AirQ+ tool (Version 2.2.3) to quantify the health impacts of major ambient air pollutants PM10, PM2.5, NO2, and O3 across selected cities in South, East, and Southeast Asia. By applying attributable proportion analysis (APA), the study estimates the share of health burden linked to exposure to each pollutant. Additionally, the integration of relative risk (RR) data for pollution-induced mortality allows for a detailed risk profile. This comparative analysis helps to identify the most affected regions, thereby providing evidence-based insights to guide region-specific policy and mitigation strategies.
The core objective of this research is to evaluate the health implications of air pollution and enhance preparedness through targeted data analysis. The study explores the relationship between air pollutants and a range of health conditions, such as cardiovascular illnesses, asthma, respiratory infections, and hospitalizations [10]. Using AirQ+, the study assesses both mortality and morbidity indicators, including heart attacks, respiratory disease admissions, and COPD. The estimation of attributable proportion (AP) forms the foundation of this approach, providing a quantitative measure of the health effects attributable to pollution over a specific timeframe [11–14].
The study further references the WHO Air Quality Guidelines, which have served as a global reference for setting air quality standards since their first release in 1987 and subsequent revisions in 2000 and 2005 [15]. These guidelines help authorities develop policies that aim to reduce harmful exposure levels and improve public health outcomes.
This investigation distinguishes itself by undertaking a multicity analysis covering 15 urban locations in India, China, and Japan. Unlike prior studies limited to single-region assessments, this research spans various environmental, demographic, and industrial contexts, offering a broader and more representative understanding of pollution-health linkages in urban Asia. The selection of cities with varying air quality profiles enriches the depth of comparative analysis. The application of a uniform analytical method AirQ+ across all cities ensures comparability of results and strengthens the credibility of findings. This study is ultimately aimed at offering actionable knowledge for environmental health policymakers working to curb the negative health impacts of air pollution in the region.
Furthermore, this study introduces customized age group parameters in AirQ+ to better reflect the demographic profiles of the selected regions, enabling a more refined analysis of health impacts on younger adults aged 18 and above. In summary, the originality of this work lies in its integrated, multicity, multipollutant assessment using a standardized tool, thereby contributing significantly to the literature on air quality and health impact assessment in South, East, and Southeast Asia.
Table 1 shows the findings of the literature reviewed for the air pollution and human health effects.
| S.N | Area of study | Country associated with study | Air pollutants | Health impacts | Reference |
|---|---|---|---|---|---|
| 1 | Analysis of pollutants transport in heavy air pollution processes using a new complex-network-based model | China | General air pollutants (PM, gaseous) | No direct health outcome | [1] |
| 2 | Death from air pollution is a major factor in the Cohort effect. | Global | Ozone, household air pollution, ambient PM | Mortality, diabetes, age-standardized mortality rate | [2] |
| 3 | Analysis of Chandigarh’s air pollution’s impact on health | India | Vehicle emissions (likely PM, NO2) | Public awareness, behavior, perception | [3] |
| 4 | Unfavorable effect of air pollution on the Chinese green bond market | China | General air pollutants | Respiratory illness, cardiovascular disease | [4] |
| 5 | Short-term air pollution exposure harms the mother’s and fetus’ health. | China | General air pollutants | Perception, policy response | [5] |
| 6 | Air pollution’s immediate impact on children in China | China | PM2.5, NO2, O3 | Respiratory illness, cardiovascular disease | [6] |
| 7 | Lichens in cities aid in lowering air pollution. | Global | General air pollutants | Perception, policy response | [7] |
| 8 | Relationship between COVID-19 and air pollution in Brussels Capital Region | Belgium | General air pollutants | Respiratory illness, cardiovascular disease | [8] |
| 9 | Effects of building-related stagnant air pollution dispersion | Iran | PM2.5, NO2, O3 | Perception, policy response | [9] |
| 10 | How air pollution reduces investment effectiveness | China | General air pollutants | Respiratory illness, cardiovascular disease | [10] |
| 11 | The effects of air pollution on COVID-19 in East Java | Indonesia | General air pollutants | Perception, policy response | [11] |
| 12 | Residents of the community’s assessment of air pollution | China | PM2.5, NO2, O3 | Respiratory illness, cardiovascular disease | [12] |
| 13 | Government response to air pollution’s effects and measures to reduce it | China | General air pollutants | Perception, policy response | [13] |
| 14 | Analysis of London’s indoor air quality and air pollution mitigation measures | United Kingdom | General air pollutants | Respiratory illness, cardiovascular disease | [14] |
| 15 | How the effects of air pollution on consumer behavior are related | China | PM2.5, NO2, O3 | Perception, policy response | [15] |
| 16 | Cardiometabolic abnormalities in China as a result of ambient air pollution | China | General air pollutants | Respiratory illness, cardiovascular disease | [16] |
| 17 | Due to environmental air pollution, the vitamin D content has changed. | China | General air pollutants | Perception, policy response | [17] |
| 18 | Ambient air pollution causes dementia-related deaths. | China | PM2.5, NO2, O3 | Respiratory illness, cardiovascular disease | [18] |
| 19 | Urban biosolar green roofs and ambient air pollution | Australia | General air pollutants | Perception, policy response | [19] |
| 20 | Ambient air pollution and inflammation-related proteins during early childhood | China | General air pollutants | Respiratory illness, cardiovascular disease | [20] |
| 21 | MicroRNAS in circulation about background air pollution | China | PM2.5, NO2, O3 | Perception, policy response | [21] |
| 22 | Effects of ambient air pollutants on the lungs | China | General air pollutants | Respiratory illness, cardiovascular disease | [22] |
| 23 | Ambient air pollution and depression symptoms in elderly women | United States | General air pollutants | Perception, policy response | [23] |
| 24 | Green wall plants’ ability to tolerate ambient urban air pollution | Australia | PM2.5, NO2, O3 | Respiratory illness, cardiovascular disease | [24] |
| 25 | Clinical results for heart failure patients exposed to ambient air pollution | China | General air pollutants | Perception, policy response | [25] |
| 26 | AirQ+ model to quantify health effects of ambient air pollution in Iran | Iran | General air pollutants | Respiratory illness, cardiovascular disease | [26] |
| 27 | Considering chronic obstructive pulmonary disease (COPD) | Iran | PM2.5, NO2, O3 | Perception, policy response | [27] |
| 28 | Iran’s mortality and morbidity due to ambient air pollution | Iran | General air pollutants | Respiratory illness, cardiovascular disease | [28] |
| 29 | Mashhad: deaths and illnesses from outdoor air pollution using AirQ+ | Iran | General air pollutants | Perception, policy response | [29] |
| 30 | Air pollution levels and sleep quality | United States | PM2.5, NO2, O3 | Respiratory illness, cardiovascular disease | [30] |
| 31 | Short-term air pollution and mental health | United States | General air pollutants | Perception, policy response | [31] |
| 32 | Environmental air pollution and children’s respiratory illnesses | Asia (multiple) | General air pollutants | Respiratory illness, cardiovascular disease | [32] |
| 33 | Indoor contaminants and health risk analysis for women | India | PM2.5, NO2, O3 | Perception, policy response | [33] |
| 34 | COVID-19 lockdown effects on aerosols and meteorology in India | India | General air pollutants | Respiratory illness, cardiovascular disease | [34] |
| 35 | Air pollution and osteoporosis risk with genetic predisposition | China | General air pollutants | Perception, policy response | [35] |
| 36 | Deep learning for air quality prediction of pollutants in a city | Turkey | PM2.5, NO2, O3 | Respiratory illness, cardiovascular disease | [36] |
| 37 | Plant responses to air pollution: current and future directions | Global | General air pollutants | Perception, policy response | [37] |
| 38 | Air pollution during second COVID-19 wave in Delhi | India | General air pollutants | Respiratory illness, cardiovascular disease | [38] |
| 39 | Kerala air quality under COVID-19 lockdown | India | PM2.5, NO2, O3 | Perception, policy response | [39] |
| 40 | Global oil refining sector and air pollution: network perspective | Global | General air pollutants | Respiratory illness, cardiovascular disease | [40] |
| 41 | Persistent organic pollutants: risks and mitigation | Global | General air pollutants | Perception, policy response | [41] |
| 42 | Gridded emission inventory for urban Hanoi | Vietnam | PM2.5, NO2, O3 | Respiratory illness, cardiovascular disease | [42] |
| 43 | Predictive modeling of air quality using COVID-19 scenarios | India | General air pollutants | Perception, policy response | [43] |
| 44 | Air quality and public opinion in India during lockdown | India | General air pollutants | Respiratory illness, cardiovascular disease | [44] |
| 45 | Pharmaceuticals in water as contaminants affecting river health | India | PM2.5, NO2, O3 | Perception, policy response | [45] |
| 46 | Background concentration of ambient pollution in Delhi NCT | India | General air pollutants | Respiratory illness, cardiovascular disease | [46] |
| 47 | Ambient air pollution and infant mortality in India | India | General air pollutants | Perception, policy response | [47] |
| 48 | Sources and health effects of PM10 in coastal eastern India | India | PM2.5, NO2, O3 | Respiratory illness, cardiovascular disease | [48] |
| 49 | Environmental impacts of COVID-19 in Uttarakhand | India | General air pollutants | Perception, policy response | [49] |
| 50 | Evolution of Indian air pollution management policies | India | General air pollutants | Respiratory illness, cardiovascular disease | [50] |
2. Materials and Methods
2.1. Study Area and Pollutants
- •
India: Patna, Hyderabad, Delhi, Kolkata, and Mumbai
- •
China: Suqian, Xian, Changde, Fuyang, and Shanghai
- •
Japan: Tokyo, Hiroshima, Nagasaki, Osaka, and Shizuoka
The pollutants analyzed in this study include PM2.5, PM10, NO2, and ground-level O3. These were selected due to their well-established impacts on respiratory and cardiovascular health.
2.2. Data Collection
- •
Air pollution concentration data:
- o.
India: Central Pollution Control Board (CPCB)
- o.
China: Ministry of Ecology and Environment (MEE)
- o.
Japan: Ministry of the Environment (MoE) and the National Institute for Environmental Studies (NIES)
- o.
Concentration data was extracted at city level for the year 2022 and aggregated as annual mean values.
- o.
- •
Mortality and health statistics:
- o.
WHO Global Health Observatory
- o.
National health databases and peer-reviewed literature for incidence rates
- o.
- •
Demographic data:
- o.
World Bank and respective national statistical bureaus
- o.
Population data were filtered to include individuals aged 18 and above, considering high exposure and occupational vulnerability.
- o.
| Data type | Source | Year/time period | Geographical scope | Notes |
|---|---|---|---|---|
| Air pollution data (PM2.5, NO2, O3) |
|
2022 | Urban monitoring stations across selected Asian cities | Annual mean concentrations |
| Mortality rates | WHO Global Health Observatory (GHO) | Latest available (2020–2022) | National/urban level | Includes cause-specific mortality |
| Population data | World Bank and National Census databases | 2022 estimates | Country/urban-level disaggregation | Used to estimate exposed population |
| Health incidence rates | Peer-reviewed regional literature and national surveillance | 2018–2022 | Urban population | Used when official data unavailable |
| Relative risk values | Default values from WHO AirQ+ documentation | Version 3.3.2 | Global applicability | Consistent with WHO methodology |
2.3. Analytical Tools
- •
AP%
- •
RR
- •
Number of excess cases (NE)
- •
PM2.5 (natural mortality, lung cancer): RR = 1.062
- •
PM10 (chronic bronchitis, infant mortality): RR = 1.009
- •
NO2 (asthmatic bronchitis in children): RR = 1.037
- •
O3 (respiratory mortality): RR = 1.014
Although AirQ+ uses age-specific RRs (e.g., 25+ or 30+), this study assessed the adult population aged 18+ to account for real-world exposure risks in younger adults. No alternative RR values exist for this cohort, and the inclusion is justified through literature on early-onset health effects.
2.4. Data Analysis
- •
AP%: indicates the share of specific health outcomes attributable to pollutant exposure. Expressed as a percentage, AP indicates the proportion of health events (e.g., deaths or illnesses) that can be directly attributed to pollutant exposure during a defined period.
- •
RR: measures the increased probability of disease occurrence in the exposed group compared to the nonexposed. Expressed as a percentage, AP indicates the proportion of health events (e.g., deaths or illnesses) that can be directly attributed to pollutant exposure during a defined period.
- •
Attributable rate (IE): estimated using AP% and baseline incidence rates. AirQ+ calculates the IE by utilizing baseline health outcome frequency within the target population and AP. This measure shows the excess number of health events that can be directly linked to exposure to air pollution during a specified period of time.
- •
NE: calculated by multiplying IE with the population size (N). The IE multiplied by the size of the whole population (N) yields the NE. By converting the IE into a population-level estimate, this statistic helps to clarify the extent of health hazards associated with particular air pollutants for the whole population.
No separate statistical software was employed; all analyses were executed within AirQ+. Default confidence intervals embedded in AirQ+ were used, though p values were not generated due to the tool’s limitations.
Note: The AQI (Air Quality Index) was not used in health burden quantification, as it is a composite score not suited for epidemiological modeling. AQI was referred to only as a contextual aid in understanding public awareness and policy relevance.
3. Results and Discussion
3.1. Attributable Health Burden Due to PM2.5 Exposure: Quantitative Interpretation Across Urban Settings
Fine particulate matter (PM2.5), owing to its aerodynamic diameter ≤ 2.5 μm, poses a critical public health threat due to its ability to infiltrate the lower respiratory tract and initiate systemic physiological responses. This study quantifies the AP of mortality and morbidity linked to PM2.5 exposure across urban centers in India, China, and Japan, providing a comparative insight into regional disparities in health risk outcomes. As visualized in Figures 1a, 1b, and 1c, the AP values vary significantly among the selected cities, illustrating a complex interplay of ambient pollution concentrations, population vulnerability, emission sources, and policy efficacy. Cities exhibiting elevated AP values tend to be characterized by high levels of urbanization, extensive vehicular fleets, biomass combustion, and industrial emissions. The data indicate that Patna (India) and Suqian (China) recorded the highest APs among all cities studied—77.49% and 76.94%, respectively, underscoring acute environmental health risks. In stark contrast, cities such as Tokyo and Shanghai demonstrated substantially lower APs, reflecting effective air quality governance, technological interventions, and more resilient healthcare infrastructures.
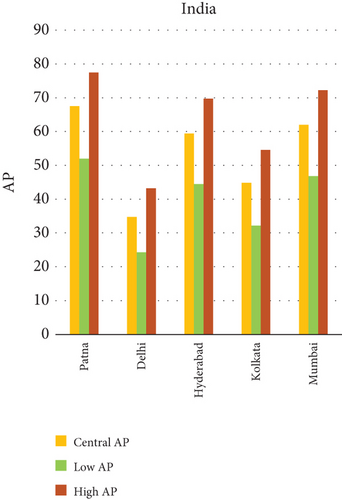
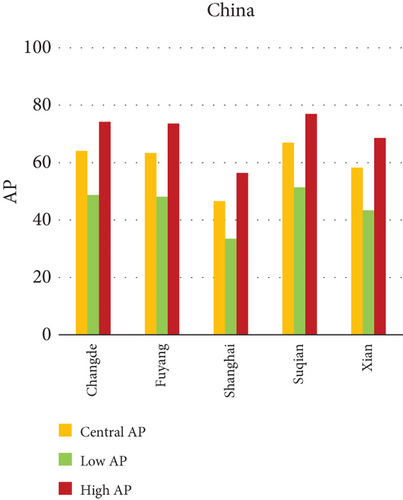
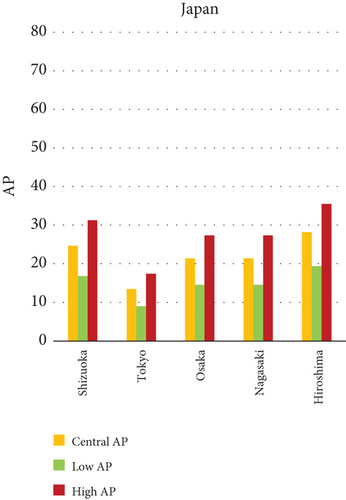
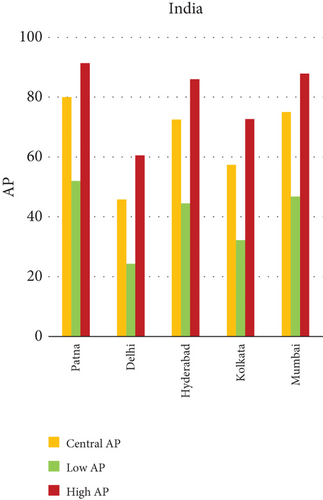
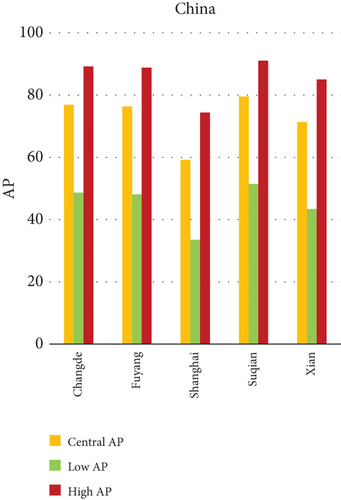
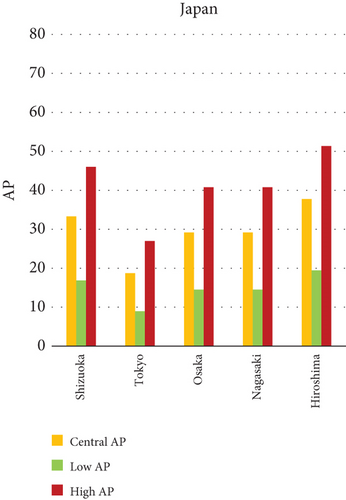
Within-country heterogeneity is also apparent. For example, while Hiroshima (Japan) registers a considerably higher AP (35.50%) compared to other Japanese cities, such as Shizuoka (22.37%) and Osaka (19.84%), similar patterns are seen in India and China. Delhi and Kolkata in India and Changde and Fuyang in China exhibit APs above 40%, largely attributable to localized emission hotspots and inadequate pollution abatement strategies. These interurban and international differences not only emphasize disparities in PM2.5 levels but also expose structural gaps in baseline health status, regulatory implementation, and urban design. The AP metric, therefore, acts as a composite indicator, reflecting the cumulative burden of exposure and population susceptibility.
3.1.1. AP of PM2.5 in Different Cities
- •
India (Graph a): Delhi (43.81) and Kolkata (40.12) are the next cities with the highest AP overall, Patna (77.49). Mumbai (29.98) and Hyderabad (34.27) have lower AP values.
- •
China (Graph b): Changde (72.18), Fuyang (71.45), and Suqian (76.94) have the greatest APs. Shanghai (33.50) and Xian (58.92) have somewhat lower AP values.
- •
Japan (Graph c): Shizuoka (22.37), Osaka (19.84), Nagasaki (18.76), and Tokyo have the lowest average points (AP) of any city. The highest AP is found in Hiroshima (35.50).
3.1.2. Notable Observations and Epidemiological Insights
Among the cities studied, Patna in India consistently registers the highest AP of health outcomes linked to PM2.5 exposure, including chronic bronchitis and lung cancer. This pronounced burden is likely due to a combination of high population density, a proliferation of unregulated brick kilns, routine agricultural residue burning, and unfavorable winter meteorological conditions that restrict atmospheric dispersion. In China, the city of Suqian shows similarly elevated AP values, particularly for lung-related diseases. This trend is attributed to widespread stubble burning, intensive industrial development, and the relative absence of stringent pollution control mechanisms. In Japan, although overall concentrations of PM2.5 tend to be low, the city of Hiroshima presents an outlier. This can likely be attributed to localized contributors, including dense vehicular movement in urban corridors, combustion activities on the city’s outskirts, and limited atmospheric dispersion due to topographical and climatic constraints. Such site-specific conditions, when combined with socioeconomic activities, appear to elevate the exposure levels in this region. The case of Hiroshima, alongside other cities with high health burdens, illustrates how urban structure, lifestyle, and environmental features collectively shape the intensity of PM2.5-related health impacts.
3.1.3. Health Risks Attributable to PM2.5 Exposure
Fine particulate matter (PM2.5) is widely recognized as one of the most harmful air pollutants due to its ability to reach deep parts of the lungs and enter the circulatory system. Once inhaled, these particles initiate inflammatory responses in the respiratory tract, leading to aggravated asthma symptoms, bronchial infections, and a decline in overall lung function. For individuals with preexisting conditions, this can result in frequent hospital visits and chronic respiratory distress. Beyond the lungs, PM2.5 exposure has been strongly linked to cardiovascular complications. It can trigger oxidative stress and systemic inflammation, impairing blood vessels and increasing the risk of heart disease, irregular heartbeat, and stroke. Long-term exposure also elevates the likelihood of lung cancer, due to the deposition of toxic and carcinogenic substances on lung tissue.
More recent studies are beginning to explore the neurological consequences of PM2.5, especially in aging populations. Preliminary evidence points to potential links with cognitive decline and an increased risk of neurodegenerative diseases, such as Alzheimer’s. In pregnant women, exposure has been associated with poor birth outcomes, such as preterm birth, lower birth weight, and developmental challenges in children. Altogether, long-term PM2.5 exposure places a disproportionate burden on vulnerable groups including children, the elderly, and individuals with compromised immunity raising the risk of early mortality.
3.1.4. Integrated Strategies to Mitigate PM2.5 Emissions
Mitigating PM2.5 emissions demands coordinated action across multiple sectors. In transportation, urban governments should prioritize expanding and modernizing public transit systems, introduce disincentives for private vehicle use (such as congestion fees), and accelerate the transition to electric or hybrid vehicles. Traffic management policies should also focus on reducing idle time and improving fuel efficiency in city centers.
Industrial emissions can be curtailed by mandating compliance with strict pollution norms, offering incentives for cleaner technologies, and shifting towards renewable energy sources. Urban infrastructure, too, has a role to play. Constructing energy-efficient buildings, enhancing natural ventilation systems, and expanding tree cover within cities can help absorb airborne pollutants and cool local microclimates.
Land use policies should aim to limit open burning of waste and biomass, regulate construction in ecologically fragile areas, and ensure green buffer zones near residential communities.
3.2. Attributable Health Burden Due to PM10 Exposure: Quantitative Interpretation Across Urban Settings
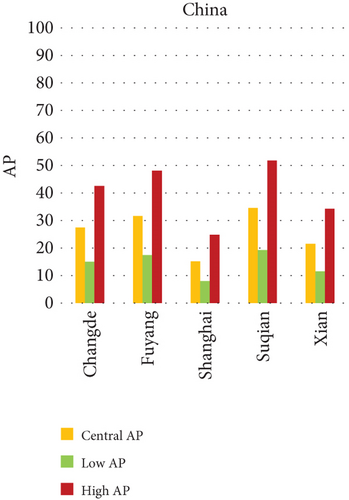
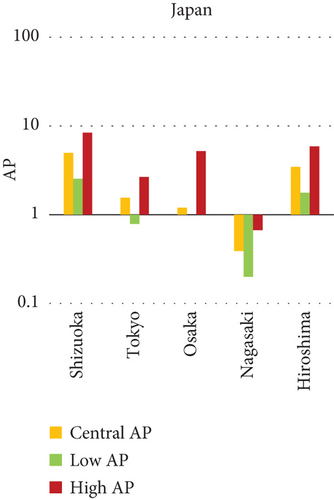
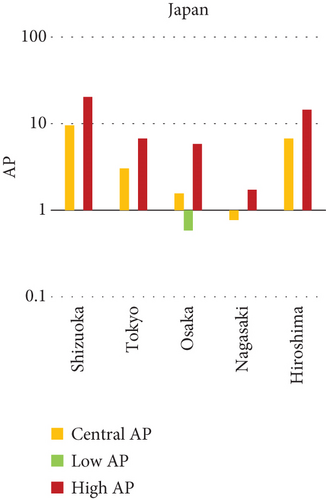
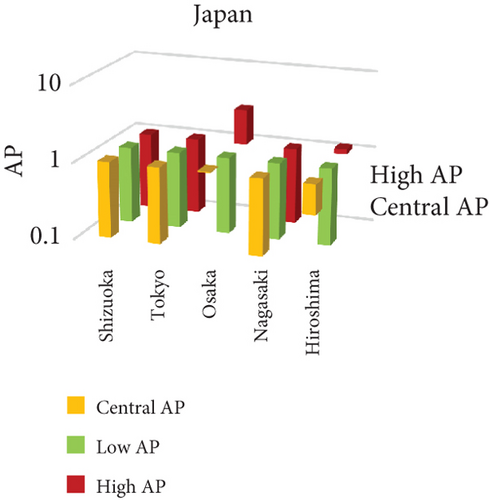
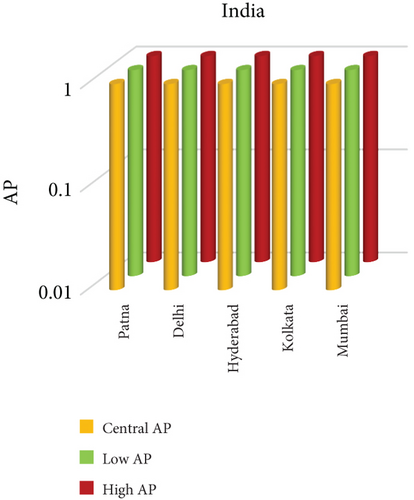
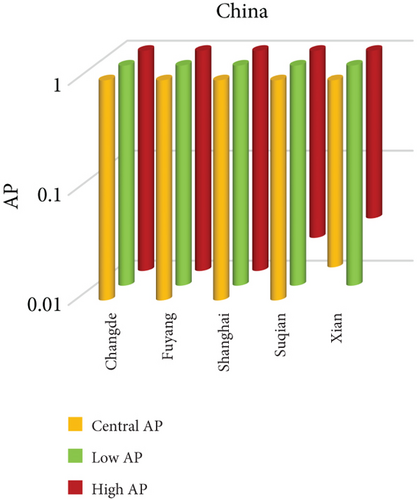
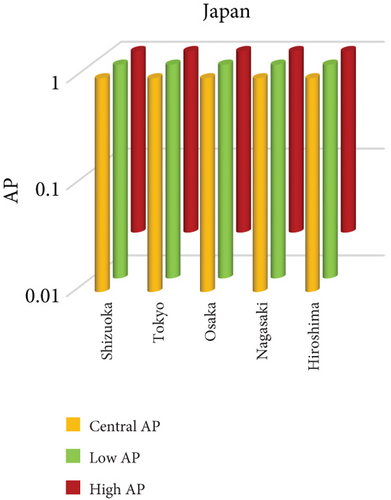
The present analysis quantifies the city-level health burden associated with exposure to PM of aerodynamic diameter less than or equal to 10 μm (PM10), focusing on chronic bronchitis in adults and children, as well as postneonatal infant mortality. Utilizing AP estimates derived from AIRQ+ modeling, the study examines health outcomes in urban centers across India, China, and Japan under three exposure scenarios: central, low, and high concentrations (as shown in Figure 2). The results demonstrate stark contrasts between cities, reflecting the interplay of ambient pollutant levels, demographic susceptibility, and the efficacy of health and environmental infrastructure.

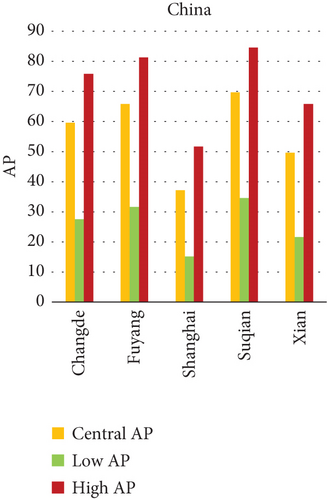
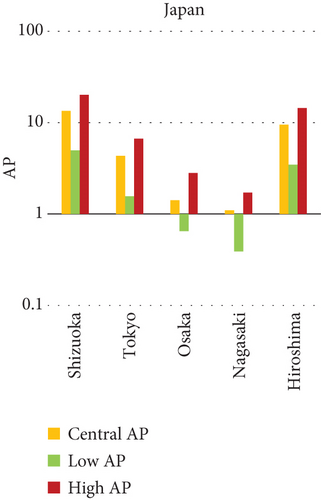
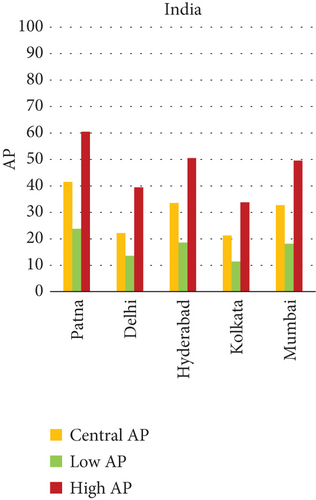
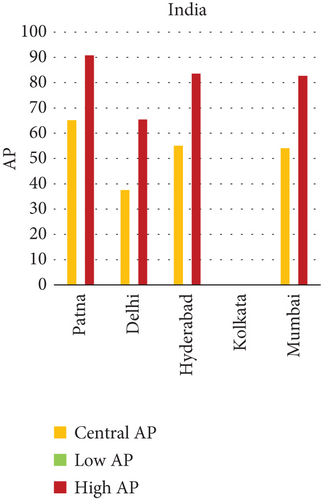
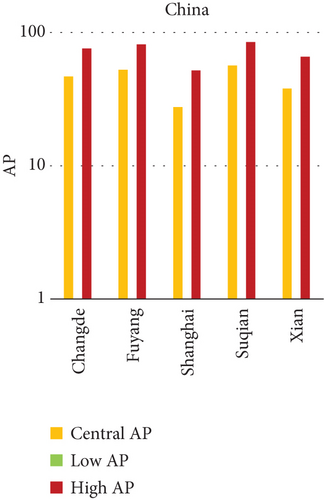
Quantitatively, Patna (India) recorded the highest APs across all health outcomes and exposure levels. The AP for chronic bronchitis in children exceeded 15% in the high exposure category, while the AP for adult bronchitis hovered around 12%, and infant mortality AP peaked near 14%. These consistently high figures suggest prolonged, year-round exposure to coarse particulates, likely intensified during winter months due to thermal inversions, reduced dispersion, and increased biomass burning. The city’s persistent pollution levels, compounded by suboptimal access to respiratory healthcare, render its population particularly vulnerable.
In China, the city of Suqian similarly exhibited elevated APs, with chronic bronchitis in children and adults showing APs between 11% and 13%, and infant mortality around 10% under high exposure. These values align with Suqian’s rapid industrial growth, extensive use of coal and fossil fuels, and insufficient urban planning, which together create conditions conducive to sustained PM10 pollution. Vehicular emissions and open burning practices, prevalent during agricultural cycles, also contribute significantly to the city’s particulate burden.
Shizuoka (Japan) emerged as the city with the highest PM10-related health burden within the Japanese cohort. Although Japan generally maintains lower ambient pollutant levels, Shizuoka’s AP values—ranging from 7% to 10% across outcomes and exposure bands—are notably higher than cities like Osaka or Nagasaki. This elevated burden is likely due to the city’s industrial base, busy road networks, and topographic features that trap airborne pollutants. The presence of surrounding hills and limited wind flow can lead to localized stagnation, enhancing exposure duration even when absolute PM10 concentrations are moderate. Conversely, cities such as Kolkata (India), Shanghai (China), and Osaka (Japan) reported lower APs, with most values ranging between 3% and 6% across health outcomes. These cities benefit from relatively better air quality controls, more widespread adoption of cleaner fuels, and better-functioning public health systems. For instance, in Kolkata, chronic bronchitis APs were consistently below 5%, even in high-exposure scenarios likely reflecting successful interventions in traffic management and household energy transitions in recent years.
The variations in attributable health risks emphasize that AP values are influenced not only by ambient PM10 concentrations but also by population structure (age and baseline disease incidence), local emission sources, meteorological behavior, and access to healthcare. Patna and Suqian’s profiles suggest a convergence of high pollutant load and insufficient mitigation, while the relatively low APs in Shanghai and Osaka indicate success in integrated urban air quality management.
3.2.1. Principal Findings and City-Specific Attributions of PM10 Exposure
The comparative analysis of PM10-attributable health outcomes across major cities in India, China, and Japan reveals a clear spatial disparity in chronic bronchitis prevalence and postneonatal infant mortality. Among all locations, Patna, India, emerges as the most severely impacted, with the highest APs across all three exposure categories low, central, and high for both adult and childhood bronchitis, as well as for infant mortality. These high estimates reflect the city’s chronic exposure to coarse PM, aggravated by persistent winter smog, widespread combustion of biomass, and limited accessibility to healthcare services. Suqian, a city in China, stands out with notably high PM10-related mortality rates, particularly affecting both adults and children with bronchitis. This outcome likely stems from a combination of dense industrial clusters, heavy road traffic, and inadequate local air quality regulations. In Japan, Shizuoka reports the highest PM10-attributable burden nationally, especially in cases of chronic bronchitis and pediatric respiratory deaths. Its geographic setting positioned within a semienclosed terrain combined with industrial activity and steady traffic movement, results in frequent pollution entrapment. By contrast, cities like Kolkata, Shanghai, and Osaka show consistently lower AP values for similar health endpoints. These trends may reflect more advanced pollution control policies, efficient public transport systems, and stronger healthcare networks.
3.2.2. Key Contributors to High PM10-Linked Health Burden in Selected Cities
The substantial health burden linked to PM10 in Patna, Suqian, and Shizuoka arises from multiple overlapping factors. High pollutant levels in these cities are driven primarily by intensive industrial operations, unregulated traffic emissions, and localized practices like the burning of biomass and construction-related dust generation. During winter, weather conditions often worsen air quality due to temperature inversions and low wind movement, causing pollutants to remain concentrated near ground level. Another major concern is access to healthcare; cities with limited hospital capacity or delayed diagnosis tend to experience worse outcomes. Vulnerable populations, such as children and the elderly, are particularly at risk. Poor air ventilation in congested neighborhoods, limited green space, and higher baseline respiratory illness rates in low-income zones further amplify the adverse effects of PM10 exposure.
3.2.3. City-Specific Factors Behind Elevated PM10 Impacts
In Patna, the highest central APs for chronic bronchitis (in both children and adults) and postneonatal deaths are reported. This can be linked to a mix of severe winter smog, heavy dependence on biomass for household energy, brick kilns, and congested traffic corridors. Suqian, located in Jiangsu province, shows a consistent pattern of high AP values, which aligns with its proximity to industrial facilities and seasonal crop residue burning in rural surroundings. Urbanization in this region has progressed rapidly, accompanied by widespread construction and increasing vehicular density both of which intensify PM10 levels.
In Shizuoka, despite the relatively stringent environmental standards in Japan, PM10-related health outcomes are higher than in most Japanese cities. The city’s geographical features, including low-lying basins, likely hinder the dispersion of pollutants. Regular emissions from vehicles and small-scale manufacturing units further add to this localized burden. These findings suggest that even moderate pollution levels, when trapped within limited dispersion zones, can pose serious health risks.
3.2.4. Health Impacts Linked to PM10 Exposure
Although PM10 does not penetrate as deeply into the lungs as PM2.5, it still contributes significantly to respiratory and cardiovascular illnesses. Prolonged exposure to these coarse particles irritates the airways and reduces lung function, often leading to chronic bronchitis, aggravated asthma, and increased susceptibility to respiratory infections. Studies have also associated PM10 exposure with elevated risks of heart attack, stroke, and hypertension due to inflammatory effects and oxidative damage to blood vessels. In pregnant women, there is growing evidence that PM10 exposure may result in preterm births, lower birth weights, and impaired developmental outcomes. Among elderly individuals and those with preexisting respiratory or cardiac conditions, the risk of premature death increases during high-exposure periods. Short-term symptoms such as sore throat, eye irritation, and persistent coughing are also widely reported in PM10-heavy environments, contributing to productivity loss and higher medical expenses. Reduced lung capacity and prolonged recovery from respiratory illnesses are common outcomes in populations living in persistently polluted areas.
3.2.5. Strategies to Reduce PM10 Emissions and Associated Health Risks
Reducing PM10 pollution in urban settings requires coordinated interventions across transport, industry, construction, agriculture, and public behavior. On the roads, promoting electric vehicles, setting up low-emission zones, and expanding affordable public transit are practical steps. In the industrial sector, stricter enforcement of emission norms and adoption of cleaner production systems such as installing particulate filters or scrubbers can yield significant reductions.
Urban development should prioritize greener designs: increasing the number of trees and vegetative buffers, optimizing ventilation in built environments, and encouraging vertical greenery can all help filter dust particles. In construction, mandating dust control practices and regulating demolition activities are key actions. Agricultural emissions should be tackled through policies that discourage open stubble burning, encouraging practices like in situ residue management and composting instead. Finally, awareness campaigns are critical. By informing the public about household contributors to PM10 such as solid fuel use or backyard burning and promoting alternatives, behavioral change can be fostered at the community level.
3.3. NO2 and Mortality: Comparative City-Level Analysis
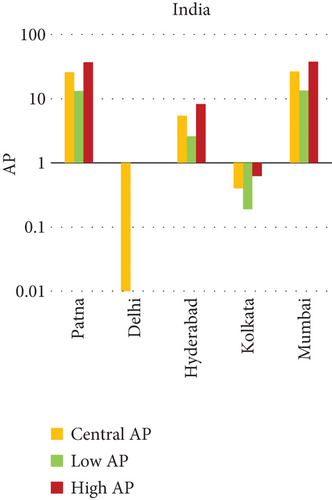
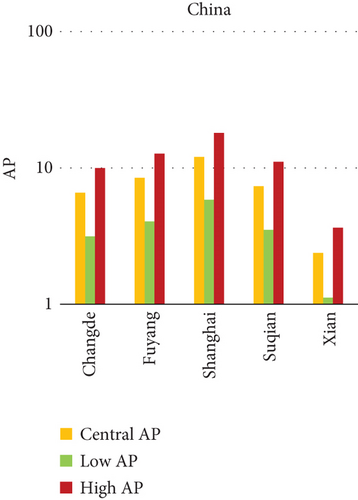
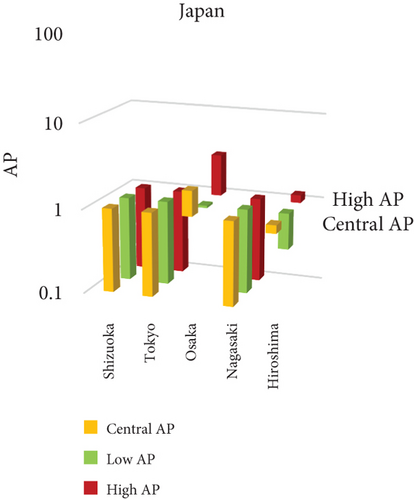
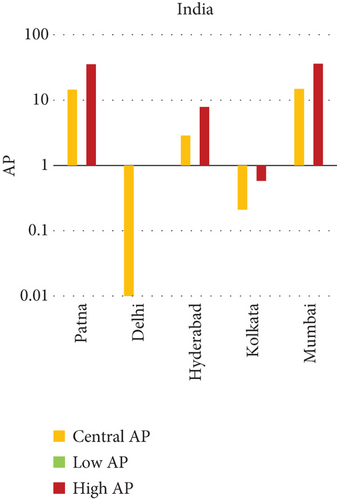
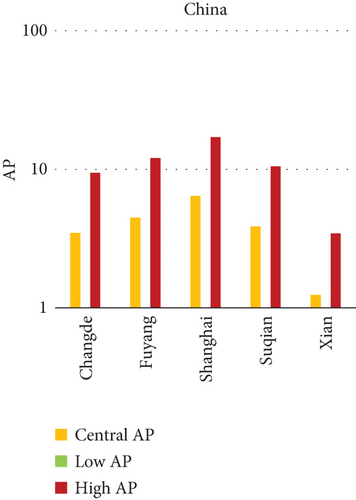
This study investigates the spatial variability in health risks attributable to NO2 exposure across selected cities in India, China, and Japan. NO2, a key urban air pollutant primarily emitted from fossil fuel combustion in transportation and industrial activities, has been linked to respiratory illnesses, cardiovascular morbidity, and premature death. Using city-level AP estimates, the analysis focuses on mortality from natural (noncancer) causes and bronchitis in asthmatic children under varying exposure conditions—central, low, and high (see Figures 3 and 4). Among Indian cities, Mumbai exhibited the highest AP under the high exposure category, reaching values close to 23%–26% for natural cause mortality. This reflects the city’s dense population, high vehicle density, frequent traffic congestion, and proximity of residential zones to emission sources. Patna followed closely, registering the highest central AP among Indian cities, underlining its persistent exposure burden due to industrial emissions, limited road ventilation, and unregulated combustion sources. In China, Shanghai recorded elevated AP values for NO2-related mortality, ranging between 14% and 19%, likely due to its sprawling urban-industrial complex, congested roadways, and regional pollutant transport. Within the Japanese context, Osaka showed the highest APs, estimated between 11% and 14%, highlighting the influence of geographic entrapment (valley topography) and concentrated industrial operations. In contrast, cities like Tokyo, Shizuoka, and Xian reported substantially lower APs (typically under 8%), suggesting relatively improved air dispersion, lower emission intensities, and more effective regulatory compliance. These results reinforce the idea that NO2-related health burdens are determined not only by absolute pollutant concentrations but also by local topography, transport patterns, and public health system efficiency.
3.3.1. City-Specific Epidemiological Insights
In Patna, the consistently high central AP for NO2-related natural mortality points to structural air quality challenges that may include cumulative pollution from vehicular sources, stationary combustion, and atmospheric stagnation. The city’s infrastructure and environmental management capacity appear inadequate to manage nitrogen oxide emissions effectively. In Mumbai, elevated AP under high-exposure scenarios likely stems from a mix of heavy construction activity, intense vehicular movement, and high-energy industrial hubs concentrated within densely inhabited areas. Shanghai’s high central AP can be attributed to its industrial legacy and current urban expansion, which collectively maintain high ambient NO2 concentrations. Additionally, Shanghai experiences seasonal meteorological conditions (e.g., high humidity) that can trap pollutants close to ground level. Osaka, despite Japan’s overall strong environmental controls, faces unique challenges due to its location in a low-lying basin that limits natural dispersion, especially during temperature inversions, causing NO2 to accumulate in the urban boundary layer. In contrast, Shizuoka and Tokyo benefit from cleaner transport infrastructure, better urban design, and higher public awareness, all of which contribute to relatively lower NO2 exposure and related health burdens.
3.3.2. Environmental and Physiological Hazards of NO2 Exposure
The toxicological impacts of NO2 are well documented in epidemiological literature. Inhaled NO2 acts as an airway irritant, triggering inflammatory responses and oxidative stress in the respiratory tract. Short-term exposure can aggravate asthma and bronchitis symptoms, particularly in children, while long-term exposure increases the risk of COPD, myocardial infarction, and stroke. Studies have also linked sustained NO2 exposure with impaired lung development in children and accelerated atherosclerosis in adults. From an ecological perspective, NO2 contributes to acid deposition and photochemical smog formation, which can damage crops, forests, and freshwater ecosystems. Additionally, NO2 reacts with volatile organic compounds (VOCs) under sunlight to form ground-level O3, compounding its health impacts and further degrading urban air quality.
3.3.3. Key Determinants of High Attributable Risk
Several factors explain the high AP values observed in cities like Mumbai, Patna, Shanghai, and Osaka. First, traffic congestion remains the dominant source of NO2 in urban cores, particularly from diesel engines and older vehicle fleets. Second, industrial clusters lacking modern emission control technologies emit substantial quantities of nitrogen oxides. Third, geographical constraints, such as valleys or coastal trapping, limit pollutant dispersion, intensifying local exposure. Lastly, population vulnerability, especially among children, elderly, and those with preexisting respiratory conditions, raises the cumulative health burden.
3.3.4. Limitations and Data Considerations
This analysis is based on city-level averages derived from modeled data using AIRQ++ and may not fully capture intraurban variability in NO2 concentrations or health effects. Additionally, while the AP estimates provide a useful comparative tool, they may be influenced by the availability and accuracy of baseline mortality and morbidity data across countries. Meteorological data, spatial distribution of emissions, and individual-level exposure assessments were not incorporated due to data limitations. Future studies should integrate these variables for more localized health risk profiling and to improve the precision of attributable health outcomes.
3.3.5. Mitigation Strategies to Reduce NO2 Exposure
A comprehensive mitigation strategy to curb NO2 emissions must address both technological upgrades and behavioral change. At the policy level, transitioning to cleaner fuels (e.g., compressed natural gas, electricity, or hydrogen) in the transportation and industrial sectors is essential. Regulatory enforcement of Euro-VI or Bharat Stage VI vehicle emission norms, along with mandatory catalytic converters, can significantly reduce tailpipe NO2 emissions. Urban design reforms should promote mass public transit systems including metro rail, electric buses, and bus rapid transit (BRT) to reduce vehicle-kilometers traveled per capita. Anti-idling laws and congestion pricing in dense commercial zones can further limit emissions from traffic bottlenecks. Technological interventions should also focus on optimizing combustion efficiency in industries and power plants, upgrading older boilers and furnaces with low-NOx burners. Additionally, green infrastructure, such as roadside vegetation and urban tree canopies, can assist in passive pollutant capture and atmospheric filtration.
3.4. O3 and Respiratory Mortality: Spatial Patterns and City-Level Disparities
This segment of the study evaluates the relationship between ambient ground-level O3 exposure and respiratory illness-related mortality across urban centers in India, China, and Japan (Figure 4). Unlike primary pollutants, O3 is a secondary pollutant formed through photochemical reactions between nitrogen oxides (NOₓ) and VOCs in the presence of sunlight. The spatial variation in APs of O3-related respiratory mortality highlights notable differences in precursor emissions, meteorological dynamics, and public health infrastructure across the study regions. Among Indian cities, Hyderabad recorded the highest AP for O3-related respiratory mortality, exceeding 8% under high-exposure scenarios. This elevated burden can be attributed to a combination of intense solar radiation, traffic-related NOₓ emissions, and basin-like topography that traps pollutants. Delhi followed with moderately high APs ranging from 4% to 6%, reflecting its status as a dense megacity with persistent smog conditions, particularly during summer months. In contrast, cities like Patna, Kolkata, and Mumbai reported much lower APs (below 3%), indicating either lower O3 formation potential or the dominance of other pollutant-related health risks in those areas. In China, Xian showed the highest O3-attributable mortality, with AP values around 5% in central exposure conditions. The region’s photochemical reactivity, influenced by a combination of urban emissions and stagnant meteorology, may lead to elevated O3 concentrations. On the other hand, cities like Suqian and other eastern cities displayed minimal APs for O3, suggesting lower photochemical activity or successful emissions management. Across Japan, O3-related mortality risks were consistently low. Cities such as Tokyo, Osaka, and Shizuoka recorded negligible APs, mostly under 1% even in high-exposure categories. This reflects the country’s long-standing success in regulating VOCs, minimizing industrial NOₓ emissions, and promoting efficient transport systems, all of which reduce O3 formation. Additionally, Japan’s widespread healthcare access and real-time air quality communication may help mitigate health outcomes through public behavior modifications.
3.4.1. Factors Contributing to Elevated O3-Related Health Burden
The formation and impact of ground-level O3 are governed by multiple interacting variables. High APs in cities like Hyderabad and Xian are likely driven by intense solar radiation that catalyzes photochemical reactions, especially in regions with high vehicular density and limited vertical air mixing. Susceptibility factors such as population age structure, prevalence of asthma or COPD, and smoking habits further compound the respiratory mortality burden. Certain geographic features such as valleys or low-elevation plains often restrict air circulation, allowing O3 and its precursor gases to remain trapped closer to the ground. This extended residence time can intensify exposure, especially during hot and stagnant weather conditions. Furthermore, differences in the availability and reliability of air quality monitoring stations, along with discrepancies in health data quality across cities, can impact the accuracy of O3-AP estimates.
3.4.2. City-Level Observations on O3 Exposure and Health Effects
In Hyderabad, elevated health risks linked to ground-level O3 can be attributed to multiple overlapping factors. The city’s rapid urbanization, increase in paved surfaces, dense traffic corridors, and high summer temperatures provide ideal conditions for photochemical O3 formation. These factors, coupled with limited regulatory enforcement, result in sustained exposure, particularly in densely populated pockets. In Xian, the combination of industrial growth and geographic positioning surrounded by hills that limit air movement contributes to the build-up of O3 precursors like NOₓ and VOCs. Under clear and dry conditions, these compounds react in sunlight, leading to persistent O3 accumulation. On the other hand, Tokyo, Osaka, and Shizuoka report significantly lower O3-related mortality. This trend is likely due to well-implemented emission control policies, wide access to public health advisories, and a high level of public compliance with recommended precautions. These cities also benefit from integrated green infrastructure, regulated use of VOCs, and efficient public transportation systems that reduce precursor emissions.
3.4.3. Health Impacts of Ground-Level O3 Exposure
O3 at ground level is not emitted directly but forms through reactions involving sunlight, NOₓ, and VOCs. When inhaled, O3 acts as a strong irritant to the lungs and airways. Even short-term exposure can lead to coughing, throat discomfort, and reduced lung function. For sensitive groups including children, the elderly, and people with asthma or other chronic respiratory conditions O3 exposure may result in aggravated symptoms and increased hospital admissions. In the cardiovascular system, O3 has been linked to systemic inflammation, which may heighten the risk of heart-related complications such as arrhythmia or ischemic events. Seasonal spikes in O3, particularly during summer, coincide with increased outpatient visits and respiratory complaints. Physical exertion outdoors during peak O3 periods further elevates risk by increasing inhalation rates. Outdoor workers, street vendors, and athletes are especially vulnerable during high-O3 days. Longer-term exposure can also compromise immune responses and elevate the risk of respiratory infections.
3.4.4. Strategies for Reducing O3 Levels and Exposure Risks
Reducing ambient O3 levels requires a focus on limiting both NOₓ and VOC emissions, the two primary ingredients in O3 formation. Urban transportation plays a major role here. Key measures include the promotion of electric mobility, investment in metro and BRT systems, and implementation of odd–even vehicle rules during high pollution days. Cities may also adopt congestion charges or restrict access to central areas during peak hours to reduce vehicular load. From the industrial standpoint, technologies such as selective catalytic reduction (SCR), thermal oxidation systems, and vapor recovery units should be encouraged to treat emissions at the source. Regulations should also target domestic sources by promoting low-VOC consumer products. Public awareness on the use of low-emission paints, aerosols, and cleaning agents can be enhanced through labeling and education campaigns.
In urban design, strategies like increasing green canopy coverage, planting O3-absorbing tree species, and maintaining airflow corridors can aid in natural pollutant dispersion. Reducing energy consumption in buildings especially during peak hours further contributes to lowering precursor emissions from power generation. Combining these strategies creates a more comprehensive framework to manage O3 pollution and reduce its health burden across vulnerable city populations.
3.4.4.1. Analysis of APs of PM2.5 and PM10 Air Pollution Among Cities (Figure 5)

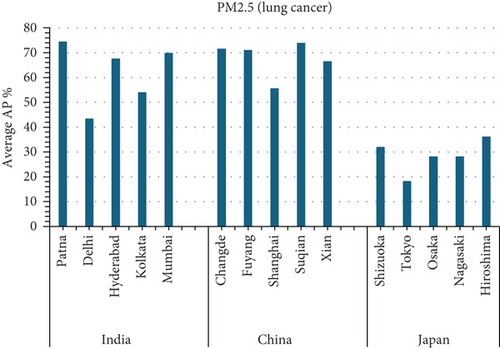
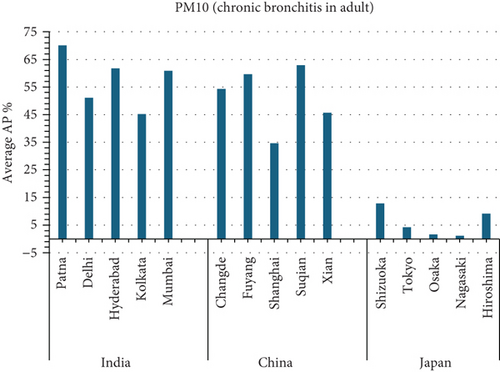
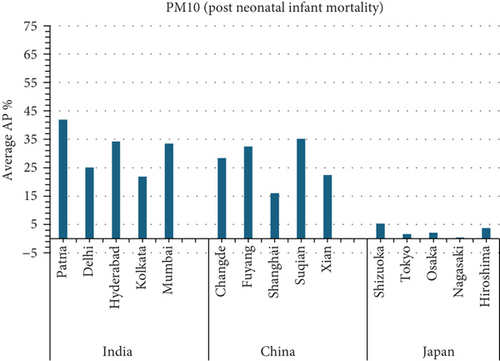
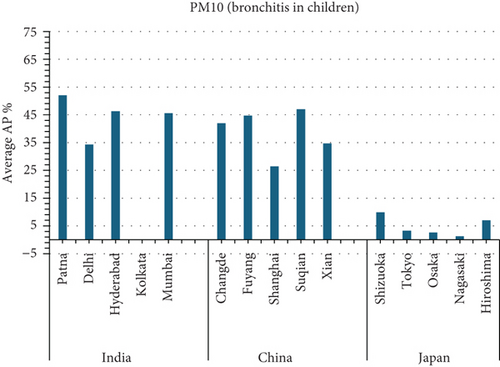
This study investigates the relationship between fine particulate matter (PM2.5) and coarse particulate matter (PM10) air pollution and various health outcomes in 15 cities in India, China, and Japan (see Figure 5). The AP represents the estimated percentage of deaths caused by a certain air pollutant.
3.4.5. Key Findings
- •
Patna, India consistently has the highest average APs in all categories (PM2.5 for natural causes, PM2.5 for lung cancer, PM10 for chronic bronchitis in adults, and PM10 for bronchitis in children).
- •
Tokyo, Japan: generally has the lowest average APs in all categories.
- •
Suqian, China: has high APs for PM10-related postneonatal infant mortality and bronchitis in children.
- 1.
City-specific observations:
- a.
PM2.5 (Figure 5a,b):
- a.
- •
Patna, India has the highest APs for both average PM2.5 mortality from natural causes and lung cancer. This suggests that PM2.5 exposure poses a considerable public health risk in Patna.
- •
Tokyo, Japan has the lowest average PM2.5 mortality from natural causes and lung cancer rates. This suggests that PM2.5 may have a smaller health impact in Tokyo than in other places.
- •
Patna, India has the highest AP for average PM10 AP among individuals with chronic bronchitis.
- •
Osaka, Japan has the lowest average PM10 attributable fraction owing to chronic bronchitis in adults.
- •
Suqian, China and Patna, India had the highest average PM10 death rates associated with post-neonatal infant mortality.
- •
Nagasaki, Japan has the lowest AP for average PM10 mortality due to post-neonatal infant mortality.
- •
Suqian, China, and Patna, India, have the highest average PM10 fatality rates among children due to bronchitis.
- •
Kolkata, India: The lowest AP for average PM10 mortality due to bronchitis in children.
- 2.
Overall observations:
- •
Patna, India, regularly has the highest APs for several PM2.5 and PM10-related health effects. This highlights the crucial need for air quality improvement efforts in Patna.
- •
Tokyo, Japan, often has the lowest APs, indicating that tighter air pollution management methods or other factors contribute to decreased health consequences from PM2.5 and PM10.
- •
Suqian, China, has high APs for particular PM10-related health outcomes, necessitating additional research into local air pollution causes and health risks.
The graph (A) Figure 5 suggests that the average AP% among the 15 cities is highest in Mumbai.
3.4.5.1. Air Pollution and Mortality Rates: A Comparison of Cities (Figures 5 and 6)
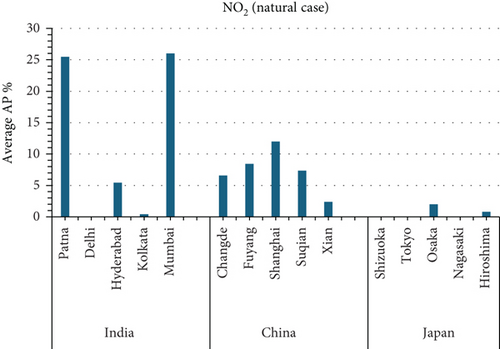
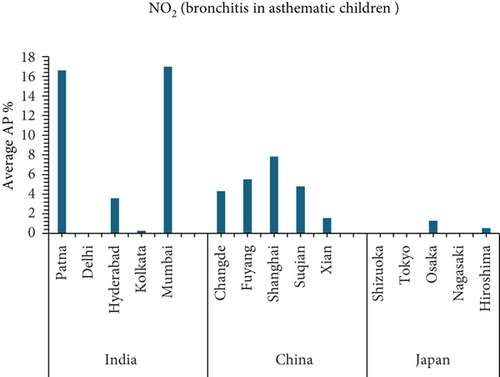
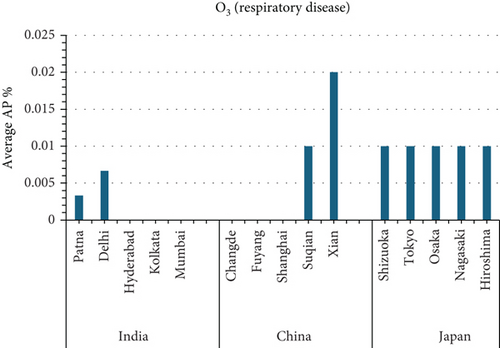
This study investigates the relationship between air pollution and mortality rates from various causes in 15 cities in India, China, and Japan (see Figures 5 and 6). The AP represents the estimated percentage of deaths caused by a certain air pollutant.
3.4.6. Key Findings
- •
Mumbai, India has the highest average AP for NO2-related mortality from natural causes (26.02%).
- •
Shizuoka, Japan, consistently has the lowest average APs for NO2 and O3-related health effects (0%).
- •
Xian, China, has the highest average prevalence of O3-related respiratory disease mortality (0.02%).
- 1.
City-specific observations:
- a.
Figure 5a NO2:
- i.
Mumbai, India, has the highest AP for NO2-related mortality from natural causes, indicating a large public health burden from NO2 exposure in the city.
- ii.
Shizuoka, Japan has the lowest AP for NO2-related mortality, indicating that NO2 has no impact on health in Shizuoka.
- i.
- b.
O3(Figure 6c)
- i.
Xian, China: The highest AP for O3-related respiratory illness mortality, necessitating further research into local air pollution causes and health hazards.
- ii.
Shizuoka, Tokyo, Osaka, Nagasaki, Hiroshima (Japan), Hyderabad, and Kolkata (India) all have 0% AP for O3-related respiratory illness mortality, indicating that O3 may have a lower influence on health in these places.
- i.
- a.
- 2.
Overall observations:
Mumbai, India, appears to have a high AP for NO2-related mortality, emphasizing the importance of air quality improvement measures in the metropolis. In Shizuoka, Japan, notably low AP values for both NO2 and O3 suggest the presence of effective air pollution management practices and well-regulated urban environments. These outcomes may also reflect public compliance with air quality advisories, cleaner transportation systems, and reduced reliance on fossil fuels in both industrial and domestic sectors. By contrast, Xian, China, records a concerning AP related to O3-induced respiratory disease mortality, indicating a possible combination of emission-intensive activities and geographical constraints that trap pollutants during specific seasons. These findings call for further focused investigation into the interaction between precursor emissions, topography, and meteorological conditions in the region. [1].
By emphasizing the spatial variability of health impacts, the research provides valuable evidence for implementing localized air quality management strategies. The insights into urban-specific health burdens will aid policymakers in tailoring interventions to the unique needs of each city. The study uniquely assesses how episodic events such as dust storms, agricultural burning, and seasonal biomass burning contribute to annual average PM concentrations. This focus provides a more accurate understanding of pollutant contributions in each city, especially in regions where such episodic events significantly impact air quality. Evaluating the contribution of episodic events to annual average pollutant levels is an original aspect of this work, as it integrates short-term, high-impact episodes into long-term exposure assessments, adding a critical layer to understanding the dynamics of air pollution. This comparative assessment presents valuable insights into how air pollution affects public health across urban centers in three major Asian countries. The study makes it evident that not all cities face the same level of health risk from air pollutants cities like Tokyo and Osaka demonstrate significantly lower AP values, offering practical models for more polluted urban centers in India and China. Their success in managing air quality through cleaner public transport, stricter emission controls, and better public health outreach could inform strategic improvements elsewhere.
4. Limitations
However, certain limitations need to be acknowledged. The air quality data used in this study were drawn from publicly available monitoring platforms, which, although reliable, may differ in their calibration standards and frequency of data collection. Most data sources are urban-centric, which means the findings may not accurately reflect pollution exposure in nearby suburban or periurban zones. Furthermore, our reliance on annual average pollutant concentrations may underrepresent short-term pollution episodes—such as crop residue burning, festival emissions, or dust storms—which have known acute health effects. The AirQ+ tool used in this analysis is built on RR values derived from epidemiological studies in Western populations. While these provide a standardized basis for global use, they may not fully reflect region-specific vulnerabilities related to healthcare access, genetic factors, or population demographics in South and East Asia. An important methodological adjustment made in this study was the inclusion of individuals aged 18 and above, rather than using the AirQ+ default thresholds (25+ or 30+). This was done to better capture health risks in younger adults, particularly in high-density cities where pollution exposure begins early and remains sustained. While this enhances inclusivity, it slightly limits direct comparability with studies following WHO’s default age cutoffs.
The study also factored in regional pollution episodes such as stubble burning in North India or haze events in Chinese basins, although the exact frequency and pollutant intensities of such events remain difficult to quantify precisely.
5. Conclusion
Using the WHO-endorsed AirQ+ model, the study quantified the proportion of disease and mortality outcomes linked to ambient concentrations of PM2.5, PM10, NO2, and O3 across 15 selected cities. These calculations were grounded in city-wise data and included comparative assessment across three nations. The results clearly flagged Patna, India, as the most impacted urban center, with an AP of 65.66% for PM2.5-related natural mortality and 74.46% for lung cancer—the highest figures among all cities analyzed. The same city also saw the highest burden for chronic bronchitis (70.09%) and post-neonatal infant mortality (41.91%) linked to PM10 exposure. In China, cities like Suqian and Xian also emerged as high-risk zones. Suqian recorded a notable impact on child health due to PM10, while Xian stood out for its relatively high O3-related mortality rate, even though the absolute percentage remained modest at 0.02%. On the other end of the spectrum, Tokyo and Shizuoka in Japan consistently showed the lowest AP values across multiple pollutants, pointing toward the effectiveness of their emission regulations, green transport infrastructure, and proactive public health systems.
Nomenclature
-
- PM2.5
-
- particulate matter less than 2.5 μm in diameter
-
- PM10
-
- particulate matter less than 10 μm in diameter
-
- NO2
-
- nitrogen dioxide
-
- O3
-
- ozone
-
- AP%
-
- attributable proportion percentage
-
- COPD
-
- chronic obstructive pulmonary disease
-
- VOCs
-
- volatile organic compounds
-
- HF
-
- heart failure
-
- APA
-
- attribute proportion analysis
-
- RR
-
- relative risk
Ethics Statement
Ethical compliance necessitates immediate action to address the growing health concerns from air pollution in South, East, and Southeast Asian countries. Using techniques like AIR Q+ for mortality risk prediction demonstrates a commitment to protecting public health and influencing responsible solutions.
Conflicts of Interest
The authors declare no conflicts of interest.
Author Contributions
Abhishek Nandan: conceptualization, methodology, resources, writing – review and editing, supervision. Subhashree Subhasmita Nayak: conceptualization, data collection, methodology, writing – review and editing. Bikarama Prasad Yadav: writing – review and editing, supervision. Damini Rana: writing – review and editing, supervision. Vimal Mohan: methodology, revision, writing – review and editing.
Funding
No funding was received for this manuscript.
Open Research
Data Availability Statement
Data sharing is not applicable to this article as no new data were created or analyzed in this study.


