Indoor Air Quality in Tehran’s Primary Schools: Seasonal Variations and Impact of External Pollution Sources on Pollutant Concentrations—A Comprehensive Analytical Study
Abstract
The children’s sensitivity to high concentrations of pollutants in schools has led to increased attention to indoor air quality in recent years. Hence, the study was aimed at determining the concentration of air pollutants in primary school classrooms in Tehran during one academic year. For this purpose, the research team identified and evaluated primary schools in different regions of the Tehran megacity. Schools with similar characteristics were selected to sample CO2, PM1, PM2.5, and PM10 pollutants in the indoor air of Tehran primary school classrooms. A total of 30 classrooms were sampled in five schools during the autumn, winter, and spring seasons of one academic year, spanning from September 2016 to May 2017. Data analysis was conducted using Python-based tools, including Seaborn and Matplotlib, to generate visual insights. The results showed that the concentration of the pollutants studied differs significantly in winter compared to autumn and spring in the indoor air of the classrooms. The highest CO2, PM1, PM2.5, PM10, and PMTotal concentrations were observed in the north, center, south, south, and south of Tehran, especially in the ground-floor classrooms, respectively. The results of distance from green space, private space, and floors in winter emphasize an internal source of pollution; conversely, in spring and autumn, they show the influence of external sources on the concentration of pollutants inside the classrooms in various areas of Tehran. To summarize, the results of this study showed that the indoor air quality of primary school classrooms in Tehran requires careful investigation and urgent measures to reduce pollutants and improve environmental conditions to maintain the health and comfort of students and school board members.
1. Introduction
Indoor air quality (IAQ) in schools is a fundamental factor in ensuring the health and academic success of students, especially in elementary schools, where children spend a significant portion of their formative years [1, 2]. The cleanliness of the school environment is crucial for fostering both mental and physical well-being, as children spend a large number of hours at school [3]. Classrooms serve as vital environments for children’s learning and development, making it essential to maintain acceptable air quality [1, 2].
Unfortunately, outdoor air pollutants, such as traffic-related air pollution (TRAP), combined with indoor sources, compromise this quality, raising concerns about the well-being of students and staff [2, 4]. TRAP, primarily from high-traffic roads, is a major contributor to health risks, including DNA damage and respiratory illnesses among children [4, 5]. Numerous studies have documented the heightened vulnerability of elementary school students attending schools near these areas, underscoring the critical importance of addressing this issue [5, 6].
Research indicates that certain age groups, particularly children, are more susceptible to air pollution due to their higher air intake relative to body weight and the direct effects of infections on lung growth [7–10]. For instance, research in European and Asian schools has reported indoor PM2.5 concentrations exceeding WHO guidelines, often associated with increased cardiopulmonary symptoms and elevated levels of PAH metabolites in children [11]. In Seoul, Korea, outdoor traffic emissions were found to contribute up to 58.5% of indoor PM2.5, with student activity and air purifier operation playing key roles in determining indoor levels [12]. Similarly, studies in Malaysia and China further underline the influence of earth crust components and industrial activities on PM2.5 chemical composition, with implications for children’s health through ingestion pathways and long-term respiratory outcomes [13, 14]. In a study conducted in Barcelona, Spain, it was found that 47% of indoor PM2.5 concentrations were generated indoors, primarily due to continuous resuspension of soil particles (13%) and a mixed source (34%) consisting of organic matter such as skin flakes, clothing fibers, and possible condensation of volatile organic compounds (VOCs), as well as calcium-rich particles from chalk and building deterioration. Outdoor emissions from seven sources contributed the remaining 53% of indoor PM2.5. Notably, unpaved playgrounds were found to increase mineral contributions in classrooms by an average of 5–6 μg/m3 compared to schools with paved playgrounds [15].
Reports show that students in more polluted areas experience greater academic underachievement, often reflected in significant drops in IQ scores [16]. Children absorb 20%–50% more pollutants than adults because they require more oxygen and have a higher rate of growth and metabolism. Additionally, their liver and kidneys are less capable of detoxifying harmful substances. Their higher physical activity levels and greater exposure to air pollution further exacerbate health risks, especially as they are at critical stages of lung and brain development [17–19].
Exposure to low-quality air during crucial periods of physiological growth significantly impacts children, leading to decreased mental efficiency and long-term health issues [2, 20, 21]. To understand the health risks associated with compromised IAQ, it is essential to examine specific pollutants, particularly particulate matter (PM), and their extensive health impacts, considering children’s heightened vulnerability. Particulate matter can cause and exacerbate various health problems, including cardiovascular diseases [22], respiratory diseases such as asthma [23], chronic obstructive pulmonary disease (COPD) [24], lung cancer [25], and even mental health disorders [26]. Moreover, exposure to ozone (O3), nitrogen dioxide (NO2), and airborne particles can exacerbate conditions like idiopathic pulmonary fibrosis (IPF), with studies showing a correlation between increased NO2 levels and IPF incidence [5]. High concentrations of carbon dioxide (CO2) are also associated with poor occupational health and performance [27, 28]. Recent research has focused on airborne particulate pollutants, particularly PM2.5 and PM10, highlighting their health impacts [29–33]. A study examining prenatal exposure to PM2.5 and greenness in Texas from 1995 to 2011 found that higher prenatal PM2.5 exposure was linked to an increased risk of ependymoma (OR: 1.27, 95% CI: 1.01–1.60). In contrast, greater greenness, as measured by the normalized difference vegetation index (NDVI), was associated with a lower risk of ependymoma (OR: 0.75, 95% CI: 0.56–0.97) and medulloblastoma (OR: 0.75, 95% CI: 0.62–0.91) in children aged 0–4, suggesting potential protective effects of greener environments [34]. Another study from the same period reported that early-life exposure to PM2.5 was associated with various childhood cancers, including lymphoid leukemias (OR: 1.15, 95% CI: 1.07–1.23) and Hodgkin’s lymphoma (OR: 1.27, 95% CI: 1.02–1.58). While increased NDVI exposure reduced the risk of ependymoma and medulloblastoma, it was positively associated with malignant melanoma (OR: 1.75, 95% CI: 1.23–2.47). The findings highlight the complex interplay between air pollution, greenness, and childhood cancer risk [35].
Given these significant health impacts, understanding the interplay between environmental factors and school IAQ becomes even more crucial. Despite extensive research on air pollution, considerable gaps remain in understanding how environmental factors interact with IAQ in school environments. Most studies focus on outdoor air pollution, overlooking the compounded effects of indoor sources such as ventilation quality, classroom density, and proximity to green spaces. Moreover, limited attention has been paid to the seasonal variations of air pollution and its impact on schoolchildren.
The present study is aimed at evaluating the distribution of indoor air pollutants in elementary school classrooms across different geographical regions of Tehran. By examining factors such as proximity to highways and green spaces, classroom density, and floor levels, it investigates their influence on IAQ. This research employs a comprehensive year-long methodology, capturing seasonal variations across three academic terms to provide a detailed understanding of air pollution dynamics in urban schools. Additionally, advanced Python-based analytical models are utilized to enhance the precision and depth of the findings. By focusing on vulnerable elementary school students and adopting an innovative multivariable framework, this study seeks to deliver critical insights for improving IAQ and fostering healthier educational environments.
2. Materials and Methods
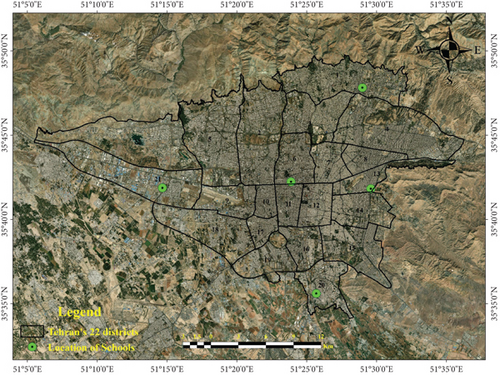
Tehran, divided into 22 districts, had a population of 8.964 million in 2019 [36] with mean 24-h temperature 17.44 and humidity 36.57% in 2011–2020 [37]. It spans 900–1800 m above sea level, creating diverse climates from north to south [36]. Most of the population resides in the central, eastern, and northern areas, where quality of life and economic conditions are better, declining toward the southern regions [38].
To identify and determine the distribution of CO2, PM1, PM2.5, and PM10 pollutants in the indoor air of Tehran primary school classrooms, first, all primary schools of Tehran in cooperation with the Ministry of Education of Tehran, in different regions including North, South, East, West, and Center Tehran megacity were identified and evaluated by the research team (Figure 1).
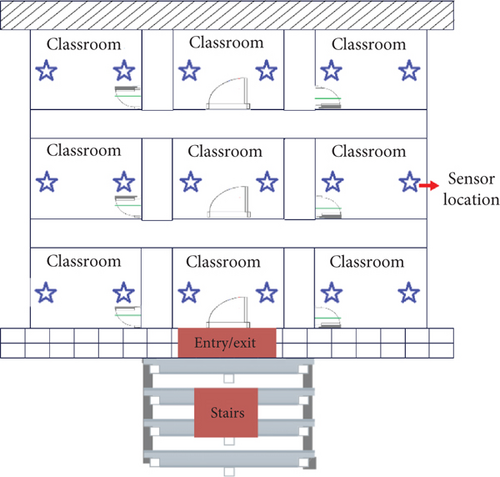
Then, to make the sampling points more homogenous, schools with similar characteristics in terms of the number of building floors, suitable width, number of students, and class size were selected for sampling: Schools with buildings of at least four floors, the number of students in each class from 18 to 24, and class sizes of 28–32 m2 were selected for sampling (Figure 2).
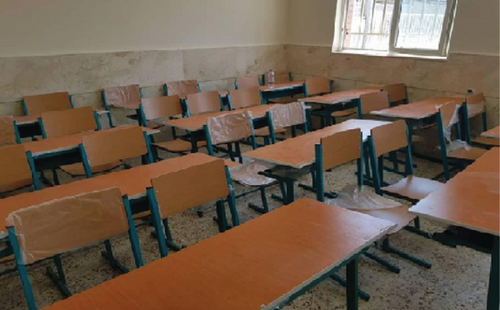
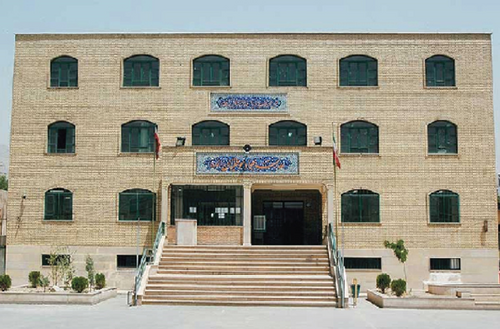
Specifically, all schools have natural ventilation systems relying on windows and doors, with no central air conditioning or advanced air purification systems. The year of establishment for these schools is 2004, 1995, 1982, and two in 2006. Buildings are constructed using reinforced concrete for structural elements, plastered walls, and tiled floors, materials commonly used for public buildings in Tehran due to their durability and cost-effectiveness. A total of 30 classrooms were sampled in five schools. Sampling was done during the autumn, winter, and spring seasons. In each season, sampling was done 12 times from each point with three repetitions during 5 h during the day. After completing the sampling and collecting data, the data were reviewed and analyzed in Excel 2016. Table 1 shows the sampling stations, measurements factors (air pollutants, temperature, and humidity), and devices.
| Location of stations in each school | Factor | Device | Specifications | |||||
|---|---|---|---|---|---|---|---|---|
| School | CO2 | MSA (ALT Air 4x) | Measures carbon dioxide concentration with an accuracy of ±5 ppm or ±1% of the reading, whichever is greater | |||||
| Ground Floor | First floor | Second floor | ||||||
| West edge of school building | East edge of school building | West edge of school building | East edge of school building | West edge of school building | East edge of school building | PM1, PM2.5, and PM10 | Particle Mass Counter (TES 5200) | Measures particle concentrations with a resolution of 0.1 μg/m3, covering a wide range of particle sizes |
| Station 1 | Station 2 | Station 1 | Station 2 | Station 1 | Station 2 | Temperature | Thermometer | Thermometer: Measures with an accuracy of ±0.1 °C |
| Humidity | Hygrometer | Hygrometer: Measures with an accuracy of ±2% relative humidity (RH) | ||||||
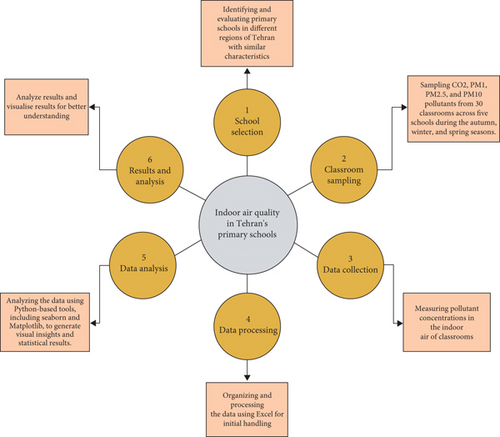
To provide a clear understanding of the research methodology, Figure 3 presents the step-by-step process for IAQ assessment in Tehran’s primary schools.
2.1. Data Visualization and Analysis
In this study, advanced data visualization and statistical analysis tools were employed in the Jupyter environment. Specifically, the widely used libraries Matplotlib and Seaborn in the Python programming language were utilized. Matplotlib is one of the most prominent data visualization libraries in Python, developed by John Hunter with the collaboration of several other developers. It is extensively used in data science, mathematical modeling, and computational research. Matplotlib facilitates the creation of various types of plots, including line plots, scatter plots, bar charts, and pie charts. In the Jupyter environment, Matplotlib integrates seamlessly with NumPy and Pandas, providing the necessary tools to create precise and visually appealing graphics [39, 40].
Seaborn, a graphical library based on Matplotlib, offers more advanced capabilities for data visualization. It provides various features such as variable color mapping and default settings for faceting, simplifying working with Pandas DataFrames. Seaborn is specifically designed for statistical analysis and the visualization of complex data, providing powerful tools for these purposes [41, 42].
In this research, the functionalities of Matplotlib and Seaborn were utilized in the Jupyter Notebook environment for data visualization. The various plots that were designed and generated included boxplots to display the data distribution and identify outliers, correlation matrices to show relationships between variables and examine existing correlations in the data, and pairplots to explore pair-wise relationships between variables and observe potential patterns and correlations.
The use of these tools and techniques in the Jupyter environment enabled effective data analysis, with results presented in a graphical and comprehensible manner. This approach facilitated a more precise data analysis and allowed us to present the findings visually and interpretably to the scientific community.
3. Results
3.1. Determining the Average Concentration of PM Particles and CO2 in Each Classroom by Season
The measurement of indoor air pollutants in the classrooms is shown in Table 2. The t-test was used to compare the mean CO2, PMT,1 PM2.5,2 PM10,3 and PM1 separately in each season. The intergroup comparison showed that the concentration of the studied pollutants differed significantly. Table 2 contains the average concentration of air pollutants in different seasons of the year in 30 students’ classrooms with a measurement frequency of 12 in terms of parts per million (ppm) or milligrams per cubic meter (mg/m3). According to the table, CO2 has a higher concentration in winter and spring than in autumn, with a p value less than 0.0001, which indicates a significant difference. Also, PM1, PM2.5, PM10, and PMT have varying concentrations across different seasons. Some differences seem meaningful. The study has also considered the number of classes and the frequency of measurements. It is worth mentioning that the highest concentrations of CO2, PM1, PM2.5, PM10, and PMT were found in the northern, central, and southern areas of Tehran.
| Po. | Autumn | Winter | Spring | LSD (groups with mean differences based on test) | Sig. (compare the two beginnings) | Sig. (intergroup comparison) | |
|---|---|---|---|---|---|---|---|
| NC = 30 | NC = 30 | NC = 30 | |||||
| FM = 12 | FM = 12 | FM = 12 | |||||
| CO2 (ppm) | 1208.3 ± 502.1 | 1435.1 ± 939.5 | 940.3 ± 433.1 | Winter | Spring | < 0.0001 | < 0.0001 |
| Winter | Autumn | 0.002 | |||||
| PM1 | 0.28 ± 0.1 | 0.67 ± 0.54 | 0.46 ± 0.35 | Winter | Autumn | < 0.0001 | < 0.0001 |
| Winter | Spring | < 0.0001 | |||||
| PM2.5 | 4.1 ± 2.3 | 5.3 ± 2.2 | 4.1 ± 1.2 | Winter | Autumn | < 0.0001 | < 0.0001 |
| Winter | Spring | 0.005 | |||||
| PM10 | 138.4 ± 112.4 | 160.8 ± 87.3 | 133 ± 68.1 | Winter | Autumn | 0.005 | 0.012 |
| PMT | 217.7 ± 136.5 | 255.1 ± 145.7 | 198.8 ± 95.5 | Winter | Autumn | 0.003 | 0.004 |
| Winter | Spring | 0.005 | |||||
- Abbreviations: FM = frequency of measurements, NC = number of classes.
3.2. Analysis of Pollutant Concentrations by Season, Distance From Green Spaces, Highway Proximity, and Classroom Floor
The analysis and interpretation of the results showed that the amount of CO2, PMT, and PM10 was higher in autumn and winter than in spring, and the amount of all the examined pollutants was also significantly higher in winter. Also, the highest concentrations of CO2 were found in the northern part, and the highest PM1 and PM2.5 densities were found in the central and southern parts, PM10 in the southern part, and PMT in the southern part and especially on the ground floor of the classrooms in the northern part of Tehran.
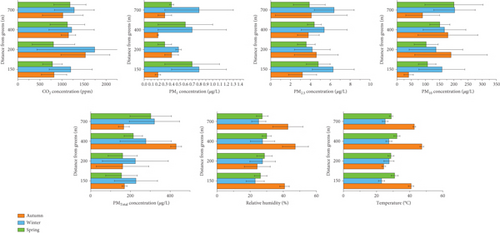
The distance from green spaces did not affect the concentration of particulate pollutants and CO2 in winter (Figure 4a). Meanwhile, the distance from green spaces affected the concentration of this pollutant in spring and autumn.
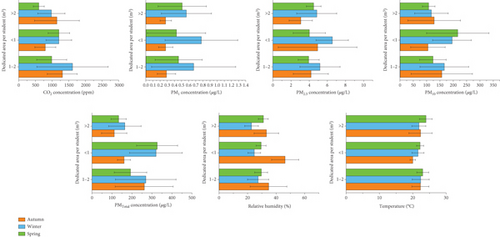
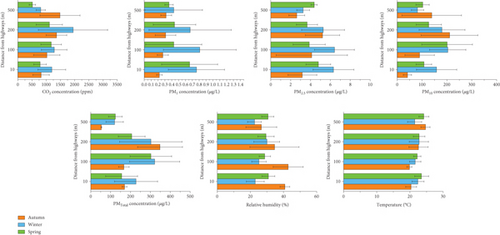
The relationship between pollutants and the area dedicated to each student in the classroom (Figure 4b) suggests that increasing this dedicated area helps reduce the amount of CO2 pollutants in spring. Increasing the dedicated area decreases PMT and PM10 in the indoor air in winter and spring.
According to Figure 4c, during winter, the level of CO2 increases as the distance from highways increases. The highest concentration of CO2 was found 500 m away from highways during this season. In spring, the lowest concentration of CO2 was observed at a distance of 200 m from highways. However, in autumn, the highest concentration of CO2 was recorded at a 200-m distance from highways.
Particle concentrations peaked within 500 m of highways during autumn. In spring and winter, the concentration for all types of particles reached its maximum at a 100-m distance from highways, and the only difference in spring was for PM2.5 at a distance of 10 m.
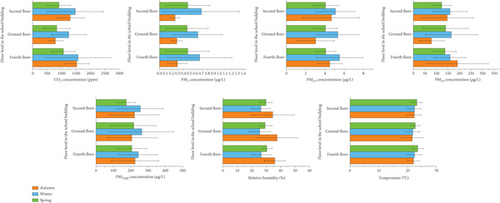
Figure 4d shows the average concentration of the studied pollutants by floor in the school building and season. The concentration of PM1 and PM2.5 particles is higher in the winter season, which is due to reduced ventilation and increased use of heating devices. It leads to a higher accumulation of pollutants inside classrooms. The concentration of PMT also follows this pattern, with higher concentrations in winter compared to spring and autumn. The difference in particle concentration between spring and winter in different classes was not significant, but there was a clear difference in particle concentration between different classes on different floors in the autumn. Specifically, the concentration of PMT on the fourth floor was higher than on the second floor, and the second floor had a higher concentration than the ground floor. Also, this pattern was observed to some extent for PM10 and PM2.5 but not for PM1 particles, where the relationship between class and concentration was not very different.
Table 3 presents the results of examining the relationship between average air pollution concentration and linear distances from tall buildings and skyscrapers in the space of each class. Spearman’s correlation test showed a moderate correlation between the average concentration of CO2 and total suspended particles and the linear distance from tall buildings. When the correlation is about 0.40, a simple group prediction is possible.
| Country | Study number | Effect size or pooled concentration of PM2.5 (μg/m3) | Lower | Upper | Weight (%) | Heterogeneity statistic | Degrees of freedom | p value | I2 |
|---|---|---|---|---|---|---|---|---|---|
| Canada | 2 | 313.39 | 0.24 | 1009.26 | 2.21 | 6.79 | 1 | 0.009 | 85.30% |
| Poland | 1 | 67.00 | 17.10 | 116.90 | 0.14 | 0 | 0 | – | – |
| Poland | 1 | 59.80 | 15.27 | 104.33 | 0.17 | 0 | 0 | – | – |
| South Korea | 1 | 57.20 | 14.59 | 99.81 | 0.19 | 0 | 0 | – | – |
| Turkey | 4 | 55.70 | 6.88 | 104.51 | 1.28 | 11.51 | 3 | 0.009 | 73.90% |
| China | 22 | 50.02 | 36.96 | 63.07 | 7.96 | 139.62 | 21 | 0 | 85.00% |
| Qatar | 1 | 44.45 | 11.35 | 77.55 | 0.30 | 0 | 0 | – | – |
| India | 19 | 44.39 | 36.52 | 52.26 | 5.20 | 9.46 | 18 | 0.948 | 0.00% |
| Serbia | 1 | 43.58 | 11.12 | 76.04 | 0.31 | 0 | 0 | – | – |
| UK | 2 | 38.87 | 18.35 | 59.39 | 0.75 | 0.07 | 1 | 0.795 | 0.00% |
| Taiwan | 8 | 35.04 | 25.21 | 44.87 | 3.06 | 6.58 | 7 | 0.474 | 0.00% |
| Iran | 12 | 33.48 | 24.24 | 42.71 | 5.27 | 15.31 | 11 | 0.169 | 28.10% |
| Kuwait | 1 | 32.60 | 8.32 | 56.88 | 0.51 | 0 | 0 | – | – |
| Spain | 5 | 31.17 | 20.29 | 42.05 | 2.40 | 3.11 | 4 | 0.539 | 0.00% |
| Portugal | 7 | 28.23 | 15.22 | 41.23 | 4.19 | 12.9 | 6 | 0.045 | 53.50% |
| Slovakia | 2 | 20.59 | 9.71 | 31.47 | 1.96 | 0.09 | 1 | 0.769 | 0.00% |
| Italy | 2 | 19.56 | 8.88 | 30.24 | 1.89 | 0.97 | 1 | 0.324 | 0.00% |
| Danmark | 1 | 17.12 | 4.36 | 29.88 | 1.23 | 0 | 0 | – | – |
| France | 3 | 14.41 | 1.07 | 27.74 | 4.25 | 7.25 | 2 | 0.027 | 72.40% |
| Ecuador | 1 | 12.03 | 3.07 | 20.99 | 1.70 | 0 | 0 | – | – |
| Malaysia | 4 | 9.93 | 6.21 | 13.65 | 7.61 | 0.3 | 3 | 0.96 | 0.00% |
| Netherland | 2 | 9.71 | 1.74 | 21.13 | 3.63 | 3.07 | 1 | 0.08 | 67.40% |
| United States | 14 | 7.35 | 5.82 | 8.87 | 28.74 | 7.86 | 13 | 0.852 | 0.00% |
| New Zealand | 1 | 6.90 | 1.77 | 12.04 | 2.26 | 0 | 0 | – | – |
| Sweden | 1 | 5.60 | 1.43 | 9.78 | 2.39 | 0 | 0 | – | – |
| Belgium | 1 | 5.14 | 1.32 | 8.96 | 2.43 | 0 | 0 | – | – |
| Greece | 3 | 1.71 | 0.96 | 2.45 | 7.96 | 0.74 | 2 | 0.689 | 0.00% |
| Overall | 92 | 16.30 | 14.38 | 18.22 | 100.00 | 693.29 | 121 | 0 | 82.50% |
3.3. Pollutant Concentration and Correlation Analysis
3.3.1. Box Plot
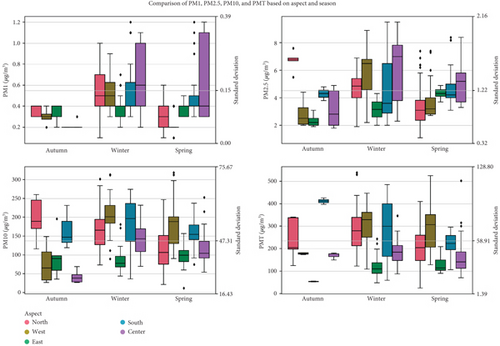
The box plot is used to display the distribution of data across one or more groups, providing information about the median, quartiles, and outliers. As illustrated in Figure 5, analysis of the data reveals that the patterns of pollutant concentrations vary depending on the season and region. In particular, concentrations of PM1 and PM2.5 show a significant increase in southern and central areas during winter, which may be attributed to pollution from residential heating and meteorological conditions. Meanwhile, concentrations of PM10 and PMT differ significantly across various regions, highlighting the impact of local pollution sources and weather conditions. The high standard deviation of these pollutants also indicates a high degree of data dispersion and nonuniformity in pollutant levels.
3.3.2. Correlation Matrix
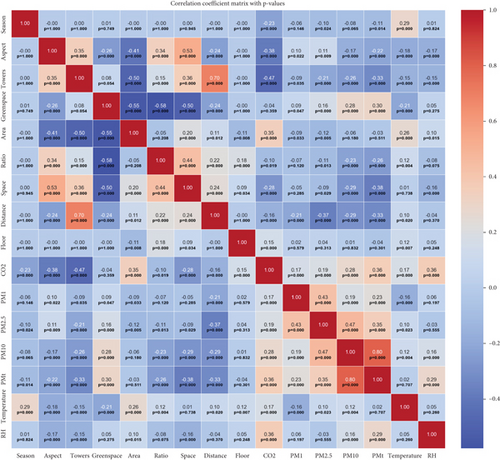
The correlation matrix provides a representation of the correlation coefficients between all pairs of variables, helping to identify linear relationships between them. Correlation coefficients indicate the strength and direction of relationships between variables. This matrix confirms that there is no significant correlation between the concentrations of different pollutants, demonstrating that strong linear relationships between pollutants do not exist. This situation may be due to the enclosed nature of classrooms; particularly during cold seasons like winter and autumn, doors and windows are typically closed. In spring, doors and windows remain closed due to the use of cooling systems and rising temperatures. In Tehran, doors and windows are often kept closed to maintain tranquility and reduce noise from the busy outside environment, minimizing the exchange of air between the interior and exterior spaces.
Under these conditions, pollutant concentrations are influenced by specific factors. CO2 levels increase due to the accumulation of CO2 from students’ exhalations in the confined classroom environment. Additionally, PM concentrations rise for several reasons. First, dust present in classrooms, which may enter through footwear and other sources, contributes to higher PM levels. Second, with very limited air movement, these particles remain suspended in the air and are easily lifted with minimal airflow, leading to elevated concentrations.
These findings suggest that IAQ in educational settings can be significantly impacted by factors such as closed doors and windows and inadequate ventilation.
4. Discussion
The comparison of the mean CO2, PMT, PM2.5, PM10, and PM1 was performed separately in three seasons, including autumn, winter, and spring. The intergroup comparison showed that the concentration of PM2.5, PM1, PMT, and CO2 differs significantly in winter from spring and autumn. Meanwhile, the concentration of PM10 in winter differed significantly only from that in autumn. The concentration of pollutants was determined in each season of the academic year, and there was a significant difference in the pollutant concentrations between winter versus autumn and spring. Although some studies have shown that the outside air and temperature inversion in winter is the main cause of the increase of indoor air pollutants, Elbayoumi et al. stated that the main cause and source of high concentrations of airborne particulates in the indoor air of children’s classrooms are the high concentration of these pollutants in the outdoor air [44]. However, the results of this study and many others show that the main reason for the increase in pollutants in winter is the decrease in air circulation and air movement [45–48]. Vasile et al. showed that a standardized ventilation rate (25 m3/person) reduced CO2 from 2000 to 800 mg/m3 and reduced PM from 300 to 150 μg/m3 in indoor air. It also shows the role of ventilation in reducing indoor air pollutants [47].
The results presented in Figure 4 show that the amount of CO2, PMT, and PM10 was higher in autumn and winter than in spring. Also, the amount of the studied pollutants was significantly higher in winter. An important finding was the significant increase in CO2, PMT, PM10, and PM2.5 in the cold seasons of the year. The number of pollution days and the average concentration of pollutants are also significant findings. For example, CO2 emissions had an average concentration of 1208, 1435, and 940, respectively, during autumn, winter, and spring. Fromme et al. measured pollutants CO2, PM10, and PM2.5 in the summer of 2005 using spectrometers (LAS) in 75 classrooms. This report shows that the average daily CO2 exposure levels for students in class were 1603 ppm in winter and 405 ppm in summer [49].
Ventilation is very prominent in IAQ, which considers the types and methods of ventilation (such as mixing ventilation (MV), displacement ventilation (DV), zone ventilation (ZV), and stratum ventilation (SV)) to play the role of pollutants [48]. These studies have shown that different methods of ventilation lead to a reduction of pollutants. For example, existing studies measured outdoor PM2.5 and its effect on indoor air in 37 mechanically ventilated and mixed-ventilated urban commercial buildings in India, China, the United Kingdom, and the United States for 1 year. The results of this study showed that 10 μg/m3 in PM2.5 outdoors was 19.9% higher than expected indoors. Also, they stated that the performance of mechanical ventilation systems can reduce the penetration of PM2.5 from the open space into the building [50]. Rawat and Kumar also studied different ventilation systems to reduce PM10, PM2.5, and CO2 levels. Their findings showed that 9%–28%, 6%–18%, and 15%–36% depend on the type of system in the classroom air for PM10, PM2.5, and CO2 levels, respectively [51]. Therefore, the study findings consider the lack of ventilation or little ventilation as the main reason for the low impact of pollutants on indoor air from outdoor air.
As Figure 6 correlation matrix shows, there is no strong positive or negative correlation between different variables, and there is no or very little correlation between the studied variables. The lack of correlation between variables such as the season; the distance from green space, towers, and highways; and the level of concentration of pollutants all show that the air inside the classrooms is slightly affected by the outdoor air, which can be caused by the lack of ventilation inside the classroom. This issue is properly addressed in the metropolis of Tehran for reasons such as reducing the penetration of outside noise into the classrooms (because of very high population density, heavy traffic, etc.) and preventing energy wastage because of the system’s heating and cooling in winter and spring. The heavily polluted areas of Tehran are primarily in the south, west, and central regions, whereas the eastern and northern areas have cleaner air. Surprisingly, the box plot results from this study show that the classroom’s indoor air in the northern and eastern areas was sometimes even worse than in the southern and western regions [36, 52]. This demonstrates the minimal impact of outdoor air on the IAQ in Tehran classrooms, highlighting the significant effects of inadequate or improper ventilation. Studies have stated that IAQ is related to changes in the habits of residents, dust, inefficient or poor maintenance of ventilation systems, and VOCs in buildings, which the study results clearly show [46]. In short and considering the mentioned cases, it can be said that indoor air pollution in classrooms is independent of outdoor air pollution, because there is no or very minimal ventilation in Tehran classrooms. In addition, global studies on measuring concentrations of PM2.5 show a high level of variability. Table 3 presents the results of a meta-analysis study that examined data from the beginning of 2000 to July 20, 2020 [43]. This high variability in data across countries and globally underscores the importance of studying IAQ in schools at a local level. Furthermore, it clearly illustrates the limited number of studies available worldwide and in various countries, highlighting the significance of this research and its findings.
5. Conclusion
The data obtained in this study shows that the concentration of pollutants in the respiratory air of classrooms in winter differs significantly with autumn and spring. It happens for many reasons, such as the concentration of exhaled CO2 increases due to a sharp decrease in the ventilation rate or the lack of ventilation in the classrooms; furthermore, the number of students and the space occupied by each can affect CO2 concentration in classes. These cases occur in the winter due to the preservation of heat and energy in the classrooms. On the other hand, regarding other particles, most particles have internal origin in the winter due to the reduction of ventilation and air confinement inside the classrooms. Therefore, the concentration of pollutants effectiveness in the indoor air of classrooms is less affected by their concentration in the outside air in the winter season; as a result, factors such as distance from highways and the impact of traffic and vehicle emissions and parameters such as the impact of green space have little effect on the indoor air of classrooms in the winter season; in other words, the concentration of pollutants in the indoor air is mostly of indoor origin. Nevertheless, in other seasons like spring and autumn, due to the increase in the ventilation rate and exchange with the outside air, the indoor air is more influenced by the ambient air and its effective environmental parameters like the distance from green spaces and highways, as well as various emissions from different sources such as traffic. Therefore, it seems that indoor environments, especially schools, where more individuals assemble in a small space, should adopt different strategies according to different seasons to reduce and control indoor air pollution to ensure people’s health. For instance, measures such as installing proper ventilation systems, optimizing heating and cooling setups, reducing classroom density, and increasing the number of windows, as proposed by Mohammadyan et al. [53], can be effective strategies to minimize the concentration of suspended particles and maintain healthier IAQ for students. However, while this study provides valuable insights, several limitations should be acknowledged. Measurements were taken at specific times and locations, which might not capture all variations in pollutant concentrations across different schools and regions. As a cross-sectional study, it lacks long-term data that could provide a more comprehensive understanding of seasonal and temporal variations. Despite these limitations, the results of this study can be a clear light for the relevant policymakers and decision-makers so that they can use it to maintain the health of society, especially students.
Conflicts of Interest
The authors declare no conflicts of interest.
Author Contributions
Rasul Nasiri: data analysis, interpretation of results, manuscript writing (original draft and revisions), software implementation, statistical processing, visualization, validation, and writing—review and editing. Rasoul Yarahmadi: laboratory support, project supervision, resource provision, study design, funding acquisition, and institutional coordination. Maryam Borhani Jebeli: study design, data collection, and field sampling. Golnaz Yarahmadi: study design, laboratory support, data collection, and field assistance. Soraya Fazeli: data collection and fieldwork. Seyed Poriya Fazeli: field sampling and logistical support. Somaieh Soleimani Alyar: field sampling and coordination. Parvaneh Beyk Mohamadloo: data collection, fieldwork, and field coordination. Elham Maraghi: laboratory support, data curation, and logistical arrangements.
Funding
This work was supported by the Air Pollution Research Center, Iran University of Medical Sciences (Grant Number: IR.IUMS.REC 1396.32118).
Endnotes
1Total suspended particle matter
2PM2.5 refers to atmospheric particulate matter (PM) with a diameter of less than 2.5 μm.
3Refers to particles with a diameter of 10 μm
Open Research
Data Availability Statement
The data that support the findings of this study are available from the corresponding author upon reasonable request.


