Ventilation Effectiveness: Overview of Terminology and Analysis of Influencing Parameters
Abstract
Ventilation effectiveness evaluates the performance of ventilation systems by assessing air exchange and contaminant removal. Optimising ventilation effectiveness in mechanical ventilation systems reduces the required supply airflow rate while maintaining adequate indoor air quality. This review clarifies inconsistent definitions of ventilation effectiveness in standards and literature and provides a comprehensive overview of terms, definitions, and relevant parameters. The review also analyses the influence of variable and building-fixed parameters on ventilation effectiveness using data from selected studies. Contaminant position and supply/exhaust position had the greatest impact on ventilation effectiveness, with maximum absolute changes of 2.1 and 0.94, respectively. Variable parameters, such as air change rate and temperature difference, showed moderate mean absolute changes of 0.28 and 0.15 but significant maximum deviations of 0.85 and 0.4. Building-fixed parameters, including room size and aspect ratio, showed the least influence, with mean absolute changes below 0.1. These results highlight the importance of parameter interactions, such as short-circuit flows caused by higher air velocities. In EN 16798-1:2022, design values for required airflow are based on a ventilation effectiveness of 1. However, the analysis shows large variations around this value, indicating potential deficits in air quality and opportunities for energy savings. This review highlights the need for holistic system design and consideration of parameter interactions to optimise energy efficiency and air quality.
1. Introduction
Mechanical ventilation systems are crucial for energy-efficient buildings with airtight envelopes and high occupant densities, such as schools and offices [1]. Ventilation systems compensate for reduced natural infiltration, support heat recovery, reduce infection risks, and enable cooling concepts. Additionally, mechanical ventilation maintains indoor air quality standards, enhancing occupant satisfaction [2], well-being [3], and productivity [4]. Proper ventilation reduces symptoms of elevated carbon dioxide (CO2) levels [5], airborne disease transmission [6, 7], and exposure to air contaminants [8].
However, mechanical ventilation systems significantly contribute to global building energy consumption [9]. Therefore, improving energy efficiency while maintaining adequate indoor air quality is crucial. Ventilation effectiveness (VE) plays a central role in this effort by assessing the air exchange and contaminant removal performance of ventilation systems. Optimising VE can reduce energy consumption as well as initial and operating costs while maintaining adequate indoor air quality [10, 11].
Previous studies underline the importance of VE. Adili [10] showed that optimising VE in heat recovery ventilation reduced airflow by 33%, auxiliary energy by 34%, and heating demand by 20%. Similarly, Schiavon et al. [11] demonstrated a 15% reduction in energy consumption by optimising VE. These results highlight the energy-saving potential of VE without compromising indoor air quality.
Despite the high relevance of VE, it is defined inconsistently across standards and science literature. Standards such as EN 16798-3:2017 [12] and ASHRAE 62.1-2022 [13] define VE in terms of contaminant concentration ratios. In contrast, well-cited publications [14–17] use a more comprehensive definition that includes both air exchange and contaminant removal.
Other approaches, such as perceived air quality metrics (olf and decipol) introduced by Fanger [18] and the air distribution index (ADI) developed by Awbi et al. [19–21], provide additional methods for assessing indoor air quality. Olf and decipol can estimate the percentage of dissatisfied occupants, with VE playing an important role [22]. However, these metrics rely on human perception and have inherent limitations [23]. The ADI combines thermal comfort and air quality factors, with VE as a central component [19]. However, these methods are not discussed further in this article as they are based on optimising VE and are limited in their practical applicability and use.
The choice of ventilation concept significantly affects VE. Established approaches like mixing ventilation (MV) and displacement ventilation (DV) dominate research and practice, while alternative concepts such as jet, personalised, and unsteady ventilation show potential for improvement. Studies report VE values up to 1.4 for impinging jet ventilation [24–27], while confluent jet ventilation often outperforms DV [28–30]. Personalised ventilation enhances local VE and reduces energy consumption by delivering fresh air directly to the breathing zone [31, 32]. Unsteady ventilation has been shown to optimise VE under certain conditions [33].
Despite their potential, alternative ventilation concepts differ significantly from conventional systems, complicating comparisons. Their limited use in practice and lack of literature on VE further hinder evaluation. Therefore, this review focuses on conventional ventilation concepts (MV and DV), which are widely studied and applied in practice.
The primary aim of this review is to clarify the term “ventilation effectiveness,” which is defined inconsistently across standards and scientific literature. These inconsistencies hinder the comparability of studies and thus the optimisation of ventilation systems. This review addresses these challenges by providing a unified framework for evaluating VE, supporting both research and practical applications. Another key objective is to assess how variable and building-fixed parameters influence VE. Therefore, the review analyses data from existing studies, summarises the sensitivity of VE to individual parameters, and highlights potential interactions with other parameters. These findings are particularly relevant for practical applications, as they provide guidance on how to design energy-efficient ventilation systems while maintaining the required indoor air quality.
2. Review Methods
The review process begins with a database search conducted in Web of Science, Google Scholar, and Nautos (a database for standards). Table 1 shows a list of the main and limiting search terms used to refine the search.
| Main search terms | Narrowing search terms | |
|---|---|---|
| Ventilation effectiveness | Ventilation efficiency | CFD simulation |
| Air change effectiveness | Air change efficiency | Experimental study |
| Contaminant removal effectiveness | Contaminant removal efficiency | |
| Age of air | Mechanical ventilation | |
The main search terms focus on parameters related to the concept of VE, while the narrowing search terms reduce the scope to relevant studies. These terms were combined using the Boolean operator “AND,” resulting in 21 search combinations. The review includes publications up to January 2025.
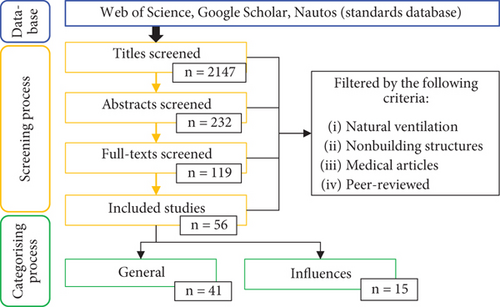
The review process is illustrated in Figure 1 and involved two main steps: screening process and categorisation process. During the screening process, titles, abstracts, and full texts were reviewed to identify relevant studies. In the categorisation process, the 56 selected studies were divided into general studies and influence studies. General studies discuss VE concepts, and influence studies examine the influence of specific variables and building-fixed parameters.
- 1.
General studies:
- •
Focused on definitions, frameworks, or concepts related to VE.
- •
- 2.
Influence studies:
- •
Focused on single parameter studies to enhance comparability across studies.
- •
Limited to studies using the standard-based definition of VE (e.g., EN 16798-3:2017). Studies using alternative definitions were excluded for consistency.
- •
Included simulations only if validated through experimental results.
- •
Studies lacking clear documentation, transparency, and replicability were excluded.
- •
3. Theoretical Basics
The basic parameters shown in Table 2 are relevant to discuss the term VE.
| Air change rate | Nominal time constant | Actual air change time |
|---|---|---|
| τr,v = 2 · τv |
The air change rate n quantifies the number of room air changes per hour at a constant supply airflow and under fully mixed flow conditions. It is defined as the ratio of the supply airflow to the room volume Vro and is independent of the ventilation system and airflow pattern [14].
The nominal time constant τn represents the reciprocal of the air change rate and indicates the theoretically shortest average air residence time in a room. The nominal time constant does not depend on the ventilation system and the flow pattern [14].
The actual air change time τr,v indicates the actual real time for complete air change in the room and depends on the ventilation system and airflow pattern. The air change time is equal to twice the mean age of air τv. The mean age of air assesses the air exchange as discussed in Section 4.3.1 [16].
Finally, Table 3 lists the indices used in the context of VE.
| Index | Definition | Index | Definition |
|---|---|---|---|
| ro | Of the room | oz | Occupied zone |
| s | On supply duct | e | On exhaust duct |
| v | Mean value in a volume (e.g., the room) | p | Value at a position |
| r | Residence | n | Nominal |
| a | Air | c | Contaminant |
The efficiency of air exchange and contaminant removal depends on the ventilation concept and flow pattern. Figure 2 schematically shows three typical ventilation concepts (piston flow, displacement flow, and fully mixed flow) and one flow pattern (short-circuit flow). In piston flow, outdoor air (blue) replaces contaminated air (red) without mixing. Displacement flow introduces colder supply air from below. This air rises due to thermal buoyancy, creating a zone of uncontaminated air in the lower part of the room. Fully mixed flow is a theoretical approach that aims for uniform air distribution throughout the room. Short-circuit flow occurs when the outdoor air takes a direct path from the inlet to the outlet resulting in a contaminated air zone in the lower part of the room. Short-circuit flow results from inadequate consideration of the room airflow and/or the ventilation system.

4. VE
4.1. Significance and Context
Indoor air quality is essential for occupant health, comfort, and productivity. Contaminants such as CO2, carbon monoxide, volatile organic compounds (VOCs), mould, radon, and particulate matter (PM) originate from various sources, including occupants and furnishings [34, 35]. The significance of PM has grown, especially due to the COVID-19 pandemic, with studies highlighting its substantial impact on morbidity and mortality [36, 37]. PM carries organic and inorganic contaminants, such as toxic metals, sulphates, and nitrates [38–40]. These contaminants must be effectively removed to maintain healthy indoor environments.
Mechanical ventilation systems play a central role in removing these contaminants. Studies show that virus particles, which are typically smaller than 10 μm [41], follow the airflow closely and can be effectively removed by mechanical ventilation systems [36, 42]. Standards such as EN 16798-1:2022 [43] and ASHRAE 62.1-2022 [13] and WHO guidelines for indoor air quality [44] set limits for various indoor contaminants. In addition, the standards EN 16798-3:2017 [12], ISO 16000 series, DIN 1946-6 [45], EN ISO 7730:2005 [46], and ASHRAE 55-2020 [47] are commonly used to assess and monitor indoor air quality.
Understanding both definitions is essential to clarify the concept of VE. The influence analysis in Section 5 focuses on the standard-based definition.
4.2. Standard-Based Definition
Equation (1) relates the difference between contaminant concentrations in the exhaust air and supply air ΔCe to the difference between contaminant concentrations in a volume of interest and supply air ΔCv.
The standard-based definition of VE can be applied locally (e.g., to an occupied zone) or globally (e.g., to the entire room). The value of Cv is averaged over the investigated volume. Ideal fully mixed flow condition results in , where the contaminant concentration in the room is equal to that in the exhaust air. Values greater than one indicate enhanced contaminant removal. In such cases, more contaminants are concentrated in the exhaust air compared to the volume of interest, which is typically observed in piston flow scenarios.
The terms “ventilation effectiveness,” “contaminant removal effectiveness,” and “ventilation efficiency” are often used synonymously in standards and literature [16, 48, 49]. ASHRAE 62.1-2022 [13] uses the term “zone air distribution effectiveness” to describe VE.
4.3. Science-Based Definition
The standard-based definition focuses on contaminant removal, whereas the science-based definition includes additional parameters to characterise both air exchange and contaminant removal. Well-cited publications from Raatschen [14], Liddament [15], Mundt et al. [16], and Sandberg [17] define VE as a generic term used to evaluate the performance of a ventilation system. Sandberg [50] highlighted that airflow patterns and contaminant flow patterns can be different. As a result, Sandberg concluded that no single parameter can fully characterise and describe the effectiveness of a ventilation system [17, 51]. Based on this, VE is classified into two classifications: air exchange and contaminant removal. This results in six parameters which are either global (relating to a volume of interest) or local (relating to a particular position).
Figure 3 provides an overview of VE terminology based on the scientific literature. The parameter VE as defined in the standard-based approach is synonymous with contaminant removal effectiveness in the science-based definition. This synonymously used term represents the intersection between the standard-based and the science-based definition. As shown in Figure 3, Section 4.3.1 focuses on parameters describing air exchange, while Section 4.3.2 focuses on parameters describing contaminant removal.

Finally, Table 4 summarises the nomenclature, equations, definitions, and value ranges of parameters presented in this review article. Based on Figure 3, the table distinguishes between two categories: air exchange parameters (first three parameters) and contaminant removal parameters (last three parameters).
| Mean age of air | Air change efficiency | Local air change index | Ventilation effectiveness | Local air quality index | Contaminant removal efficiency | |
|---|---|---|---|---|---|---|
| Equation | τv = 0.5 · τr,v | |||||
| Unit | % | — | % | — | — | % |
| Definition | Average time the air stays in the room, beginning to “age” as it enters | Ratio of the theoretical shortest and actual residence time in the room | Ratio between the theoretical shortest time and local mean age of air | Evaluates contaminant removal from the room or occupied zone | Evaluates contaminant removal at a specific (local) position | The efficiency of removing contamination from sources in a room |
| Scope | Global | Global | Local | Global | Local | Global |
| Ref. | [17, 53] | [53] | [53] | [12, 17] | [15] | [54, 55] |
| Typical parameter ranges for three different ventilation concepts and one flow patternd | ||||||
| PFa | — | 100% | — | ≥ 1 | — | 100% |
| DFb | — | 50%–100% | — | ≥ 1 | — | 50%–100% |
| FMFc | — | 50% | — | 1 | — | 50% |
| SCFd | — | ≤ 50% | — | ≤ 0.5 | — | ≤ 50% |
- aPiston flow.
- bDisplacement flow.
- cFully mixed flow.
- dShort-circuit flow.
4.3.1. Air Exchange
Air exchange describes the process of replacing indoor air with outdoor air to maintain air quality and reduce indoor contaminant concentrations. Parameters such as mean age of air, air change efficiency, and local air change index are described in detail below.
The concept of mean age of air was introduced by Sandberg [17] and uses the statistical mean age of air distribution in a room. Air begins to “age” as it enters the room, with longer residence time leading to higher contaminant concentrations. In contrast, “young” air represents recently introduced and uncontaminated air. Sandberg and Sjöberg [56] distinguish between the mean age of air τv and the local mean age of air τp. The mean age of air τv is a global measure. It indicates the average time air stays in a room before being exhausted and is calculated as the average of all local mean age of air values in the room. The local mean age of air defines the average time period between the air entering the room and reaching a particular position. The mean age of air and local mean age of air reveal global and local deficits in indoor air exchange and allow the implementation of targeted air treatment measures [57].
Figure 4 clarifies the concept, based on the ideal piston flow and the ideal fully mixed flow. In ideal piston flow, the mean age of air increases linearly from the inlet to the outlet and is therefore half of the nominal time constant. In an ideal fully mixed flow, the mean age of air and the local mean age of air are equal to the nominal time constant throughout the room [16].

The concept of mean age of air is the basis for assessing air exchange and is used for the following parameters: air change efficiency and local air change index.
The air change efficiency is defined as the theoretically shortest air residence time, achieved in ideal piston flow [16], relative to the actual air residence time under real flow conditions. This comparison defines its value range from 0% to 100%, with 100% representing ideal piston flow [16]. The ideal fully mixed flow achieves an air change efficiency of 50%, as the air residence time is doubled due to mixing, as shown in Figure 4. The limited value range enables a comparable scale, resulting in consistent interpretation of results across different rooms, ventilation systems, and input parameters. A detailed description of air change efficiency is given by Sutcliffe [53].
The local air change index compares the theoretically shortest possible air residence time with the average time air takes to travel from the inlet to a particular point in the room. The local air change index evaluates specific zones within a room. The parameter helps to identify areas with insufficient ventilation and enables targeted improvements. Note that the term “local air change efficiency” is often used synonymously for the local air change index [16, 53, 59].
4.3.2. Contaminant Removal
Contaminant removal evaluates how effectively a ventilation system removes contaminants from a room. Parameters such as contaminant removal effectiveness, local air quality index, and contaminant removal efficiency are described in detail below.
The contaminant removal effectiveness is defined identically to the standard-based definition of VE presented in Section 4.2 and is given by Equation (1). It quantifies how effectively contaminants are removed from a volume of interest [17].
The local air quality index highlights areas with high contaminant concentrations, which can vary significantly depending on the location of the contaminant source [60]. Identifying these deficiencies enables targeted ventilation improvements. Note that the terms “local ventilation efficiency,” “local ventilation effectiveness,” and “local contaminant removal effectiveness” are used synonymously for local air quality index [15, 49, 61, 62].
The difference compared to standard-based VE is evident in the value range and the interpretation of the values. Fully mixed flow conditions () indicate equal contaminant concentrations in the room and exhaust air, resulting in a contaminant removal efficiency of 50% [15]. Skaret [63] explained this as the probability of contaminant molecules remaining in the room equals the probability of them leaving. For , the contaminant removal efficiency approaches 100%. The limited range from 0% to 100% allows for a direct and simple assessment of contaminant removal performance.
4.4. Measurement Methods
Accurate measurement of air exchange and contaminant removal parameters is crucial for evaluating ventilation performance and validating simulation models. The parameters shown in Figure 3 can be determined using various measurement methods.
The tracer step-down and the tracer step-up methods are the most commonly used techniques for measuring parameters characterising air exchange [51, 57]. The step-down method introduces tracer gas into the room and ensures uniform mixing with indoor air. After stopping the gas supply, the decay of tracer gas concentration is measured over time. The step-up method involves continuously injecting tracer gas at a constant rate. The tracer gas concentration is recorded until a steady state is reached [55, 57].
Parameters related to contaminant removal can also be measured using tracer gas methods [51, 55]. However, these measurements require knowledge of the contaminant source positions. Tracer gas concentrations are typically measured in the supply air, exhaust air, and at significant points or volumes of interest. Measurements for a volume of interest are averaged from multiple points distributed throughout the space [58, 64].
In addition to experimental methods, computational fluid dynamics (CFD) simulations are commonly applied to model indoor air exchange and contaminant removal. CFD provides a detailed representation of airflow and contaminant distribution, complementing experimental measurements. A comprehensive procedure for the verification, validation, and reporting of indoor CFD analyses is provided by [65]. In addition, the REHVA Guidebook No. 10 [66] provides recommendations and best practices for setting up CFD simulations for indoor airflows.
4.5. Conclusion
VE is a crucial concept for evaluating and optimising ventilation systems. The term “ventilation effectiveness” includes both the standard-based and science-based definitions, which provide different perspectives on ventilation performance. The standard-based definition focuses on contaminant removal and provides a practical basis for determining the required supply airflow rate, as described in EN 16798-3:2017 [12]. In contrast, the science-based definition expands the concept with additional parameters to evaluate the air exchange and contaminant removal. These complementary approaches enable a comprehensive evaluation of the ventilation system.
Among the various parameters described in this article, air change efficiency and VE are the most commonly used [67]. Air change efficiency allows the comparison between different ventilation systems, rooms, and input parameters independently of contaminant source locations. This is particularly useful during the design stage of a ventilation system when the number and positions of the contaminant sources are often unknown. VE complements air change efficiency by considering the contaminant removal from the room. Furthermore, VE directly influences the required supply airflow rate as mentioned before. Therefore, optimised VE can reduce the required supply airflow rate, which saves energy and leads to reduced initial and operational costs [68, 69].
The application of these parameters varies depending on the design and operating phase of the ventilation system. During the design stage, the focus should be on VE if the position, intensity, and number of contaminant sources are known [70]. Otherwise, the focus should be on air change efficiency. During the commissioning stage, local parameters such as the local air quality index become particularly relevant, as they address occupant-specific air quality and allow for the implementation of targeted optimisation measures. By combining these parameters, designers can ensure both energy efficiency and adequate indoor air quality at different planning stages of ventilation systems [16].
5. Analysis
The design values for the required supply airflow in EN 16798-1:2022 [43] assume a VE of 1. Deviations from this value lead to over- or underestimations of the required supply airflow, resulting in either poor indoor air quality or increased energy consumption. Therefore, understanding the impact of variable and building-fixed parameters on VE is essential for optimising ventilation systems. In this analysis, the term VE refers to the standard-based definition, as described in EN 16798-3:2017 [12] and ASHRAE 62.1-2022 [13].
- •
Variable parameters: These are dynamic conditions that can be adjusted during operation to optimise system performance and maintain indoor air quality under varying conditions.
- •
Building-fixed parameters: These are determined during the planning phase and remain unchanged throughout the system’s lifecycle, as they cannot be easily adjusted after installation.
This categorisation is particularly relevant for practical applications. During the planning phase, the focus is on optimising building-fixed parameters to ensure efficient system performance. In contrast, variable parameters are adjusted during the system’s operation to adapt to changing needs.
In order to investigate the influences of these parameters, single parameter analyses are useful, often applying the “One Factor At a Time” (OFAT) method. This method varies one parameter while holding all others constant, allowing for a clear understanding of individual effects [71]. By isolating individual impacts, the OFAT method also enables comparisons between different studies, even when experimental setups vary.
Most studies focus on small office spaces (12–24 m2), with two exceptions: Berg et al. [72] analyse a classroom of approximately 68 m2, and Lee et al. [73] use a test chamber of just 0.6 m2. The variations in the studies selected for analysis are highlighted in Table 5 to provide context for the analysis. Table 5 lists and categorises the analysed parameters to provide a foundation for the subsequent analysis in this section.
| Parameter | Ventilation system | Experimental | CFD | Parameter value range | |
|---|---|---|---|---|---|
| MV | DV | ||||
| Variable parameter | |||||
| Air change rate | [73–77] | [78] | [73, 74, 76–78] | [75] | 0.5–10 h−1 |
| Air temperature differencea | [72, 77, 79, 80] | [77, 81] | [77, 79–81] | [72] | −10.3°C to 3.9°C |
| Area per occupant | [72, 74] | [72] | [74] | [72] | 2–19 m2 per occupant |
| Contaminant position | — | [78] | [78] | — | — |
| Building-fixed parameter | |||||
| Room size gainb | [75] | — | — | [75] | −25% to 100% |
| Room aspect ratioc | — | [82] | — | [82] | 0.5–2.5 |
| Supply and exhaust position | [77, 80, 83–86] | [82] | [77, 80, 83] | [82, 84–86] | — |
- aTemperature difference between room air and supply air.
- bUniform scaling of the room, maintaining aspect ratio and central contaminant source.
- cRatio of room length to width; only the room length is varied.
5.1. Impact of Variable Parameters on VE
Variable parameters, such as air change rate n, air temperature difference ΔT, area per occupant, and contaminant position, play a crucial role in the operational performance of ventilation systems. These parameters can be adjusted during operation to respond to changing conditions and maintain adequate indoor air quality. Understanding their influence on VE is essential for optimising energy efficiency and air distribution in practical applications.
In this analysis, the influence of each parameter is evaluated using standard-based VE as a benchmark. Diagrams are used to visualise the change in VE relative to reference values, as well as the reference values themselves. This approach provides a comprehensive understanding of how each parameter affects VE and highlights key considerations for system design and operation.
5.1.1. Air Change Rate
Figure 5 shows the influence of air change rate n on VE . In the left diagram, a negative slope indicates that increasing the air change rate reduces the VE. Negative values on the y-axis indicate that VE has decreased compared to the reference value at the start of the study. The values in the right diagram serve as baseline indicators, allowing for comparisons across studies despite variations in experimental setups or room configurations.
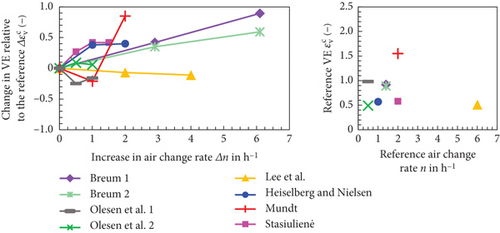
Surprisingly, the results indicate no consistent trend between air change rate and VE. Breum [74] studied DV systems and observed an increase in VE with rising air change rates. In contrast, Stasiulienė [75] and Heiselberg and Nielsen [76], both investigating MV, show a saturating effect. Small increases in air change rate initially improve VE, but further increases lead to reduced or even negative effects. While increased air mixing can initially improve contaminant removal, excessive mixing can disrupt the contaminant removal processes, thereby reducing VE. This is in line with the concept of “age of air,” as mixing flows keep air and contaminants in the room longer than piston flow (Figure 4). Additionally, reductions in VE can be attributed to increased short-circuit flows caused by higher supply air velocities, which are a direct result of higher air change rates.
The study by Lee et al. [73], conducted in a 0.6 m2 test chamber, presents an outlier. VE decreases significantly with increasing air change rate, underscoring the risk of short-circuit flows when supply and exhaust positions are suboptimal. Olesen et al. [77] and Mundt [78], examining MV and DV, respectively, observed no clear trend between air change rate and VE. Therefore, Olesen et al. [77] noted that the highest airflow rate does not necessarily mean better VE. Similarly, Mundt [78] demonstrated an initially declining curve followed by a sharp rise, further highlighting the variability in how air change rate influences VE across different ventilation systems.
In practice, these findings emphasise the critical importance of carefully planning air change rates. The adjustments to air change rates can have a significant impact on VE. Potential interactions such as short-circuit flows should be considered during system design and operation.
5.1.2. Air Temperature Difference
Figure 6 displays the influence of temperature difference ΔT between room air and supply air on VE .
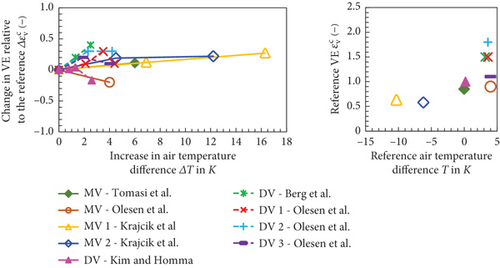
The results show distinct trends for DV and MV. DV is studied by Berg et al. [72], Kim and Homma [81], and Olesen et al. [77] and generally shows an increase in VE with increasing ΔT. This is because a higher ΔT enhances buoyancy flows (natural thermal convection), which improves air exchange and contaminant removal. Kim and Homma [81] explicitly highlight the dependence of stratification effects on ΔT and the positioning of supply and exhaust. While stratification is typically beneficial in DV, higher ΔT values can result in inefficient contaminant removal if the supply and exhaust positions are poorly aligned with these flows.
MV is studied by Krajcik et al. [80], Tomasi et al. [79], and Olesen et al. [77] and shows more variable trends. Krajcik et al. [80] show that VE improves as the initially negative ΔT (warmer supply air than room air) becomes less negative or positive. This highlights the challenges associated with small or negative ΔT. Similarly, Tomasi et al. [79] show improvements in MV with larger ΔT, driven by buoyancy effects. In contrast, Olesen et al. [77] start with a positive ΔT, but further increases reduce VE. This underlines the point made earlier that excessive ΔT values can disrupt airflow patterns and reduce VE.
In practice, these findings highlight the sensitivity of VE to temperature differences and the interaction with supply and exhaust position. The correct positioning of supply and exhaust is essential to take advantage of the buoyancy effects driven by higher ΔT.
5.1.3. Area per Occupant
Figure 7 shows the influence of area per occupant on VE . Berg et al. [72] analysed a classroom (68 m2) under full occupancy (31 occupants) and partial occupancy (13 occupants), adjusting the air change rate according to the number of occupants. Breum [74] investigated a small office (19 m2) with one and two occupants at a constant air change rate.
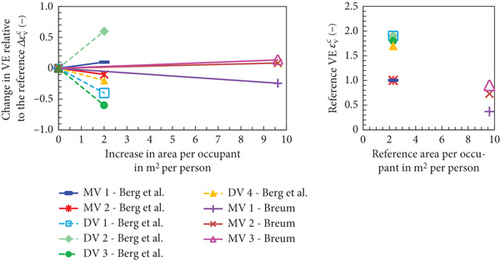
The results illustrate the impact of area per occupant on VE in DV and MV. Berg et al. [72] show that MV exhibited less sensitivity to changes in area per occupant density compared to DV. Notably, DV achieved higher reference VE values than MV. In addition, Berg et al. [72] indicate that partial occupancy often leads to a reduction in VE in DV. This sensitivity and reduction in VE likely result from the reliance of DV on buoyancy flows. The buoyancy flow is influenced by the number and positioning of the occupants as a source of heat. Additionally, the interaction between the area per occupant and the set air change rate, as well as the positioning of supply and exhaust air openings, can further influence VE.
Similar to Berg et al. [72], the study by Breum [74] shows minimal differences in VE for MV with varying area per occupant.
In practice, these findings underline that DV is more sensitive to changes in area per occupant due to their dependence on buoyancy flows to VE. Therefore, careful consideration of air change rate adjustments and supply and exhaust placement is essential, particularly for DV.
5.1.4. Contaminant Position
Figure 8 illustrates the influence of contaminant position on VE. Unlike the previous diagrams, the following diagram presents the absolute VE as a function of the contaminant position. The circled data points represent groups of VE values under similar conditions, such as the same air change rate (Mundt [78]) or identical supply and exhaust configurations (Berg et al. [72]).
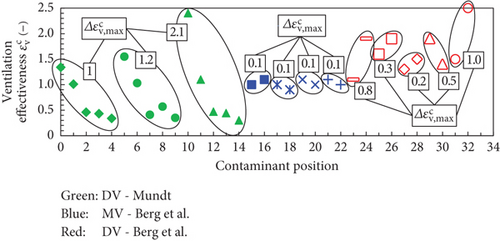
The results demonstrate a significant impact of contaminant position on VE for both DV and MV systems. Mundt [78] studied the effect of a single contaminant source in a test room with DV. The results show considerable variation in VE up to 2.1, with higher values observed when the contaminant source is positioned near a warm object due to buoyancy-driven airflow. However, the study is limited to a single contaminant source, varying only its height and distance to the heat source. Therefore, its applicability is limited to more realistic scenarios involving multiple contaminant sources.
Berg et al. [72] investigated a classroom and found that DV is more sensitive to changes in contaminant position compared to MV, as clearly shown in the diagram. In addition, changes in contaminant source position often require adjustments to furniture arrangements (e.g., tables and chairs), which also can influence airflow patterns and thus VE.
In practice, these findings show that in DV, strategic placement of heat sources and careful design of supply and exhaust configurations are essential to improve VE. In contrast, MV is more robust to changes in contaminant position.
5.2. Impact of Building-Fixed Parameters on VE
Building-fixed parameters such as room size, room aspect ratio (AR), and supply and exhaust positions are essential to the design of ventilation systems. Once established during the design phase, these parameters influence air distribution and contaminant removal throughout the operation of the system. Understanding their effect on the VE is crucial to optimising energy efficiency and ensuring effective air distribution in practical applications.
5.2.1. Room Size Gain
Figure 9 shows the influence of room size gain on VE , based on data from Stasiulienė [75]. In this study, the room size was scaled uniformly while maintaining the AR. The air change rate was kept constant at 2 h−1 by proportionally increasing the supply airflow. The contaminant source remained centrally positioned, while a heated dummy was mounted near a wall. The distance between the heated dummy and the wall remained constant. Thus, the distance between the contaminant source and the heat source increases with increased room size.

The results show a slight decrease in VE with increasing room size. This decrease can be attributed to two factors. Firstly, the distance between the contaminant source and the heated dummy increases. This weakens the effect of the convective airflow generated by the dummy, reducing the VE. Secondly, maintaining a constant air change rate requires proportional increases in supply airflow, which in turn increased supply air velocities. This introduces interactions similar to those seen in the air change rate analysis, where higher supply air velocities can create short-circuit flows.
It is important to recognise that these results are based on a single study, which limits their general applicability. Furthermore, the interactions between room size scaling, contaminant source positioning, and increased airflow highlight the complex dynamics of airflow in scaled rooms.
5.2.2. Room AR
Figure 10 shows the influence of room AR on VE , based on the data from Askari et al. [82]. In their study, the ARs were varied while keeping the room area constant. The room AR is defined as the ratio of room length to width. The air change rate was kept constant in all cases to isolate the effect of room AR. The study employed a DV system.
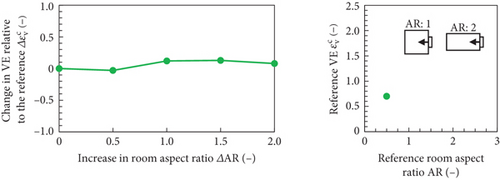
The results indicate minimal sensitivity of VE to changes in room AR under the conditions studied. Askari et al. [82] observed that at lower ARs, VE initially decreases due to interaction between the supply air momentum and the nearby front wall, which limits the air distribution. As room AR increases, VE improves slightly, probably due to reduced front wall interactions and more stable airflow patterns.
It is important to recognise that these results are based on a single study, which limits their general applicability. The authors conclude that the effect of room AR on ventilation system performance is highly complex due to the interactions involved.
5.2.3. Supply/Exhaust Positions
Figure 11 displays the influence of supply and exhaust positioning on VE. Similar to Figure 8, this diagram presents the absolute VE as a function of supply and exhaust positions. Importantly, all studies examined MV systems, except for Askari et al. [82], which focused on DV.
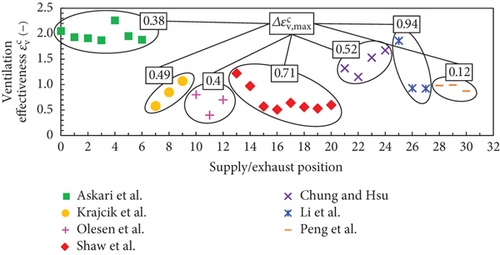
The results of seven studies highlight the different effects of various supply/exhaust configurations on VE. As shown in Figure 11, positioning has a clear influence on VE, with notable maximum differences in VE .
Askari et al. [82] highlight that shifting the supply position interacted with furniture obstructions and resulted in reduced VE. Krajcik et al. [80] reported the lowest VE when both supply and exhaust were in the ceiling. In contrast, a lower exhaust position improved VE by allowing supply air to reach the occupied zone more effectively. Olesen et al. [77] point out in their study that VE varies significantly with different supply and exhaust positions, especially at low air change rates. Shaw et al. [83] emphasised that placing supply diffusers closer to contaminant sources significantly improved VE by creating more targeted airflows. Chung and Hsu [84] demonstrated that placing supply and exhaust diffusers at the same height on opposite walls improved VE more effectively than increasing air change rates. Li et al. [85] and Peng et al. [86] highlighted the importance of exhaust position. Li et al. [85] observed the highest VE when exhaust outlets were directly above occupants on the ceiling. Shifting the exhaust position to the wall near the floor decreased VE. In contrast, Peng et al. [86] show that lower exhaust placements improved VE.
Overall, these findings highlight the sensitivity of VE to supply/exhaust positioning, as small adjustments can significantly affect airflow patterns and contaminant removal. At the same time, these results highlight the complexity of the interactions associated with changing supply and exhaust positions, which can lead to contrasting results depending on system design and operational scenarios.
5.3. Conclusion on the Impact of Parameters on VE
The analysis highlights the different effects of both variable and building-fixed parameters on VE. Figure 12 summarises these results, showing the mean absolute changes and maximum absolute changes in VE for each parameter.
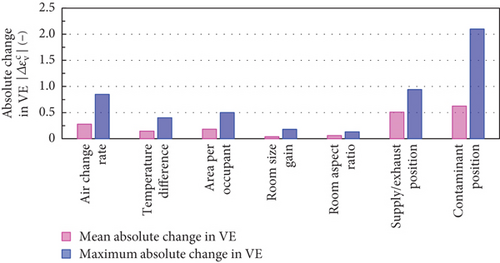
These metrics reveal both the overall sensitivity and the potential extremes of the influence of each parameter on VE. Contaminant position and supply/exhaust positioning show the highest sensitivity, with a substantial mean (0.63 and 0.51) and maximum changes (2.1 and 0.94) in VE. The high sensitivity of contaminant position is partly attributed to Mundt’s study [78] focusing on a single contaminant source. Although this limits its practical applicability, the study remains valuable for understanding the dynamics of DV.
In contrast, parameters such as air change rate and temperature difference show moderate mean changes (0.28 and 0.15) but higher maximum changes (0.85 and 0.4). This discrepancy is due to interactions such as increased air velocities at higher air change rates, which can lead to short-circuit flows and reduce VE.
The building-fixed parameters, room size gain, and room AR have the least influence on VE, as reflected by their low mean and maximum absolute changes. Although their direct influence on VE is minimal, the studies demonstrate the interactions with other parameters, which should not be neglected despite their small influence.
Overall, these results show that all parameters influence VE, although their influence varies considerably. Furthermore, interactions between parameters complicate the analysis, making it difficult to isolate the effect of a single factor. These results highlight the importance of a holistic approach to ventilation system design, taking into account the interaction between parameters, in order to optimise system performance.
6. Summary and Conclusion
This study highlights the critical role of VE in the design and operation of energy-efficient ventilation systems. The review clarified inconsistencies in the definition of VE in standards and scientific literature. The review also evaluated the impact of variable and building-fixed parameters on VE.
VE was analysed from two perspectives: the standard-based definition, which focuses on contaminant removal, and the science-based definition, which broadens the concept to include air exchange and contaminant removal. These complementary approaches allow a comprehensive evaluation of ventilation systems. Air change efficiency supports early design stages by providing an assessment independent of contaminant sources. Meanwhile, standard-defined VE ensures optimisation of the supply airflow for energy-efficient operation.
The analysis revealed the varying sensitivity of VE to different influence parameters. Contaminant and supply/exhaust position had the greatest impact on VE, with maximum absolute changes of 2.1 and 0.94, respectively. Variable parameters, such as air change rate and temperature difference, showed moderate mean changes (0.28 and 0.15). However, maximum changes were higher (0.85 and 0.4) due to interactions, such as short-circuit flows caused by increased air velocities. Building-fixed parameters, including room size and AR, showed the least influence, with mean changes below 0.1, but interactions with other parameters were evident.
These results highlight the complexity of parameter interactions, making it difficult to isolate the effect of a single factor. In practice, these results highlight the need for a holistic design approach that integrates both variable and building-fixed parameters to optimise energy efficiency and indoor air quality. In addition, the design values of EN 16798-1:2022 assume a VE of 1 for the required supply airflow. However, the analysis reveals variations in VE around this value, indicating potential deficits in indoor air quality and opportunities for energy savings.
Further studies should prioritise the investigation of parameter interactions to better understand their combined effects on VE. The use of advanced monitoring technologies and machine learning could help to understand these interactions and could improve energy efficiency and indoor air quality in real time.
Disclosure
The work presented is part of the doctoral project of Paul Hennies.
Conflicts of Interest
The authors declare no conflicts of interest.
Author Contributions
Writing and visualisation: P.H. Formal analysis: P.H. Writing—review and editing: E.B. and K.S. Supervision and project administration: E.B. and K.S. All authors have read and agreed to the published version of the manuscript.
Funding
The doctoral project of Paul Hennies is supported by a scholarship from Stiebel Eltron GmbH & Co. KG (DE).
Acknowledgments
Stiebel Eltron GmbH & Co. KG (DE) supports the doctoral project with a scholarship. The authors would like to express their gratitude to Stiebel Eltron for their financial support and to Dr. Ulrich Stiebel for strongly supporting scientific work at HAWK University of Applied Sciences and Arts. The authors wish to acknowledge the support of Wolfgang Viöl, Vice President of Research and Transfer at HAWK, who always encourages scientific ambitions and open-source publications in particular.
Open Research
Data Availability Statement
Data sharing is not applicable to this article as no new data were created or analysed in this study.


