Determinants of Carbon Dioxide Exposure for Residents and Staff of Nursing Homes: A Field Monitoring Study in Spain
Abstract
Providing high air quality is crucial to the health and well-being of older people living in nursing homes. A measurement study was undertaken in 22 communal rooms of five nursing homes in Spain to investigate the effects of heating, ventilation, and air-conditioning (HVAC) systems, room characteristics, and occupant activities on the indoor air quality. The study included 196 periods of data collection (equivalent to 5282 measurements). To the authors’ knowledge, this is the first study of indoor air quality in Spanish nursing homes. The study found that mean CO2 concentrations were consistently below established standards, although notable peaks were evident due to specific activities. Natural and cross ventilation had a clear role in maintaining CO2 concentrations below recommended levels. The findings indicate that lower occupancy density may be required in rooms where high-CO2-generating activities take place, such as gym–physiotherapy rooms. The results showed that the older residents and staff were both more thermally comfortable at higher CO2 concentrations. This suggests that striking a balance between air quality and thermal comfort is necessary. The study provides useful insights for the design of ventilation systems and spatial layouts of nursing homes, which can achieve higher levels of indoor air quality and occupant well-being.
1. Introduction
Built spaces, both indoors and outdoors, must be adapted to the needs of the older population. Research in this field is rising as the number of people over 65 years worldwide is projected to triple by 2037, and in Spain specifically, they will constitute 27% of the population [1]. Consequently, demand for assisted living and nursing home facilities will grow rapidly, and understanding how such spaces should be designed and operated for the benefit of their primary users is crucial.
Older people spend almost 90% of their time indoors [2–4], and therefore, indoor environmental conditions have greater effects on their health and well-being [5–8]. Asthma, respiratory infections, cardiovascular sickness, chronic obstructive pulmonary disease, cancer, nausea, upper respiratory difficulties, and cognitive impairment are just some of the health conditions that have been linked to poor indoor air quality (IAQ) [9–11]. Low ventilation rates and crowded indoor environments have also been shown to increase levels of bacteria, gases, particulate matter, and viruses which can lead to negative health outcomes for the older people [12]. Furthermore, indoor environmental factors, including carbon dioxide (CO2) levels, have been associated with behavioural issues like wandering, aggression, and agitation in older people with dementia which negatively impacts their quality of life [13, 14].
Previous research, such as by Reddy et al. [3], argued that in addition to introducing enforceable IAQ standards, nursing homes should be regularly monitored to proactively identify and address weaknesses and that resources should be made available for remedial measures to improve IAQ, such as source control, improved ventilation and filtration, and the use of air cleaners. The authors propose that this would result in improved health, well-being, and quality of life for the older people and as a result reduce medical costs.
Many previous studies have undertaken measurements of CO2 concentration and assessed its effects on humans [15–18]; however, field studies specifically addressing nursing homes are lacking in the literature compared to other building types. Related to the current paper, Guerra Santin et al. [19] studied a range of spaces in a Passivhaus care home for people with dementia in England and found that the percentage of time that CO2 concentrations exceeded 900 ppm was highest in winter, and the researchers also raised concerns about the positioning of the mechanical ventilation (MV) in bedrooms to maintain good IAQ. Baudet et al. [20] reported a mean CO2 concentration of 572.1 ± 106.0 ppm measured over 4.5 days in four elderly care facilities in France, although peaks in excess of 1000 ppm were also observed. Mendes et al. [7] studied six urban care centres for older people in Portugal and found that CO2 concentrations exceeded an international recommended level of 1080 mg/m3 (600 ppm CO2) in winter but fell below this level in summer. The authors concluded that low ventilation rates and crowded indoor conditions were associated with the higher concentrations observed. Gupta et al. [21] measured CO2 levels in two lounges in two different London-based care homes and found mean concentrations of 1027 ppm in one and below 500 ppm in the other. The variation was attributed to a larger floor area, lower occupancy density, and greater ventilation.
Although not specifically studies of nursing homes, Chen et al. [11] investigated the indoor environment of rural older people’s houses in several climatic zones of China and discovered high CO2 levels at night, which were associated with decreased ventilation rates due to the closure of doors (Ds) and windows (Ws). Also, Serrano-Jiménez et al. [22] investigated naturally ventilated social housing occupied by older adults during different seasons in Spain. High levels of CO2 were particularly evident in winter, and this was attributed to lower ventilation rates (i.e., fresh air infiltration and occupant ventilation behaviour, such as opening Ws) during the winter season.
These previous studies have shown that CO2 concentrations in buildings occupied by older people sometimes exceed internationally recommended levels, and this may result in negative health and well-being consequences for this population. The current study adds to this limited but growing body of literature by reporting on, to the authors’ best knowledge, the first study of CO2 concentrations in nursing homes undertaken in Spain.
The aims of the current paper were (i) to measure the concentrations of CO2 in a range of different space types (living, dining, occupational therapy, and gym–physiotherapy rooms) in five Spanish nursing homes and compare these with recommended values from national and international standards; (ii) to assess the effects of heating, ventilation, and air-conditioning (HVAC) regimes, room characteristics, and occupant activities on the levels of CO2 observed; and (iii) to discuss the implications of the findings for improving air quality in nursing homes.
2. Methodology
The study was carried out in five nursing homes located in Madrid, Spain, between April and August 2021 (warm months) and between October 2021 and February 2022 (cold months).
The CO2 measurements were taken in 22 communal rooms used in the five nursing homes by the building residents (older people) and the support staff (caregivers and therapists) during the day while doing their typical activities. These include the living room, where the nursing home residents spend time watching TV and doing other quiet activities such as playing cards or reading; dining room, where residents have their meals; gym–physiotherapy room, where residents performed directed physical exercises, such as light movements with the help of the physiotherapist, in groups while seated; and occupational therapy room, where residents typically participate in group activities, such as word games and singing.
The nursing home residents were all older than 65 years old with a range of different cognitive and physical abilities. The support staff were nonresidents and were generally younger adults (25–35 years old). In relation to the study, they were those with the capacity to open or close Ws and Ds to ventilate the rooms.
The research was approved by the ethics committee of the Universitat Politècnica de Catalunya (UPC, Spain), and informed consent was obtained from participants before data collection commenced. The reference number of the ethics application is 2020.01.
2.1. Room Characteristics
The communal rooms investigated were mostly located on the ground floor (L0) of the nursing homes. The dimensions of the rooms varied between nursing homes and the activity they were designed for, with the living rooms and dining rooms being the largest. Apart from one room (occupational therapy room in NH4), the rest all had at least one W and one D, which could be open or closed during the measurements to provide natural and cross ventilation. All rooms were also ventilated by MV systems, which were solely controlled by a preprogrammed schedule of operation.
The MV systems in the nursing homes were centralised and operated according to specific preprogrammed schedules. In NH1, the HVAC system includes two boilers, one chiller, and two-pipe fan coil units. Ventilation is provided by four supply and exhaust fans strategically positioned at different ends of the building, each serving specific floors within their respective zones. These fans do not include heat recovery systems. Ventilation operates twice daily, following peak occupancy periods, but it is not linked to any monitoring system to optimise airflow or adjust based on real-time needs. In NH2, the HVAC system is a VRV with 16 outdoor units: three per floor dedicated to the rooms and one serving the common areas. The ventilation system features heat recovery units, with two units per floor located in the false ceilings of the common areas. NH3 and NH4 both employ an HVAC system with two boilers, two chillers, and two-pipe fan coils for heating and cooling. In NH3, forced ventilation is delivered via five zoned fans that operate for 2 h around midday. In contrast, NH4 relies entirely on natural ventilation, achieved by opening Ws early in the morning and after lunch to promote airflow. In NH5, the HVAC system consists of a two-pipe setup with one chiller and one boiler connected to fan coil units and air handling units that serve the common areas.
The airflow rates in these systems were not manually adjustable by staff and were set to function according to the aforementioned schedules, though specific airflow rates were not measured in this study. Maintenance of the MV systems was carried out periodically to ensure their proper functioning, though the frequency and extent of these procedures varied across the nursing homes.
Fan coils were used to cool or heat the spaces. Table 1 presents the main characteristics of the investigated rooms in each nursing home. All rooms had a similar floor to ceiling height of 2.8–3.1 m. Figure 1 provides some additional information of the investigated rooms.
| Nursing home | Space | Floor area (m2) | Floor level | Window area (m2) | Average occupancy (min–max) |
|---|---|---|---|---|---|
| NH1 | Occupational therapy room | 35.0 | L0 | 1.6 | 9 (7–16) |
| Living room | 123.3 | L0 | 14.4 | 17 (10–34) | |
| Gym–physiotherapy room | 47.0 | L0 | 12.6 | 14 (10–16) | |
| Dining room | 54.3 | L0 | 3.4 | 19 (11–27) | |
| NH2 | Occupational therapy room | 101.9 | L1 | 29.9 | 16 (8–20) |
| Living room a | 56.7 | L2 | 11.4 | 19 (11–27) | |
| Living room b | 145.3 | L1 | 29.9 | 17 | |
| Living room c | 156.4 | L0 | 11.4 | 14 (9–19) | |
| Gym–physiotherapy room | 172.5 | L1 | 14.7 | 19 (14–25) | |
| Dining room | 167.6 | L0 | 26.8 | 37 (28–49) | |
| NH3 | Occupational therapy room | 65.4 | L0 | 17.3 | 23 (17–30) |
| Living room | 126.4 | L0 | 17.3 | 36 | |
| Gym–physiotherapy room | 61.0 | L0 | 10.3 | 10 (8–12) | |
| Dining room | 81.1 | L1 | 8.1 | 23 (17–31) | |
| NH4 | Occupational therapy room | 89.2 | L0 | — | 14 (12–17) |
| Living room | 125.5 | L0 | 21.7 | 25 (18–35) | |
| Gym–physiotherapy room | 89.2 | L0 | 3.0 | 18 (12–19) | |
| Dining room | 81.5 | L0 | 29.1 | 41 (28–48) | |
| NH5 | Occupational therapy room | 97.5 | L0 | 15.5 | 20 (7–32) |
| Living room | 103.7 | L0 | 28.9 | 28 (15–36) | |
| Gym–physiotherapy room | 47.1 | L0 | 14.5 | 11 (7–15) | |
| Dining room | 81.5 | L1 | 17.5 | 37 (31–43) | |
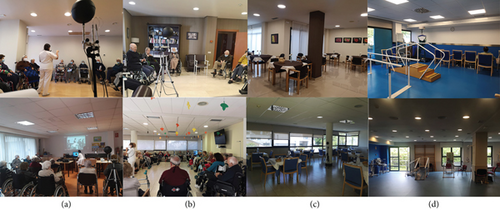
All five nursing homes were in areas not classified as highly polluted. Each facility was located within 2 km of a State Meteorological Agency (Agencia Estatal de Meteorología, AEMET) weather station, ensuring reliable environmental monitoring. Outdoor CO₂ levels remained between 400 and 420 ppm, consistent with typical background concentrations and indicating no significant elevation due to pollution. Note that the exact locations of the nursing homes are not disclosed to maintain anonymity in accordance with the study’s ethical procedures.
2.2. Data Acquisition
The data collection was undertaken between April and August 2021 and October 2021 and February 2022 in five different nursing homes. During those months, each nursing home was visited 7–11 times by the researchers. In each visit, CO2 concentrations were measured in the four types of rooms discussed in the paper. The measurements took place between 10:00 am and 6:00 pm, in intervals up to 60 min (excluding the stabilisation period) per room, depending on the room and the activity being carried out by the residents.
A total of 22 communal rooms were monitored during the study, resulting in 196 periods of data collection (equivalent to 5282 measurements). This sample is comparable to that of other studies such as [23], which focused on four academic buildings and 15 rooms, and [24], which analysed six buildings.
The number of occupants present in each room during each measurement period was counted and recorded directly by the researcher. During the measurement period, the room occupancy and the ventilation conditions (by means of the MV or the opening of Ds/Ws) did not change.
2.2.1. CO2 Measurements
A portable air quality datalogger (Delta OHM HD 21ABE17, accuracy: ±50 ppm + 3% of the reading, range of 0–5000 ppm) was used to record CO2 measurements every minute. Before data collection commenced, the sensor was calibrated according to the manufacturer’s instructions. The equipment was allowed a 10-min stabilization period before measurements began. Regular checks were performed during the study to ensure the sensor remained within its specified accuracy range.
The sensor was placed at a height between 1.2 and 1.5 m from floor level (according to the ANSI/ASHRAE Standard 62.1 [25], the height of the breathing zone is described as 0.75–1.8 m above the floor) and more than 1 m away from walls, Ws, and ventilation outlets.
2.2.2. Thermal Comfort Survey
During the CO2 measurement periods, the nursing home residents and support staff were also surveyed to determine their thermal sensation vote (TSV). A customised right-here-right-now survey was used to collect subjective comfort evaluations. The questionnaire consisted in one simple question about the TSV, which was assessed using the ASHRAE 7-point thermal sensation scale (−3 cold, −2 cool, −1 slightly cool, 0 neutral, +1 slightly warm, +2 warm, +3 hot) [26]. The TSV was assessed by asking participants: “How do you feel at this precise moment?” A figure-based survey was given to residents to facilitate their understanding of the thermal scales.
On average, 80% of the occupants of the room being measured completed the TSV survey (see occupancy numbers in Table 1). Throughout the study and its multiple measurement periods, a total of 3359 surveys were completed: 2873 were filled by residents (2189 women, 684 men), and 486 were completed by support staff (435 women, 51 men).
2.3. Data Analysis
2.3.1. IAQ Standards
The Spanish technical standard for the design of HVAC systems [27] establishes different IAQ levels depending on building type. For nursing homes, it recommends “Good air quality” (IDA2), as a maximum CO2 concentration level of 500 ppm above the outdoor air CO2 concentration (considered to be 300–400 ppm by this Spanish standard) [28]. Therefore, the Spanish standard recommends maximum CO2 levels of 800–900 ppm in nursing homes.
Similarly, the European standard EN 13779 [29], which sets up the performance requirements for ventilation and room-conditioning systems for nonresidential buildings, recommends a “Medium IAQ” (IDA2) of 400–600 ppm CO2 concentration levels above the level of outdoor air (considered to be 400 ppm by this EU standard).
The CO2 concentrations measured during the experimentation were classified according to the IAQ categories defined by EN 13779 (Table 2), and an 800–900 ppm CO2 concentration range was used as a recommended IAQ for nursing homes in line with the Spanish technical standard.
| IAQ category | Description | CO2 level above level of outdoor air (ppm) (typical range) | Total CO2 level (ppm), based on outdoor CO2 level of 400 ppm |
|---|---|---|---|
| IDA1 | High IAQ | ≤ 400 | ≤ 800 |
| IDA2 | Medium IAQ | 400–600 | 800–1000 |
| IDA3 | Moderate IAQ | 600–1000 | 1000–1400 |
| IDA4 | Low IAQ | > 1000 | > 1400 |
2.3.2. Methods of Analysis
Descriptive statistical analysis (minimum, maximum, mean, median, and standard deviation) was used first to describe CO2 levels and data trends in relation to (i) room type, (ii) ventilation regime (MV ON/OFF and Ws and Ds open/closed), (iii) heating or cooling regime (heating/cooling ON/OFF), and TSV (unidimensional). For each of these scenarios, the cumulative frequency of CO2 levels falling in each of the IAQ categories was analysed.
Predictive statistical analysis (regression) was used to understand how CO2 levels (dependent variable) can be predicted given different independent variables. In this study, regressions were used to show how mean CO2 levels are related to average occupancy density (groups of 1 m2/p) and (i) room type, (ii) ventilation regime, and (iii) heating/cooling regime. In evaluating regression fits, consideration was given to the expected CO2 levels in a virtually infinite space (around 400 ppm, as a representation of an open space), indicating a nonlinear decrease with occupancy density. An assessment of multiple regression lines (linear, logarithmic, power, and exponential) indicated that a power regression line provided the best coefficients of determination. A power regression line is represented as y = axb, R2 = n, where y is dependent and x is the independent variable. The R2 was used to measure the proportion of the variation in the dependent variable which is explained by the model [30].
Data were analysed using Microsoft Excel and Statistical Package for the Social Sciences (SPSS).
3. Results
3.1. Overview of CO2 Concentration Measurements
During the study, 5282 CO2 concentration measurements were collected in the dining rooms (1817), living rooms (1192), gym–physiotherapy rooms (908), and occupational therapy rooms (1365) of five nursing homes.
Measured CO2 levels ranged from 287 to 1558 ppm, with the highest frequency of measurements falling within the 500–800-ppm range. Table 3 contains the descriptive statistical analyses (minimum, maximum, mean, median, and standard deviation) of the CO2 levels recorded during the study. It can be observed that all mean values are below the 800-ppm threshold, indicating that all rooms achieved at least an IAQ category of IDA3, as shown in Table 2.
| No. of measurements | Min (ppm) | Max (ppm) | Mean (ppm) | Median (ppm) | SD | |
|---|---|---|---|---|---|---|
| CO2 levels by room type (5282 measurements) | ||||||
| Dining room | 1817 | 373 | 1334 | 645 | 619 | 158 |
| Living room | 1192 | 379 | 1090 | 541 | 521 | 119 |
| Gym–physiotherapy room | 908 | 384 | 898 | 596 | 574 | 118 |
| Occupational therapy room | 1365 | 287 | 1558 | 713 | 669 | 119 |
| CO2 levels by ventilation regime (5173 measurements) (MV = mechanical ventilation) | ||||||
| MV OFF | 1103 | 379 | 1558 | 638 | 596 | 179 |
| MV ON | 4070 | 287 | 1558 | 632 | 592 | 175 |
| MV OFF: W+D closed | 333 | 395 | 1558 | 660 | 596 | 235 |
| MV OFF: W+D opened | 193 | 386 | 1090 | 613 | 582 | 144 |
| MV OFF: Either W or D opened | 577 | 379 | 1202 | 633 | 602 | 147 |
| MV ON: W+D closed | 526 | 395 | 1558 | 739 | 703 | 250 |
| MV ON: W+D opened | 830 | 384 | 997 | 555 | 547 | 117 |
| MV ON: Either W or D opened | 2714 | 287 | 1334 | 635 | 603 | 160 |
| CO2 levels by heating/cooling regime (5282 measurements) | ||||||
| Heating | 1817 | 387 | 1557 | 665 | 628 | 170 |
| Cooling | 1564 | 287 | 1314 | 561 | 540 | 124 |
| No cooling/heating | 1901 | 386 | 1558 | 655 | 594 | 197 |
| CO2 levels by thermal sensation vote (TSV) (residents and support staff) (3359 measurements) | ||||||
| TSV < 0 | 447 | 336 | 1058 | 619 | 615 | 123 |
| TSV = 0 | 2528 | 336 | 1058 | 625 | 599 | 136 |
| TSV > 0 | 384 | 336 | 1058 | 622 | 599 | 140 |
The numerical data on the number and percentage of CO2 concentration measurements falling in the four IAQ categories are presented in Table 4. In this study, CO2 levels exceeded 800 ppm in 15.8% of the cases, while 4.2% of the measurements were above 1000 ppm, and 0.3% exceeded 1400 ppm.
| All data | No. of measurements | IDA1 (< 800 ppm) | IDA2 (800–1000 ppm) | IDA3 (1000–1400 ppm) | IDA4 (> 1400 ppm) | ||||
|---|---|---|---|---|---|---|---|---|---|
| 5282 | 4447 | 84.2% | 612 | 11.6% | 207 | 3.9% | 16 | 0.3% | |
| CO2 levels by room type (5282 measurements) | |||||||||
| Dining room | 1817 | 1506 | 82.9% | 246 | 13.5% | 65 | 3.6% | 0.0 | 0.0% |
| Living room | 1192 | 1139 | 95.6% | 36 | 3.0% | 17.0 | 1.4% | 0.0 | 0.0% |
| Gym–physiotherapy room | 908 | 819 | 90.2% | 89 | 9.8% | 0.0 | 0.0% | 0.0 | 0.0% |
| Occupational therapy room | 1365 | 983 | 72.0% | 241 | 17.7% | 125 | 9.1% | 16 | 1.2% |
| CO2 levels by ventilation regime (5173 measurements) | |||||||||
| MV OFF | 1103 | 951 | 86.2% | 100 | 9.1% | 44 | 4.0% | 8 | 0.7% |
| MV ON | 4070 | 3387 | 83.2% | 512 | 12.6% | 163 | 4.0% | 8 | 0.2% |
| MV OFF: W+D closed | 333 | 287 | 86.2% | 14 | 4.2% | 24 | 7.2% | 8 | 2.4% |
| MV OFF: W+D opened | 193 | 176 | 91.2% | 12 | 6.2% | 5 | 2.6% | 0 | 0.0% |
| MV OFF: Either W or D opened | 577 | 488 | 84.6% | 74 | 12.8% | 15 | 2.6% | 0 | 0.0% |
| MV ON: W+D closed | 526 | 346 | 65.8% | 100 | 19.0% | 72 | 13.7% | 8 | 1.5% |
| MV ON: W+D opened | 830 | 799 | 96.3% | 31 | 3.7% | 0 | 0.0% | 0 | 0.0% |
| MV ON: Either W or D opened | 2714 | 2242 | 82.6% | 381 | 14.0% | 91 | 3.4% | 0 | 0.0% |
| CO2 levels by heating/cooling regime (5282 measurements) | |||||||||
| Heating | 1817 | 1444 | 79.5% | 312 | 17.2% | 53 | 2.9% | 8 | 0.4% |
| Cooling | 1564 | 1489 | 95.2% | 65 | 4.2% | 10 | 0.6% | 0 | 0.0% |
| No heating/cooling | 1901 | 1514 | 79.6% | 235 | 12.4% | 144 | 7.6% | 8 | 0.4% |
| CO2 levels by thermal sensation vote (TSV) (residents and support staff) (3359 measurements) | |||||||||
| TSV < 0 | 447 | 416 | 93% | 24 | 5% | 7 | 2% | 0 | 0% |
| TSV = 0 | 2528 | 2224 | 88% | 250 | 10% | 54 | 2% | 0 | 0% |
| TSV > 0 | 384 | 333 | 87% | 45 | 12% | 6 | 2% | 0 | 0% |
3.2. CO2 Concentration by Room Type
This section provides an overview of the CO2 concentrations in each room type studied in the five nursing homes: occupational therapy room, gym–physiotherapy room, living room, and dining room.
The min, max, and mean (with SD) of CO2 concentrations measured in each room type are presented in Table 3. In this study, mean CO2 levels were below the 800–900-ppm recommended levels for nursing homes [27] in all room types, with the highest mean CO2 concentration of 713 ppm measured in the occupational therapy room. However, the maximum values suggest that all room types, apart from the gym–physiotherapy room (with a CO2 concentration of 898 ppm), reached CO2 levels above the recommended values. Again, the occupational therapy room recorded the highest CO2 concentration value of 1558 ppm.
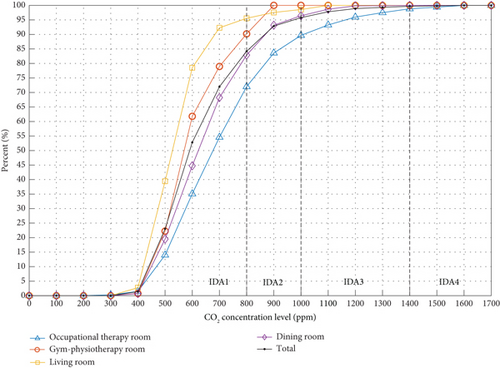
Figure 2 shows the cumulative frequency (%) of CO2 measurements falling in the four IAQ categories for each room type. For example, 72% of the CO2 measurements taken in the occupational therapy rooms were within category IDA1 (CO2 < 800 ppm), while 28% of the measurements exceeded this recommended level. From those, 17.7% fell in category IDA2 (800 < CO2 < 1000 ppm), 9.1% in category IDA3 (1000 < CO2 < 1400 ppm), and 1.2% in category IDA5 (CO2 > 1400 ppm). Overall, the room type with the highest frequency of measurements in category IDA1 and therefore with the highest IAQ during the study was the living rooms (95.6%). Categories IDA3 (moderate IAQ) and IDA4 (low IAQ) had the highest frequencies in the occupational therapy rooms (combined frequency value of 10.3%) and dining rooms (combined frequency value of 3.6%).
3.3. CO2 Concentration by Ventilation Regime
CO2 concentrations were analysed for different room ventilation scenarios, including whether the MV was active or not (ON/OFF) and whether the Ws or Ds were opened or closed at the time of the measurements. Ws and Ds were considered to be opened or closed based on visual inspection by the researchers.
The min, max, and mean (with SD) of CO2 concentrations measured in the different ventilation scenarios are presented in Table 3. When studying the CO2 levels based on only the MV being ON/OFF, no particular differences were observed in the average concentration or the range of measurements (min and max values). While the recommended value of 800–900 ppm was exceeded in both scenarios, the mean levels [638 ppm (MV OFF), 632 ppm (MV ON)] stayed below these. The effect of the Ws and Ds being opened or closed was also investigated. Mean CO2 levels were below the 800–900-ppm recommended levels in all scenarios, with the highest mean CO2 concentration of 739 ppm occurring when the MV was ON and both Ws and Ds were closed. In contrast, the lowest mean CO2 level (555 ppm) was associated with the scenario when the MV was ON and both Ws and Ds were opened. Maximum values suggest that all ventilation scenarios reached CO2 levels above the recommended values. The scenarios where the Ws and Ds were closed (regardless of the MV being ON or OFF) recorded the highest concentration value of 1558 ppm.
Figure 3 shows the cumulative frequency (%) of CO2 measurements falling in the four IAQ categories for each ventilation scenario. Overall, the ventilation scenario with the highest frequency of measurements in category IDA1 (< 800 ppm) and therefore with the highest IAQ during the study involved the MV being ON and the Ws and Ds opened (96.3%). Categories IDA3 (moderate IAQ) and IDA4 (low IAQ) had the highest frequency in the scenarios when the Ws and Ds were closed, regardless of whether the MV was ON or OFF.
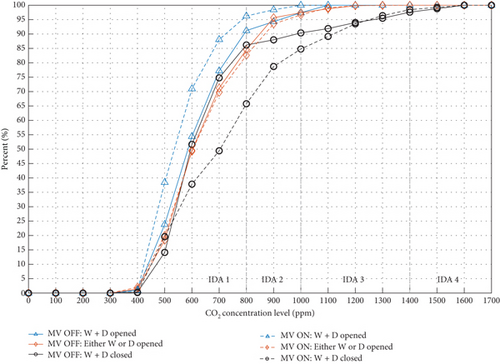
Figure 3 also provides an indication of the effect that the state (opened/closed) of Ws and Ds had on the CO2 concentrations. For example, with the MV ON, the percentage of CO2 measurements under 800 ppm was reduced from 96.3% (with Ws and Ds opened) to 65.8% (with Ws and Ds closed). This effect was less significant when the MV was OFF, where the difference between having the Ws and Ds opened (91.2%) or closed (86.2%) was only 5% for measurements under 800 ppm.
3.4. CO2 Concentration by Heating/Cooling Regime
CO2 concentrations were also analysed for different room heating and cooling regimes, including whether the room was being cooled or heated or no heating/cooling (free-running) was taking place at the time of the measurements.
The min, max, and mean (with SD) of CO2 concentrations measured in the different heating/cooling regimes are presented in Table 3. Mean CO2 levels were below the 800–900-ppm recommended levels in all scenarios, with the highest mean CO2 concentration of 665 ppm occurring when the heating system was on. In contrast, the lowest mean CO2 level (561 ppm) was associated with the scenario when the cooling system was on. Maximum values suggest that all heating/cooling scenarios reached CO2 levels above the recommended values.
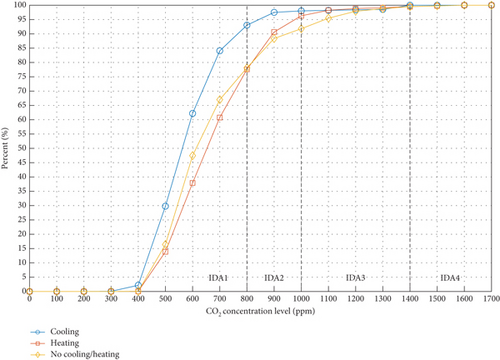
The cumulative frequency (%) of CO2 measurements falling in the four IAQ categories for each heating/cooling scenarios is shown in Figure 4. The highest IAQ (category IDA1, < 800 ppm) was measured in situations when the cooling system was on (93.0% of the measurements). In contrast, categories IDA3 and IDA4 had the highest frequency when there was no heating or cooling in operation (cumulative frequency of 8.2% of measurements over 1000 ppm).
3.5. CO2 Concentration by Occupancy Density
Occupancy density was calculated as the amount of floor area of the room per occupant (m2/p). In this study, the occupancy density ranged from 1.0 to 17.0 m2/p.
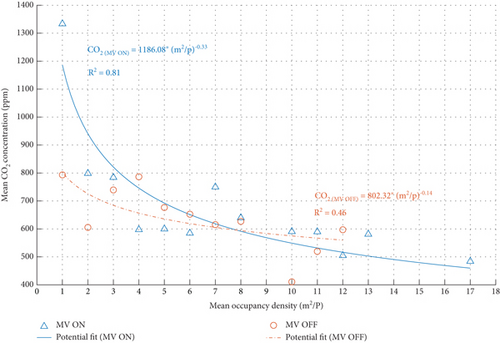
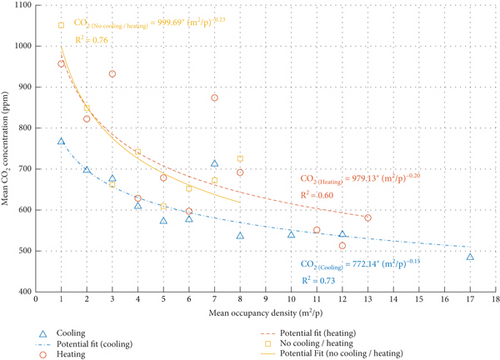
The effect of occupancy density on the CO2 concentration levels was studied for the different room types, ventilation regimes, and heating/cooling regimes. The mean CO2 level for each period of data collection was plotted against the corresponding averaged occupancy density (in groups of 1 m2/p).
3.5.1. CO2 Concentration by Occupancy Density and Room Type
The mean occupancy density varied from room to room: dining room, with a mean of 3.3 m2/p (ranging from 1.0–11.0 m2/p); living room, with a mean of 5.6 m2/p (ranging from 2.0–17.0 m2/p); gym–physiotherapy room, with a mean of 5.8 m2/p (ranging from 2.0–12.0 m2/p); and occupational therapy room, with a mean of 4.8 m2/p (ranging from 2.0–13.0 m2/p).
Figure 5 shows the mean occupancy density plotted against the corresponding mean CO2 concentration levels for each monitoring period and by room type. The results show that the mean CO2 levels decreased as the floor area per person (m2/p) increased for all room types. However, different correlation levels were found for each room type. For instance, the gym–physiotherapy room power line showed an R2 of 0.89, whereas the occupational therapy room provided an R2 of just 0.26. This would suggest that the specific activities carried out in each room type influence differently the CO2 concentrations relative to the mean occupancy density. Thus, activities with high metabolic demands, such as those in a gym–physiotherapy setting, presented a stronger correlation with the occupancy density compared to less physically demanding rooms, such as a living room.
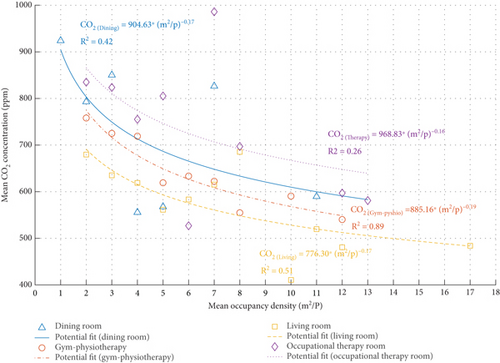
In addition, results also showed that to maintain a mean CO2 level of 800 ppm, occupant density should be at least 3.8 m2/p in the dining room, 3.5 m2/p in the gym–physiotherapy, 1 m2/p in the living room, and 3.8 m2/p in the occupational therapy room.
3.5.2. CO2 Concentration by Occupancy Density and Ventilation Regime
The occupancy density in each measurement was plotted against the corresponding mean CO2 concentration levels in two different ventilation scenarios: with the MV ON or OFF. Figure 6 shows that, in both ventilation scenarios, mean CO2 levels declined as the mean occupancy density increased. Results suggest that mean CO2 concentrations is strongly correlated (R2 = 0.81) with the mean occupancy density when the MV was ON. Conversely, when the MV is inactive, mean CO2 concentrations can not be confidently explained by the mean occupancy density (R2 = 0.46). That would suggest that there are other factors beyond just occupancy density, such as room type, that would influence the CO2 levels. Further research in other nursing homes is required to establish these relationships.
3.5.3. CO2 Concentration by Occupancy Density and Heating/Cooling Regime
Mean CO2 levels decreased as the floor area/person ratio increased in all three scenarios of heating, cooling or no heating/cooling (free-running) (Figure 7). Results show correlations equal or above 0.6 across different heating/cooling scenarios: cooling (R2 = 0.73), heating (R2 = 0.60), and free-running (R2 = 0.76). This would suggest that the heating/cooling regime is an important indicator to consider when evaluating the mean CO2 concentrations based on occupancy density. While the R-squared values indicate moderate to strong correlations, it is essential to acknowledge that other factors, such as room type as aforementioned, may contribute significantly to understanding the nature of this concentration decrease.
3.6. CO2 Concentration Over Time
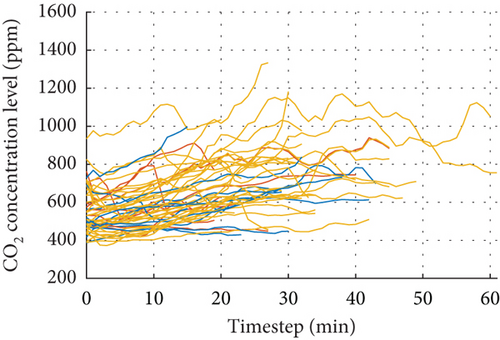
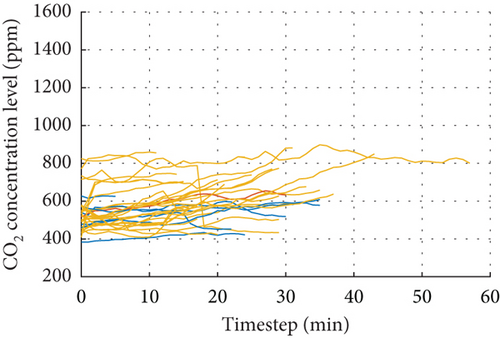
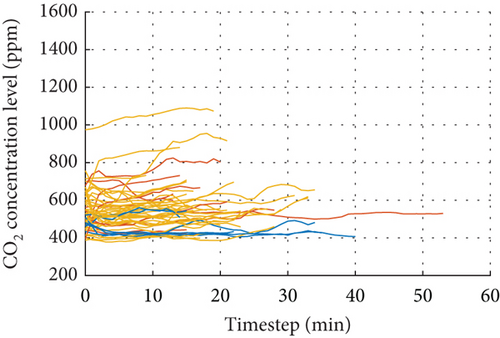
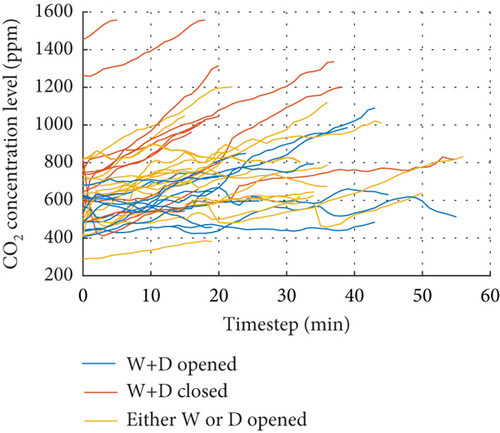
Temporal dynamics of CO2 are plotted in Figure 8 based on room type and ventilation regime. The results indicate that cross ventilation was the most effective method for maintaining low CO2 levels. Temporal evolution of CO2 levels appears to vary by room type, regardless of the ventilation regime. Specifically, dining rooms—and to a lesser extent, occupational therapy rooms—tend to accumulate CO2 over time. Interestingly, a longer total monitored time was associated with higher CO₂ concentrations, indicating a tendency for accumulation, particularly in cases with insufficient ventilation.
3.7. CO2 Concentration and TSV
CO2 concentrations were also studied in relation to the TSVs reported by the nursing home residents and the supporting staff surveyed during the monitoring periods.
The frequency (%) of TSVs reported in each scale (−3 cold, −2 cool, −1 slightly cool, 0 neutral, +1 slightly warm, +2 warm, +3 hot) [26] falling in the four IAQ categories is shown in Figure 9. In this study, the results suggest that the percentage of the nursing home residents (older people) reporting feeling neutral (TSV = 0) and therefore thermally comfortable increases with the CO2 concentration levels. The highest percentage (83.9%) of residents feeling neutral (TSV = 0) was recorded in situations when the CO2 levels were between 1000 and 1400 ppm (IDA3). In contrast, the lowest number (78.4%) of residents feeling neutral (TSV = 0) was recorded when CO2 concentrations were below 800 ppm (IDA1). In those circumstances, 14.9% of residents reported feeling from slightly cool to cold (TSV < 0), compared to 6.8% who reported feeling slightly warm to hot (TSV > 0). Similarly, the support staff reported feeling neutral (TSV = 0) in greater frequency (63.9%) at CO2 levels between 1000 and 1400 ppm (IDA3) and at lower frequency (48.8%) at CO2 concentrations between 800 and 1000 ppm (IDA2).
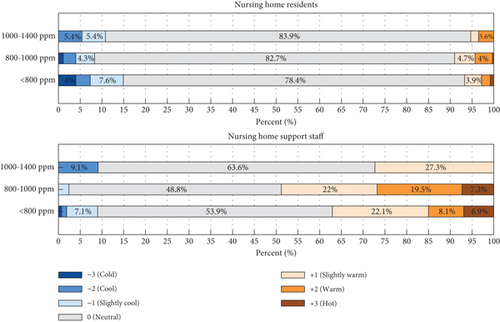
When comparing the TSV of the nursing home residents and the support staff, it can be observed that residents were generally feeling colder than the staff. This was particularly evident at CO2 levels below 800 ppm (IDA1) (14.9% of residents with TSV < 0, compared to 9% of staff, and 6.8% of residents with TSV > 0, compared to 37.1% of support staff).
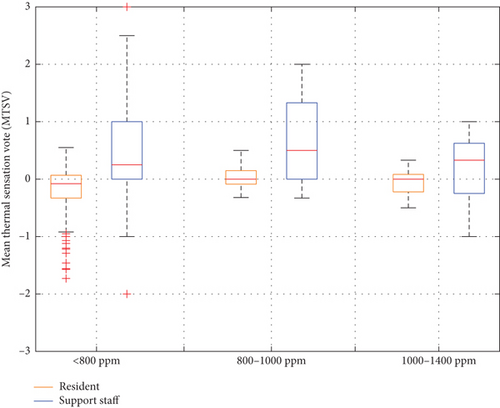
The mean thermal sensation vote (MTSV) of all votes recorded for each monitoring period was calculated and subsequently related to the CO2 measurements of the period. Figure 10 shows box plots of MTSV of nursing home residents and support staff for the four IAQ categories. Average MTSV was lower when CO2 concentrations were below 800 ppm (IDA1) [average MTSV equals −0.17 (residents) and 0.43 (staff)]. Figure 10 also shows that the average MTSV of the residents was lower than that for the staff, with the biggest difference of 0.72 points when CO2 levels were between 800 and 1000 ppm [average MTSV equals 0.02 (residents) and 0.74 (staff)].
4. Discussion
Overall, the results obtained in the current study found that the mean concentrations of CO2 in the 22 communal rooms of the five nursing homes were below the 800–1000-ppm range recommended by the European standard EN 13779 and the 800–900-ppm range specifically for nursing homes in the Spanish technical standard. This suggests that direct risks to the health of the nursing home residents and support staff from exposure to CO2 were being minimised as a review article of the latest evidence concluded that potential health risks from CO2 exposure start at 1000 ppm [31]. The mean CO2 concentrations were also below the recommended ranges for all the room types and HVAC regimes investigated. The highest mean concentration of CO2 was recorded in the occupational therapy rooms which may be explained by the higher CO2 production associated with increased breathing rates for activities, such as singing and loud speech [32], being undertaken by the nursing homes residents and their therapists in groups.
While mean CO2 concentrations were in accordance with standards, measurements exceeding 1000 ppm were recorded in all the nursing homes. This finding is consistent with previous studies [7, 19–21]. Noteworthy, over 10% of the CO2 measurements collected in the occupational therapy rooms were greater than 1000 ppm. Values greater than 1000 ppm were also observed in the dining and living rooms. However, perhaps unexpected due to the higher CO2 generation that would be anticipated from physical exercise, the CO2 concentrations in the gym–physiotherapy rooms never exceeded 1000 ppm. The maximum recorded value was 898 ppm. A possible reason could be the fact that physical exercise in the nursing homes studied primarily involved light movements with the aid of a physiotherapist and in many cases also occurred in a seated position, where breathing rates are typically six times less than standing [33]. These types of exercises will generate lower CO2 than other aerobic exercise, such as brisk walking, running, or cycling that you may expect in a typical gym.
In this study, there was no evident difference in the mean concentrations of CO2 measured in rooms where the MV system was operational than those where it was not. Likewise, a similar 4%–5% of the measurements exceeded 1000 ppm when the MV was on or off. These results were not initially anticipated as fresh air being supplied from a MV system should have diluted the CO2 concentration in the rooms. The reason for this finding may be because the flow rate and air volume were inadequate given the current occupancy density. The design of a MV system typically relies on assumptions about the occupancy density of the space, and this may be underestimated or has changed since the initial design due to changes in space use. Furthermore, the effectiveness of mechanical systems is also impacted by their design, for example, location of supply and exhaust grilles, as well as maintenance. It is also worth considering the potential limitations of the MV systems in terms of their adaptation to the nursing homes’ actual occupancy patterns. Over time, these systems may have become less effective due to aging infrastructure or a mismatch between the original design parameters and current usage. Periodic assessments and possible upgrades to HVAC systems could contribute to having optimal air quality standards.
The benefit of natural ventilation for reducing CO2 indoors was clear. The study showed that opening Ws and Ds in the nursing homes maintained mean CO2 levels below recommended ranges, and mean concentration was at its lowest when natural ventilation from Ws and cross ventilation from Ds was used at the same time as the MV. This was also the only ventilation regime where the CO2 concentration never exceeded 1000 ppm. Equally, the highest CO2 concentrations were observed when the Ws and Ds were closed, limiting fresh air supply and extraction. Access and ability to operate Ws and Ds are therefore clearly important to maintain high air quality indoors; however, in the context of a nursing home occupied by older people with potentially reduced mobility and dexterity as well as neurodegenerative conditions, the design and method of operation of natural ventilation require careful consideration. Furthermore, in nursing homes, it is also likely that the operation of Ws and Ds in communal areas is often undertaken by the support staff and as a result, air quality is not necessarily within the control of the older people themselves and therefore may not address their needs. This finding is supported by Gupta et al. [21] and Chen et al. [11] who found elevated CO2 levels in the private bedrooms of care homes and houses occupied by older people as the older occupiers kept Ws closed. Automated W actuators or in room display panels indicating when Ws should be opened or closed to optimise air quality, comfort, and energy performance could be considered to address these challenges [34, 35]. However, the outdoor environment surrounding care facilities requires careful assessment. Although the monitoring study found no evidence of elevated outdoor CO₂ levels, with all nursing homes being exposed to outdoor CO₂ levels never exceeding the 400–420-ppm range—supporting natural ventilation as a viable strategy—the location of a care home remains a crucial consideration. Facilities situated near motorways, industrial areas, or regions with poor air quality risk allowing higher levels of CO₂ and particulate matter to enter indoor spaces when Ws are opened, potentially compromising air quality. For natural ventilation to function effectively, architects and planners must account for the outdoor environment during the design and site selection process of care homes. This ensures that the benefits of natural ventilation are not hindered by potential outdoor air pollution.
The mean CO2 levels in the nursing homes were below 1000 ppm regardless of whether the heating or cooling systems were active or inactive. CO2 concentrations exceeded 1000 ppm during some periods of the measurements regardless of whether the buildings were in heating, cooling, or free-running (neither heated nor cooled) modes. The highest mean CO2 levels were observed when the heating was on, this was likely due to a reduction in fresh air caused by less W opening in order to reduce energy use for space heating in winter. This finding is akin to that found by Serrano-Jiménez et al. [22] for social housing occupied by older people in Spain.
Interestingly, the study did not observe the same for the summer season when cooling was in operation. In fact, the lowest mean concentration of CO2 was evident when the air-conditioning was active. This result suggests that during summer unlike winter, W opening and air-conditioning occurred simultaneously, despite the increased energy use for space cooling that may have resulted. Previous research [36, 37] has found that Ws are opened more in summer, and W opening behaviour is linked with people’s habits and mental models [38, 39]. Opening Ws is a passive approach to cooling that people have long used in summer and which predates the invention of air-conditioning. It is proposed that this prevailing habit or understanding of how to keep cool in summer may still be the dominant mental model for the older people, for whom air-conditioning is a technology that they did not necessarily grow up with. It is also possible that the presence of air-conditioning in summer indirectly encourages W opening due to the perceived benefits of cross ventilation, as residents and staff may intuitively seek natural airflow. This dynamic could also explain why CO2 levels were lower during the summer.
The current study also investigated the impact of occupancy density on CO2 levels for different room types and HVAC regimes. As expected, mean CO2 levels decreased as the floor area per person (m2/p) increased. The results for occupancy density indicated that greater floor areas per person are required in occupational therapy (3.8 m2/p) and gym–physiotherapy (3.5 m2/p) rooms than in dining (3.8 m2/p) and living (1 m2/p) rooms in order to achieve recommended indoor CO2 concentrations. As previously discussed, this is linked to the higher-CO2-generating activities taking place in the occupational therapy and gym–physiotherapy rooms. In fact, further findings revealed that the decline in CO2 concentrations was more closely tied to the specific room and the activities conducted within them. Particularly, high physically demanding activities, such as those taking place in gym–physiotherapy settings, presented a stronger correlation with CO2 concentration (R2 = 0.89) when evaluating the occupancy density, compared to less physically demanding activities, like those in dining rooms (R2 = 0.42). These minimum floor area values identified in this study could be of interest to designers of new-build nursing homes in order to maintain acceptable CO2 levels. Equally, for existing nursing homes, these values could provide an indication of the minimum floor area that should be provided for each older person in the various room types. It is interesting to note that the minimum floor areas indicated in the current study for the occupational therapy and the dining room (3.8 m2/p) are higher than those recommended in CTE guidelines (1.5 m2/p) [40]. On the other hand, the recommended area per person in the living room is half (1 m2/p) the value recommended in CTE (2 m2/p).
Similarly, declining mean CO2 levels were evident as floor area per person increased for all HVAC regimes studied. Further research in other nursing homes is required to define advised minimum floor areas based on the HVAC regimes.
On the other hand, the temporal evolution of CO2 levels showed a tendency to accumulate over time. The room type and ventilation regime had a significant impact on this accumulation. Cross ventilation was the most effective strategy for maintaining low CO2 levels. However, certain rooms, such as the dining room, tended to accumulate CO2 regardless of the ventilation regime. This was especially noticeable in spaces with longer durations and higher occupancy, suggesting that activities with fewer people and shorter durations could have a positive impact on IAQ values. Additionally, adjusting activity schedules to accommodate the new occupancy density, introducing outdoor activities (especially in regions with suitable weather), and upgrading ventilation systems with proper maintenance programs, as discussed earlier, would be valuable strategies to address these concerns.
While this study did not seek to investigate the health implications of CO2 concentrations, it is important to acknowledge that CO2 is widely used as a proxy for bioaerosol exposure, which has implications for infectious disease transmission in enclosed environments. In particular, CO2 measurements can be employed to estimate ventilation rates, which can, in turn, be applied in predictive models such as the Wells–Riley equation to assess the potential for airborne disease spread. Given the vulnerability of older populations in nursing homes, future research could build upon the findings of this study to explore ventilation adequacy using CO2 as a surrogate for airborne pathogen exposure, thereby providing further insights into infection control strategies in such settings. Moreover, relevant research has identified that high CO2 concentrations can lead to inflammation, reductions in higher-level cognitive abilities, kidney calcification, oxidative stress, bone demineralization, and endothelial dysfunction [31], even in environments where CO2 levels exceed 1000 ppm. Maintaining CO2 levels below this threshold could therefore benefit the health of the elderly. Further research is needed to better understand the additional risks associated with high CO2 concentrations, particularly for this vulnerable population, as risks like cognitive decline are of critical concern.
Furthermore, the relationship between CO2 concentrations indoors and the thermal comfort of the nursing home residents and support staff was investigated. The current results show that both the older residents and staff felt more thermally comfortable at higher CO2 levels. Furthermore, it was evident that the older people also felt generally colder than staff, and this difference was more pronounced at lower CO2 levels. These findings are consistent with similar research, such as by Baquero et al. [41], which stated that thermal comfort in nursing homes for elderly populations was directly related to occupancy density, room relative humidity, and room type, including the metabolic rate of occupants, ventilation type, and CO2 levels. Additionally, potential underlying factors, such as the psychological perception of air freshness, could also play a role and warrant further investigation in future research. These findings are important for a number of reasons: First, it would appear that achieving lower CO2 levels in nursing homes affects thermal sensation. This means that a balance needs to be struck between IAQ and thermal comfort, especially when dealing with a vulnerable older population. Secondly, the observed differences in thermal sensation between the older people and their carers potentially pose a significant challenge, because as previously discussed, often staff rather than residents open and close Ws and Ds to ventilate, which may be triggered by the staff’s perception of the indoor environment rather than the older residents. A positive action taken by staff to ventilate a space for higher air quality therefore may disproportionately affect the thermal comfort of the older residents. Furthermore, careful consideration should be given to how these dynamics manifest within each specific space, as targeted interventions based on room usage and occupancy density can contribute to a more nuanced approach to ventilation.
Finally, although energy implications were not directly addressed in this study, they merit consideration. Nursing homes face the dual challenge of reducing energy consumption to combat climate change and lower operational costs while ensuring that residents’ health and thermal comfort are not compromised. Relevant research has explored the energy implications of adopting adaptive thermal comfort models in nursing homes, revealing that these spaces are typically overcooled by 2°C–3°C. Implementing an adaptive setpoint temperature could offer energy savings without sacrificing perceived thermal comfort [42]. However, significant gaps remain regarding ventilation and overall IAQ, which were not accounted for in these studies. Future research should focus on finding a balance between maintaining high IAQ and addressing the associated energy implications.
5. Conclusions
This paper presents the results from a CO2 measurement study undertaken in 22 communal rooms in five nursing homes in Spain. The paper investigated whether the measured CO2 levels conform to recommended ranges from national and international standards. In addition, the effects of HVAC regimes, room characteristics, and occupant activities on CO2 were examined.
- •
The mean concentrations of CO2 were below the 800-1000 ppm range recommended by the European standard EN 13779 and the 800-900-ppm range from the Spanish technical standard for all five nursing homes. Mean CO2 concentrations were also below these ranges for all the room types (dining, living, gym–physiotherapy, and occupational therapy) and HVAC regimes investigated.
- •
CO2 measurements exceeding 1000 ppm were recorded in all the nursing homes, including in the occupational therapy, dining, and living rooms. A total of 10.3% of the CO2 measurements in the occupational therapy rooms were greater than 1000 ppm, which was likely linked to the increased generation of CO2 due to the activities taking place, such as singing in groups. CO2 concentrations in the gym–physiotherapy rooms never exceeded 1000 ppm.
- •
Opening Ws for natural ventilation and Ds for cross ventilation in the nursing homes maintained mean CO2 levels below recommended national and international ranges. Furthermore, CO2 never exceeded 1000 ppm when natural and cross ventilation was used in combination with MV.
- •
The mean CO2 levels were below 1000 ppm when the nursing homes were in heating, cooling, or free-running (neither heated nor cooled) modes. The highest mean CO2 levels were recorded when the heating was active, which may be caused by a reduction in fresh air due to less ventilation in order to save energy. Likewise, lowest mean CO2 levels were observed during cooling regimes. This can be attributed primarily to the practice of keeping Ws and Ds open in these rooms during the summer, which facilitates the renewal of fresh air.
- •
Mean CO2 levels decreased as the floor area per person (m2/p) increased. In addition, lower occupancy density was found to be needed in occupational therapy, gym–physiotherapy, and dining rooms than in the living room in order to achieve recommended ranges for indoor CO2 concentrations. A strong correlation was observed between mean CO2 concentrations and mean occupancy density, particularly in spaces where physically demanding activities were carried out, such as the gym–physiotherapy (R2 = 0.89).
- •
The older residents and staff both reported being more thermally comfortable at higher CO2 concentrations, irrespective of room temperature conditions. Nonetheless, the older residents consistently reported feeling colder than staff for a given setting, with this thermal sensation gap widening at spaces with lower CO2 levels. Therefore, achieving a balance between air quality and thermal comfort is essential.
While this study focused specifically on CO₂ as an indicator of ventilation effectiveness, further research should explore the full spectrum of IAQ factors. In particular, studies investigating the presence of particulate matter, VOCs, and other pollutants in nursing homes are needed. Such research will contribute to a more comprehensive understanding of how various indoor air pollutants influence the health and comfort of vulnerable populations, including older residents and nursing home staff.
Conflicts of Interest
The authors declare no conflicts of interest.
Author Contributions
Alba Fuertes: writing – original draft, investigation, conceptualization, data curation, formal analysis. Rory V. Jones: writing – original draft, conceptualization, investigation. María Teresa Baquero: writing – original draft, investigation, data curation, methodology. Roger Vergés: writing – original draft, investigation, data curation, visualization. Nuria Forcada: funding acquisition, project administration, methodology, investigation, writing – review and editing.
Funding
This research was supported by the Spanish Ministry of Economy, Industry and Competitiveness under the R&D project Thecoelen, reference no. PID2019-106777RB-C21. Support for this research was also provided by the Catalan agency AGAUR under its research group support program (2021 SGR 00341).
Acknowledgments
The authors thank Sanitas Mayores and especially Marc Vallet and Albert Ayala for providing their nursing homes and helping to collect the data. The authors would like to extend our appreciation to all the older people and support and maintenance staff who participated in this project.
Open Research
Data Availability Statement
Data will be made available upon request.


