Quantifying Physical and Chemical Processes of Indoor CO2 and Ozone in a University Classroom Using Low-Cost Sensors and Model Simulation
Abstract
Indoor air quality is a crucial factor affecting human health, with high levels of CO2 impairing cognition and ozone reacting with human skin to produce volatile organic compounds (VOCs), such as geranyl acetone (Ga), 6-methyl-5-hepten-2-one (6-MHO), and 4-oxopentanal (4-OPA), which can cause irritation to the respiratory tract and skin. In this study, the indoor air quality of a university classroom was monitored using home-built air quality boxes (AQBs) comprising low-cost sensors for various gas species, including CO2, ozone, and NOx. The interaction processes between indoor and outdoor air and human interference were investigated using box model simulation of CO2 and ozone profiles. The results indicate both indoor CO2 and ozone were significantly affected by the ventilation and number of occupants. The simulation of CO2 profiles retrieves an air exchange rate constant of ~1.05 h−1 for one door opening, in addition to the room ventilator of 1.20 h−1. With the derived parameters, the study estimated that ozone, mainly transported from the outdoors and consumed by room and human surfaces, has deposition velocities of 0.019 ± 0.005 and 0.45 ± 0.15 cm s−1 for room and human surfaces, respectively, consistent with the literature. The simulation also suggests that VOCs such as Ga, 6-MHO, and 4-OPA from ozone consumption on human surfaces might accumulate indoors to several parts per billion by volume in a crowded room with poor ventilation. The integration of observation using low-cost sensors with the model simulation quantified the physical and chemical processes controlling indoor ozone concentration and organic ozonolysis. Furthermore, the study suggests that the retrieved parameters from the model could guide proper ventilation strategies to maintain good indoor air quality with energy efficiency based on the number of occupants.
1. Introduction
Indoor air quality is vital to human health, as people spend a significant amount of time indoors. Studies in the United States, Canada, and Hong Kong show that people spend an average of 86%–89% of their time indoors [1–3], making maintaining good indoor air quality an important issue. Poor indoor air quality might cause dermatological disorders and respiratory diseases such as allergies and asthma [4, 5] and can also negatively affect productivity [6]. Indoor air quality is affected by various factors, such as outdoor pollutants transported indoors, indoor human activities (cooking, cleaning, smoking, etc.), indoor material emissions, and chemical reactions in the gas phase or on the surface [7–9]. Moreover, the thermal conditions, including temperature (T) and relative humidity (RH), are important in evaluating indoor air quality, given their impact on human comfort and productivity [10–12]. The indoor thermal environment could also influence the emission behaviors of volatile organic compounds (VOCs) from indoor materials and surfaces, thereby contributing to the dynamics of indoor chemistry [13–15]. CO2 and ozone are significant indoor air pollutants that can impact human health. Typical outdoor CO2 concentration is 380–500 ppmv, while indoor CO2 ranges from outdoor levels to thousands of parts per million [16] due to indoor human respiration or combustion [17]. A high concentration of CO2 can damage human cognition [18–20], especially affecting human decision-making and inhibiting students’ learning [21, 22]. Ozone is a significant oxidant inside buildings, ranging from 1 to 21 ppbv [23]. The ozone indoor-to-outdoor (I/O) ratios often range from 0.2 to 0.7 without ozone sources, which is caused by the high ability of ozone to react with indoor materials [24]. For buildings in urban areas, NOx emitted from vehicles might be transported indoors to affect human health, while it could also change the indoor chemical processes [25].
Humans can inhale indoor ozone, causing irritation to the respiratory system, while reactions of ozone with various room surfaces and the skin lipids of occupants are also highly concerning [24, 26, 27]. Ozone can oxidize the unsaturated bonds coated on the room surface, producing several secondary pollutants such as aldehyde, ketone, and secondary organic aerosols [28]. Exposure to these products can cause asthma and pulmonary infections [29]. Additionally, the outermost layer of human skin consists of wax esters, glycerols, and fatty acids, which might be a significant sink for indoor ozone. The most ozone-reactive constituent of skin lipids is squalene [30], which undergoes reactions with ozone to produce ozonolysis products such as acetone, geranyl acetone (Ga), 6-methyl-5-hepten-2-one (6-MHO), 4,9,13,17-tetramethyl-octadeca-4,8,12,16-tetraeneal (TOT), 4,8,13,17,21-tetramethyl-octadeca-4,8,12,16,20-pentaene-al (TOP), and 5,9,13-trimethyl-tetradeca-4,8,12-triene-al (TTT) [31, 32]. Primary products containing unsaturated double bonds can react with ozone again, producing secondary products, such as 4-oxopentanal (4-OPA) and 4-methyl-8-oxo-4-nonenal (4-MON). Exposure to some of these organic products can irritate the skin and respiratory tract, potentially affecting human health [33, 34]. Therefore, it is essential to implement measures to reduce indoor ozone concentrations and mitigate potential health risks.
Studies have investigated the interactions between ozone and room surfaces or human skin lipids in various settings, including aircraft cabins, residences, and classrooms [35–38]. These investigations consistently demonstrate that low ventilation in enclosed spaces could result in the observed decreased ozone concentration and the formation of related oxygenated VOCs. With the observed data in a university classroom, Xiong et al. applied a model analysis to derive the ozone deposition velocities to the room and human surfaces as 0.03 and 0.25 cm s−1 [38], respectively, under indoor ozone concentrations of 0–23 ppbv with 10–70 occupants. The deposition velocities of ozone on room materials were analyzed in a laboratory chamber by Hoang et al. [39] and Lamble et al. [40]. Hoang et al. estimated a deposition velocity of 0.036 cm s−1 to the natural cork-covered wall at an inlet ozone concentration of 127 ppbv, while Lamble et al. observed a deposition velocity of 0.019 cm s−1 to a latex-painted wall at ozone concentrations of 150–200 ppbv. The ozone deposition on the wall ranges from 0.019 to 0.036 cm s−1, depending on the material properties, as summarized in Table 1. With the observed results (ozone profile) in an aircraft cabin with 16 occupants and an ozone concentration of 60–80 ppbv, Tamas et al. [41] derived a deposition velocity of 0.20–0.23 cm s−1 on human surfaces, consistent with the rate reported by Xiong et al. [38]. Moreover, Wisthaler and Weschler estimated the deposition velocity to the human surface as 0.4–0.5 cm s−1 with two occupants and 0–30 ppbv ozone in a chamber [27]. Overall, these studies show that the deposition velocities on human surfaces range from 0.2 to 0.5 cm s−1, an order of magnitude higher than that on the wall. In general, the concentration of CO2 in a room is determined by the balance of ventilation and occupancy, assuming no indoor combustion. However, because ozone is highly reactive, its concentration is not solely affected by ventilation and occupancy but also by the indoor environment. Therefore, it is essential to monitor multiple gases simultaneously to retrieve the physical processes via nonreactive species such as CO2, which can further aid in deciphering the chemical processes affecting ozone.
| Studies | Material | Deposition velocity (cm s−1) |
|---|---|---|
| This study | Classroom surface | 0.019 |
| Xiong et al. [38] | Classroom surface | 0.03 |
| Hoang et al. [39] | Natural cork wall-covering | 0.036 |
| Lamble et al. [40] | Latex paint | 0.019 |
| This study | Human occupants | 0.45 |
| Xiong et al. [38] | Human occupants | 0.25 |
| Tamas et al. [41] | Human occupants | 0.20, 0.23 |
| Wisthaler and Weschler [27] | Human occupants | 0.4 to 0.5 |
As to the measurements, the applied instruments in previous studies usually have high time resolution and low detection limitations to catch the variation [35, 37, 38], but they are often accompanied by disadvantages such as bulky and noisy pumping. The generation of possible gas-phase by-products exhausted from the instruments might alter the indoor air composition in a closed system, leading to a deviation in deriving indoor air dynamics, especially in a confined space. These drawbacks make them unsuitable for indoor experiments, especially in educational environments such as teaching classrooms. Therefore, it is imperative to employ more suitable measurements with comparable observation accuracy, such as low-cost sensors with high sensitivity. While these low-cost sensors have been used for outdoor monitoring and the data were applied in model simulations or predictions [42–44], their application in indoor environments faces challenges. Fluctuations in RH and T could significantly impact the detection of low pollutant concentrations, particularly in indoor settings [45]. In this study, the indoor air quality in a university classroom was monitored using home-built, low-cost air quality boxes (AQBs) equipped with sensors for various gas species. The AQB has several advantages, including portability, minimal noise, and the absence of gas-phase by-product generation. Through a box model simulation, the interaction processes between outdoor and indoor air, as well as human interference, were examined by analyzing the profiles of CO2 and ozone dynamics. Additionally, an estimation of potential VOC formation was conducted. The subsequent discussion explores appropriate ventilation strategies for achieving optimal indoor air quality with energy efficiency.
2. Experiment and Methods
2.1. Experimental Setup
The T, RH, pressure (P), and concentrations of CO2, Ox (=O3+NO2), NO2, and NO were monitored using two AQB systems in a classroom (25°0 ′53 ″ N, 121°32 ′20 ″ E) at the National Taiwan University from September to October 2020 and June 2022, corresponding to the academic semester and summer vacation, respectively. The classroom has a volume of 289 m3 and is open to the outdoors through regularly open windows and gate doors during daytime on working days (typically from 8:00 to 17:00 every Monday to Friday). The walls are painted, and the floor and ceiling are covered with wood. The surface area of the walls is approximately 113 and ~214 m2 for the floor and ceiling, while the surface area of the chairs (covered with fiber) and desks (made with wood) is about 154 m2. The room has an energy recovery ventilator (including PM filtration) with five inputs and five outputs distributed on the top of the room to exchange indoor and outdoor air. Additionally, there are two doors on one side (Figure 1), which exchange air between the room and the hallway. There are windows in the classroom, and all windows were kept closed during the experiment periods. The exchange flow of the ventilator is 0.097 m3 s−1 (corresponding to a rate constant of 1.20 h−1) and is programmed to operate from 6:00 to 23:00 every Monday to Friday. The doors are closed at nighttime, and their open/closed time and air exchange efficiency can be determined based on the observed CO2 profile simulated using a box model. The number of occupants in the classroom varies between 10 and 50 people, depending on the courses. This estimation is based on official reports of students enrolled in classes and cross-checked with attendance records maintained by teaching assistants. The surface area of each occupant is assumed to be 1.7 m2 per person [46]. The room air conditioner is controlled manually and has internal circulation only. A visual representation of the classroom and an overview of the environmental setup are provided in Figure S1.
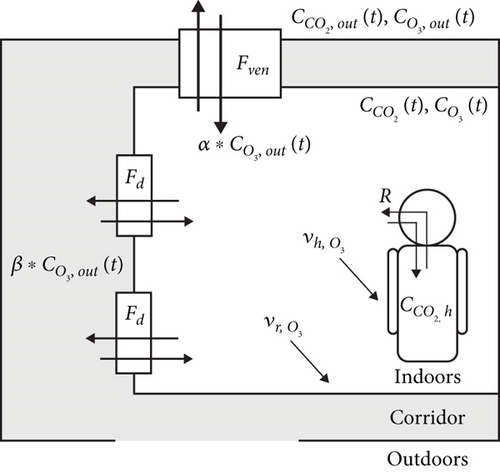
Three home-built AQB systems were applied to monitor the selected gas concentrations, including CO2, NO, NO2, and Ox. One AQB was placed on a desk at the front of the classroom and another at the back to assess indoor air quality. As shown in Figure S2, gas concentration measurements varied minimally between these two locations. Given the generally uniform seating arrangement of occupants and the consistent distribution of gases, indoor gas concentrations were assumed to be well mixed. Due to this uniformity and the stability of the instrument performance, data from the AQB at the front of the classroom was selected for subsequent analysis. The third AQB was placed in the corridor near the front door to measure the building’s concentration. The AQB comprises a Seeeduino (SHT31) for T and RH, a nondispersion infrared (NDIR) sensor (T6713-5K, Amphenol Advanced Sensors) for CO2, and electrochemical sensors (Alphasense Inc., United Kingdom) for other gas species. It has dimensions of 25 × 16 × 8 cm and weighs 730 g. The sampling flow rate is controlled at ~5.6 L min−1 by a fan, corresponding to a residence time of 34 s in the box. The CO2 sensor has an accuracy of ±30 ppmv or ±3% of the reading value, while other gases are detected at parts per billion by volume levels with a time resolution of seconds. Ozone concentration is calculated from the difference between Ox and NO2 concentrations. Outlier data points exceeding two standard deviations from the mean are excluded. Minute-averaged data are applied for further analysis.
AQB has the advantage of being lower cost, portable, and operating quietly, making it comparable to the measurements obtained at Environmental Protection Administration (EPA) stations. Typical measurements operated by the EPA have issues with the by-product generation in the exhaust air and the noise produced by pumps. Taking the example of EPA’s NOx measurement (ML9841, Ecotech), it relies on a NO2-to-NO converter for NOx detection and needs a connected pump with a charcoal scrubber to remove excess ozone and discharge the exhaust gas outdoors. In contrast, AQB, equipped with electric gas sensors, does not generate by-products or pumping noise, making it more suitable for indoor environment monitoring. For the calibration issue, the calibration coefficients of the AQB were established by colocation with the Songshan EPA station, serving as the reference. The instruments at EPA stations exhibit higher precision and undergo calibration with standard gases every midnight. Moreover, the Songshan EPA station, the nearest major station with CO2 measurement, provides environmental conditions closely aligned with the experimental conditions. A more detailed description of AQB data calibration is provided in the supporting information (Section S1 and Tables S1 and S2). Overall, the correlation coefficients for monitored environmental data between EPA instruments and AQB range from 0.47 to 0.81 for the studied chemical species. Low-cost electrochemical sensors might have a cross-sensitivity issue, while there were no significant interferences of the target pollutant measurement in this study [47–49].
As the electrochemical sensors are sensitive to T variations, sudden changes in T can cause an unrealistic signal variation for NOx. To address this issue, a multiple linear regression that takes T into account was employed to calibrate NOx concentration measurements. However, the issue persisted due to rapid T changes leading to baseline shifts. During class sessions, the initial operation of the air conditioner can cause a T drop of ~2°C and a 10% decrease in RH, which might lead to an additional baseline shift. Because of varying ventilation conditions within a whole day, resulting in distinct steady-state ozone levels, two different types of baseline correction were employed. During the periods with ventilation turned off and no occupants, the ozone concentration should be consumed entirely by the deposition onto room surfaces, resulting in approximately zero ozone concentration. Therefore, the baseline is corrected by offsetting the ozone concentration value by a range of −1 to +8 ppbv before the ventilator is turned on. During the periods with ventilation turned on, ozone had a nonzero concentration at a steady state due to the ventilation effect transporting ozone from outdoors. Hence, the concentration of ozone in each period requires baseline correction by 1.5–4.0 ppbv based on the steady-state concentration calculated from the model. Concerning the low concentration of ozone and NOx in the indoor environment, the observed patterns of ozone and NOx are verified using a personal ozone monitor (POM, 2B Technologies) and a 405 nm NO2/NO/NOx monitor (NOx-405 nm, 2B Technologies) collocated with the AQB. The colocation comparisons took place on August 3 and 4, 2022, and March 8 and 9, 2023, under the same ventilation conditions as the experiments conducted from September to October 2020 and June 2022. Moreover, the presence of indoor VOCs was confirmed through VOC sampling conducted on June 27 and July 1, 2022. The detailed VOC sampling is described in the supporting information.
As there are limited CO2 monitoring sites in Taiwan, the outdoor CO2 concentration was based on the results of the Songshan EPA station (25°3 ′0 ″ N, 121°34 ′43 ″ E), located 5.5 km away from the classroom, while other gas concentrations were based on the Guting EPA station (25°1 ′14 ″ N, 121°31 ′46 ″ E), 1.2 km away from the classroom. The low reactivity of CO2 leads to no significant difference in inlet concentration from the ventilation or doors. Additionally, the accumulation of CO2 in the corridor is considered negligible due to the high air exchange rate with the outdoors. Further details are provided in the supporting information. However, ozone might be consumed due to reactions occurring inside the air parcel or by reacting with the surfaces of ventilator ducts and the interior wall of the building as outdoor air flows through ducts and enters the building. The resulting changes in concentration can be expressed as residual fractions α and β. α was derived using ozone modeling in a condition with the ventilator on but without occupants, while β was evaluated based on the linear relation between observed ozone concentration inside the building and those measured at the Guting EPA station.
2.2. Model Simulation
3. Results and Discussion
3.1. Diurnal Patterns of Indoor Air Parameters
Figures 2 and 3 show the temporal profiles of monitored parameters for indoor air without and with occupants, respectively, as measured by the AQB on the desk in front of the classroom. Similar diurnal trends were observed across course sessions for a given occupancy condition (with or without). For simplification, 4 days of observation data are used here to provide a comprehensive overview of the trends throughout the entire period. When the classroom was unoccupied (Figure 2), the T remained within a 1°C difference on the same day. The overall CO2 concentration remained at ~420 ppmv during this period. When the air ventilator was on (06:00–23:00 on weekdays), indoor CO2 had a similar variation trend as the outdoor CO2. In contrast, when the air ventilation was off (23:00–06:00 the next day and weekends), indoor CO2 remained relatively constant, even though outdoor CO2 changed. This observation indicated no apparent source and sink of CO2 inside the classroom except for the ventilation effect. Moreover, during no ventilation periods, the concentrations of ozone and NO2 decreased, but NO increased. The observed decrease of ozone and NO2 might be due to reactions with the room surface, while the increase of NO might result from the chemical reactions of NO2 with the room surface under negligible ventilation conditions. This varying pattern shows that ~24% of NO2 was converted to NO as the ventilation was turned off for 7 h. Spicer et al. reported that NO2 could be removed in the indoor environment, and ~33% of NO2 was converted to NO on the surface of wallboard paper after 66 h at inlet NO2 concentrations of 1.2–1.5 ppmv [53]. A similar increasing trend was also observed during the weekend (Saturday in Figure 2), as there were no occupants, and the air ventilator remained off.
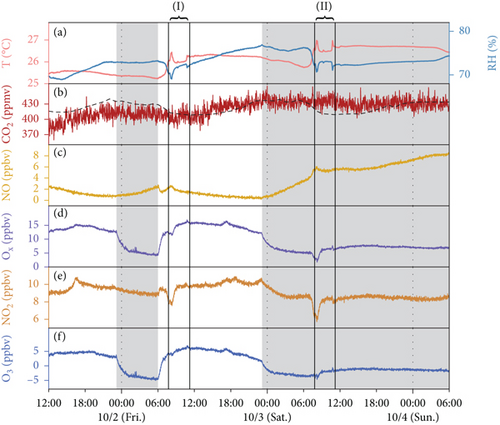

As the T variation was not significant in the isolated classroom (i.e., with ventilation off and no occupants present), the retrieved composition trend would reflect the environmental conditions. However, the absolute values might not be accurate due to the lack of daily baseline calibration. The temporal patterns of ozone, NO, and NO2 monitored by colocating AQB with calibrated POM or NOx-405 nm verify similar trends and amplitudes with ozone decreasing, NO2 decreasing, and NO increasing, as shown in Figure S3. Both AQB and POM exhibit consistent ozone profiles, showing a reduction of ~5 ppbv after the room was isolated for 1 h. During periods with no production or transport but only consumption processes affecting ozone, the baseline of ozone can be determined as the concentration reaches a minimum and remains unchanged. The profiles with baseline correction for both AQB and POM are consistent, with an RMSE of 1.62 ppbv. Based on this baseline correction approach, further analysis of ozone-related simulation is conducted. Regarding the NO and NO2 profiles, the consistently aligned trends between NOx-405 nm and AQB support the observed NO and NO2 trends using AQB, with RMSE at 1.92 and 3.65 ppbv, respectively. Additionally, NOx-405 nm indicated that ~32% NO2 was converted to NO after 7 h of no ventilation. The increased NO concentration during dark periods (when ozone was depleted) might be attributed to the biological denitrification processes [54]. Alternatively, it might arise from the heterogeneous hydrolysis of NO2, leading to the generation of HONO (or NO) on surfaces capable of adsorbing water and forming a surface film [55–57]. The observed NO and NO2 variations provide insights into the possible interconversion of NOx indoors.
When the ventilator was turned on with no occupants present, the indoor ozone and NO2 concentrations increased due to the inflow of outdoor air having higher concentrations. Conversely, the indoor concentration of NO decreased because the outdoor concentration of NO was relatively lower. The variation pattern of ozone was mainly influenced by the outdoor ozone photolysis reaction, with the highest levels observed at midday and the lowest levels at dawn and dusk. Meanwhile, the profiles of NO2 and NO were primarily dominated by pollution episodes emitted from vehicles near the campus.
During weekdays with class sessions, as shown in Figure 3, significant variations in CO2 concentration were observed when there were occupants. The increase in CO2 concentration was attributed to occupants’ exhalation, while the decrease was due to reduced occupancy and higher air exchange rates. The concentration of ozone and NO2 decreased more rapidly than periods with no ventilation, likely due to the additional reactions of ozone and NO2 with human surfaces and the inhalation loss. Furthermore, there was a more accelerated increase in NO concentration compared to periods with ventilation off, suggesting that the observed NO might be from human exhalation [53], which is detectable in AQB. The trends of ozone, NO, and NO2 were significantly influenced by surface reactions during transport and interactions with objects such as walls, furniture, and people, even though the ventilation system introduced outdoor air with higher ozone and NO2 concentrations but lower NO levels than indoors.
3.2. CO2 Simulation
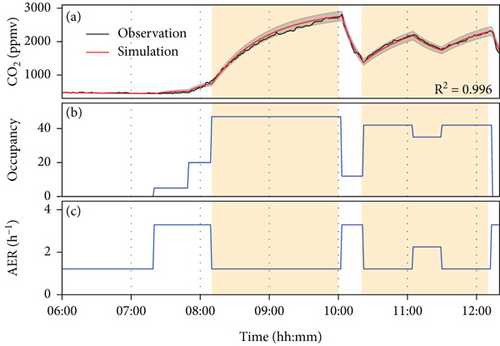
The indoor CO2 concentration can be simulated using Equation (1), along with records of class session duration and the estimated student attendance. This simulation can then be compared with observed data to extract additional ventilation details, including door openings and fluctuations in student numbers. Figure 4 shows simulation results for September 22, including two courses scheduled from 8:10 to 10:00 and from 10:20 to 12:10. During these sessions, a minimum air exchange rate of 1.20 h−1 was maintained (the ventilator was on), with a higher air exchange rate observed when doors were opened. In the first course, with approximately 47 occupants, an air exchange rate of 1.20 h−1 was maintained, leading to CO2 levels nearing 3000 ppmv by the end of the class. Conversely, in the second course, with ~42 occupants and a short recess during 11:05–11:30, a lower CO2 level of ~2200 ppmv was observed at the end of the class due to fewer people and increased ventilation (one door opened). Recesses with fewer occupants and higher ventilation decrease CO2 concentration compared to class sessions. The high coefficient of determination (R2) of 0.996 indicated the simulation could identify possible variations in the number of occupants, such as students entering the classroom before the start of the first course and remaining in the room between the first and second courses, as shown in Figure 4. The ventilation efficiency of each door was estimated to be approximately 1.05 h−1, indicating that the ventilator efficiency is higher than with one door opened but lower than with two doors opened. Both turning on the ventilator and keeping two doors open in this classroom can help mitigate the CO2 impact on human health and ideally keep CO2 levels below 1000 ppmv, the standard of the Taiwan Indoor Air Quality Management Act implemented by the Taiwan EPA. Furthermore, by quantitatively estimating physical processes, including ventilation efficiency and occupancy variation, the chemical processes of ozone can be further elucidated.
3.3. O3 Profiles and VOC Formation
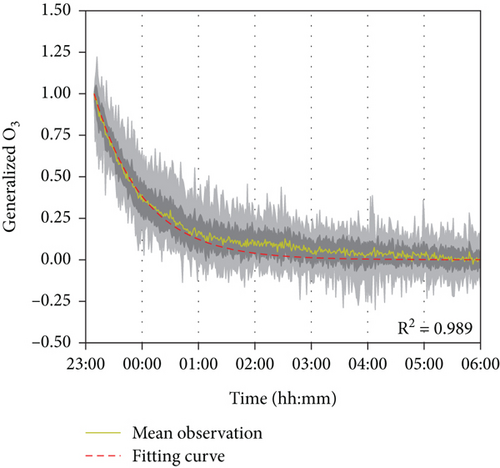
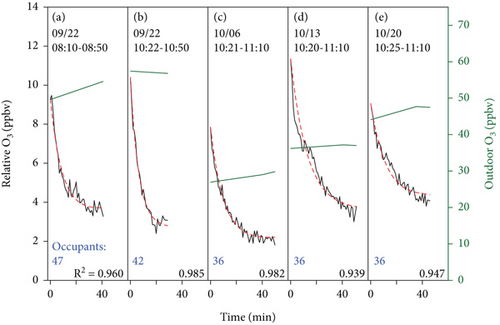
Figure 5 shows the extracted normalized data for each weekday nighttime from 23:00 to 06:00 the next day relative to the concentration at 23:00 when the ventilation was off. The persistent decay trend indicates the uptake of ozone by room surfaces (including furniture and walls) in nonoccupancy and unventilated conditions. With a first-order reaction assumption, the simulation results are highly similar to the observations (average R2 = 0.989), and the deposition velocity of ozone removed by room surfaces was determined at 0.019 ± 0.005 cm s−1, consistent with previous studies ranging from 0.019 to 0.036 cm s−1 (Table 1) [38–40]. With the derived room uptake rate of ozone on room surfaces, the simulation results in the absence of occupants are shown in Figure 6 (average R2 = 0.963). The deposition velocity of ozone removed by human surfaces was estimated as 0.45 ± 0.15 cm s−1, similar to literature ranges (0.20–0.50 cm s−1) and summarized in Table 1 [27, 38, 41]. Human surfaces exhibit a significantly higher deposition rate for ozone (~24 times), suggesting an equivalence when the human surface area is about a quarter of the room surface area (~12 people in this classroom). The residence time of ozone in the classroom is 0.88 h without occupants and reduced to 0.26 h with 40 students present, mainly consumed by human surfaces. The inhalation consumption of ozone has a residence time much longer, ~9.1 h, and is not significant compared to other surface reactions. Hence, in the typical condition of this classroom with 40 occupants, room surfaces account for 22.2% of ozone removal, while human surfaces account for 75.6% and human inhalation accounts for 2.2%. These contributions are influenced by surface materials and the number of occupants. For instance, Xiong et al. reported the contribution to be 42%, 56%, and 2%, corresponding to room surfaces, human surfaces, and human inhalation for a classroom covered with latex paint and a hard tile floor with 57 occupants (air exchange rate ~5 h−1) [38]. Furthermore, although the overall ozone removal rates are similar between the two studies, the significantly lower air exchange rate in this study resulted in a notable decrease in indoor ozone concentration. The reached steady-state concentration varied with outdoor concentrations, as shown in Figure 6. This finding suggests that outdoor ozone primarily affects indoor ozone levels, though the ventilation rate and occupant density may also play a role in different indoor environments. The observed negligible contribution of human inhalation removal is consistent with the previous analysis (2%–4%) [38, 41], supporting the model simulation’s exclusion of this removal effect. The impact of internal air circulation was not quantified in this study, potentially leading to an underestimation of room surface effects and an overestimation of human surface effects on ozone removal.
Ozone reacts with squalene in human skin lipids, producing organic compounds such as Ga, 6-MHO, and 4-OPA [27, 31, 52, 58]. The simulation results of three major products (Ga, 6-MHO, and 4-OPA) under conditions of Figure 6 are shown in Figure S4, with concentrations in a range of 0.7–1.2, 0.2–0.4, and 0.4–0.7 ppbv, respectively, varying with ozone concentrations and the number of occupants. These simulated concentrations likely represent the upper limits of produced VOCs due to the simplified simulation without specific sinks, such as adsorption of VOCs on room surfaces, gas-phase reactions with ozone or other oxidants, and the possibility of ozone reacting with other gas species. These simulated concentrations are consistent with the values observed in previous studies, such as those conducted in a university classroom by Xiong et al. [38] and an occupied residence by Liu et al. [37]. Additional sampling using sorbent tubes with gas chromatography analysis had a mean concentration of 0.037–0.144 ppbv for 6-MHO and 0.031–0.050 ppbv for 4-OPA (Table S2), conducted under three ventilation and occupancy conditions: (1) no ventilation and no occupants, (2) with ventilation but no occupants, and (3) with ventilation and 10 occupants. In Case 1, lower levels of 6-MHO and 4-OPA were observed, indicative of the background or residual concentrations. Case 2 has higher 6-MHO and 4-OPA than Case 1, suggesting the ozone-induced production of VOCs. Case 3 shows similar or lower levels than Case 2. This could be attributed to either the relatively low levels of outdoor ozone and the applied sampling time insufficient to observe VOCs accumulating with only 10 occupants or the nonhomogeneity of indoor VOCs resulting in variance during collection. Even though the sampling lacked temporal profiles, it verifies the presence of these VOCs indoors resulting from the coreactions of ozone and organic compounds.
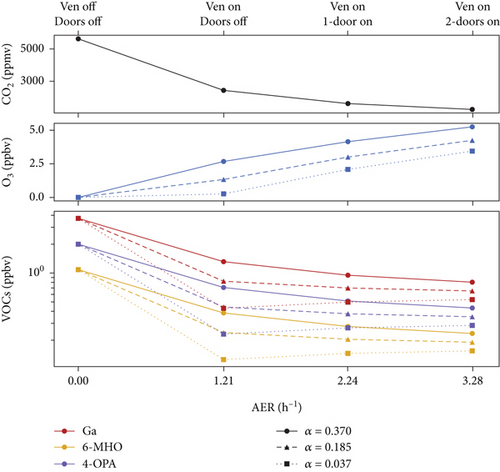
Figure 7 shows the sensitivity test results for CO2, ozone, and VOCs under varied ventilation rates and ozone removal efficiencies of the ventilator (i.e., α parameter) with a fixed occupancy of 40 people after 2 h. Increasing the air exchange rate can effectively reduce indoor CO2 concentration and alleviate human burnout. However, elevated ventilation rates often lead to increased indoor ozone concentrations and VOC production, yet these produced VOCs can be efficiently ventilated outdoors. Comparing VOC levels to the most unhealthy condition (no ventilation and α = 0.37), high ventilation removes 78%–86% of VOCs, while high ozone removal efficiency (i.e., high α) can reduce 86%–88% of VOCs, indicating effective VOC mitigation (Table S3). From an energy-efficiency perspective, simply opening doors can significantly reduce VOC levels without extra energy consumption. Conversely, integrating an ozone scrubber yields lower VOC production but requires regular equipment maintenance. Various room parameters, including room size, ventilation, occupants, and outdoor conditions, influence the tailoring of ventilation strategies.
4. Conclusions and Implications
In this study, the dynamics of indoor air quality, including the variation of indoor CO2 and ozone affected by occupancy and ventilation, were monitored using home-built low-cost AQB systems. In addition to the capability of detecting the conversion of NO2 to NO at parts per billion by volume levels, the home-built AQB system, coupled with model analysis, can track the physical and chemical evolution processes of indoor air quality, providing insights for future indoor air quality management. The constructed models reflected the CO2 profiles, accounting for the ventilation efficiency and the number of occupants. When there are occupants, the ventilation, exchanging indoor and outdoor air, decreases indoor CO2 but increases ozone concentration. In contrast, the presence of occupants increases indoor CO2 due to exhalation and reduces ozone as ozone reacts with human surfaces. The results of ozone simulation show the ozone deposition velocities to room surfaces and human surfaces are 0.019 ± 0.005 cm s−1 and 0.45 ± 0.15 cm s−1, respectively. Sensitivity tests showed increasing ventilation rates reduced indoor CO2 and human discomfort. However, higher ventilation raised indoor ozone and VOC production. Comparing VOC levels in different scenarios indicated mitigation strategies with effective energy use, such as implementing natural ventilation and installing ozone scrubbers. These strategies are particularly beneficial for indoor environments in educational settings with high occupant density. Tailored ventilation strategies, considering room size, occupancy, and outdoor conditions, are crucial for optimizing indoor air quality, as exemplified by the classroom scenario examined in this study. Furthermore, this methodology can be applied to similar systems, such as monitoring cabin air quality, which is affected by traffic conditions, ventilation fan speed, outdoor air quality, and the number of passengers in the car.
This study developed a low-cost AQB sensor system suitable for indoor monitoring due to its advantage of not generating gas-phase by-products. Following effective calibration and baseline correction methods, a novel analysis approach was introduced by incorporating CO2 and ozone simulations into box models, providing reliable profiles of indoor air dynamics. This framework effectively captures indoor air quality variations and informs feasible strategies for improving indoor air quality, such as ventilation enhancements or using pollutant scrubbers. However, the reliability of NOx sensors requires improvement, particularly in calibration, to account for T influence. Additionally, the continuous monitoring of VOCs in this study was limited. This could be enhanced by using VOC detectors with higher resolution and selectivity, though this would increase cost and reduce portability [59]. Integrating multiple AQBs for spatial monitoring, combined with the machine-learning models, could further strengthen the ability of this study to quantify the dynamics of indoor air quality [42, 43, 60, 61]. Expanding the spatial and temporal resolution of monitoring and utilizing machine-learning algorithms to analyze complex interactions among ventilation, occupancy, and pollutant dynamics could refine air quality predictions and support more adaptive management strategies, ultimately improving public health in similar environments.
Conflicts of Interest
The authors declare no conflicts of interest.
Funding
This research was supported by the National Science and Technology Council, Taiwan (112-2111-M-002-014 and 111-2111-M-002-009).
Acknowledgments
We acknowledge the assistance of Grammarly and ChatGPT in enhancing the writing quality of this article, limited solely to the writing itself. This study was supported by the National Science and Technology Council in Taiwan (111-2111-M-002-009 and 112-2111-M-002-014).
Open Research
Data Availability Statement
The datasets used and/or analyzed during the current study are available from the corresponding author upon request.


