Assessing Personal PM2.5 Exposure: A Method Leveraging Movement Routes and Activity Space Information
Abstract
Previous studies have consistently shown a significant correlation between air pollution, particularly PM2.5, and various diseases, as well as increased mortality rates. This study introduces a novel approach for predicting time-specific indoor PM2.5 exposure by incorporating individual movement routes and activity spaces using GPS tracking data and a time–activity diary. The models were trained separately for each hour of the day (e.g., 0:00–0:59, 1:00–1:59) with a total of 24 models. Their applicability was demonstrated with data gathered from actual participants. Additionally, automated machine learning (AutoML) was utilized to optimize prediction performance. The results revealed that the proposed model effectively accounted for the influence of outdoor PM2.5 concentrations and meteorological factors. The performance varied across different indoor environments, with the subway station model showing the highest prediction accuracy. Future research should address these uncertainties, adopt more advanced modeling techniques, and consider diverse indoor variables for a comprehensive understanding. The insights from this study could significantly enhance health risk assessments associated with fine particulate matter exposure.
1. Introduction
Approximately 99% of the global population is exposed to air containing pollutant levels that exceed the guidelines set by the World Health Organization (WHO) [1]. The Global Burden of Diseases, Injuries, and Risk Factors Study (GBD) identifies air pollution as the fourth leading cause of deaths worldwide. Each year, approximately 7 million people die prematurely due to diseases such as stroke, heart disease, chronic obstructive pulmonary disease, lung cancer, and acute respiratory infections, all attributed to air pollution [2]. While previous studies have consistently demonstrated a strong link between air pollution, particularly PM2.5, and diseases [3, 4], most research estimating the impact of PM2.5 concentrations on health outcomes relied on data from stationary monitors [5–7]. These studies, while useful, often assume that outdoor concentrations represent personal exposure, which may lead to inaccurate health impact assessments due to differences between outdoor and indoor environments. Recent studies have demonstrated a low correlation between personal exposure and ambient PM2.5 concentrations [8–16]. This highlights that personal exposure is influenced by individual surroundings and indoor environments, which are shaped by personal activities [17]. Therefore, by assuming that outdoor concentrations from stationary monitors are representative of indoor concentrations and personal exposure may lead to inaccurate health impact assessments [18].
Recent studies have evaluated personal exposure to PM2.5; however, long-term monitoring of personal exposure remains a challenge [19–21]. Studies utilizing personal air samplers have been carried out; however, they were restricted to brief study periods and did not comprehensively capture lifetime exposure in relation to individual lifestyles [22–26]. An accurate assessment of exposure over an extended period is crucial for assessing the health impacts of PM2.5. Although monitoring individual exposure has been challenging due to time and cost constraints, recent advancements in mobile internet technology and the widespread use of location-based service data offer opportunities to track individual spatiotemporal activities [27]. There have been consistent ongoing efforts to leverage this technology to assess personal exposure [28–30].
Conversely, advancements in measurement and data storage technologies provide real-time access to various data, including concentrations of various air pollutants (e.g., PM2.5and PM10) and meteorological data provided by national authorities. However, it is more challenging to obtain indoor air pollution data in real time because of limitations such as the lack of monitoring devices, maintenance challenges, and time and cost constraints. Meanwhile, indoor air quality is influenced by ventilation characteristics [31, 32], and higher temperatures are associated with increased natural ventilation frequencies [33, 34]. Weather variables such as temperature, relative humidity, and precipitation also affect indoor air quality [35]. Considering these characteristics, recent studies have focused on predicting various indoor air quality parameters [36–38].
This study is part of ongoing research aimed at elucidating the impacts of PM2.5 indoor air pollution on allergic diseases in a target patient group. In the present study, we propose a technique for predicting individual daily PM2.5 exposure by considering personal movement routes and activity spaces. The study advances previous indoor PM2.5 prediction models by refining them for specific indoor environments and time periods and subsequently validating them through application in real-world scenarios by subsequently applying them to actual participants. Moreover, AutoML, which is widely used in various fields, was employed to generate optimal predictions. The findings of this study are expected to contribute to more efficient and cost-effective personal exposure assessments in future research and practical applications.
2. Materials and Methods
2.1. Model Training and Input Data Collection
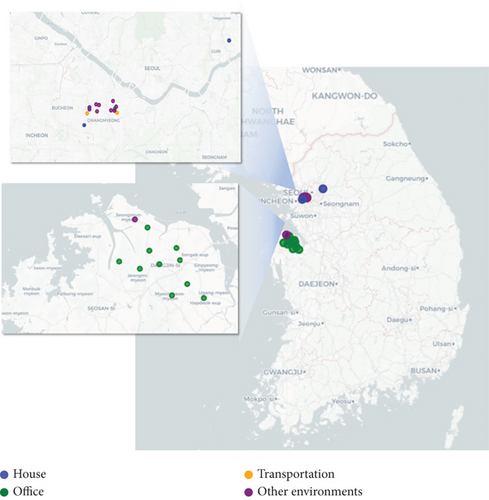
To train indoor PM2.5 concentration prediction models for various indoor spaces based on outdoor environmental variables (PM2.5, temperature, relative humidity, wind speed, and precipitation), data were collected from 25 indoor spaces, including residential indoor spaces, offices, sports facilities, welfare centers, cultural facilities, libraries, underground subway stations, and indoor parking lots. The PM2.5 concentrations at these locations were simultaneously measured indoors and in the immediate outdoor vicinity using a nephelometer-based monitoring device (Dust Mon, Sentry Co. Ltd., Seoul, Republic of Korea) from October 2020 to July 2021 at 1-min intervals (Tables S1 and S2). The measurement locations for residential indoor spaces, offices, subway stations, and other indoor environments are illustrated in Figure 1.
Aside from indoor and outdoor PM2.5 and PM10 concentrations (directly measured using monitoring device), meteorological factors used for model training included temperature (degrees Celsius), relative humidity (percentage), wind speed (meter/second), and precipitation (millimeter). These variables were collected from the automated weather station (AWS) dataset, utilizing publicly available data from the Korea Meteorological Administration.
2.2. Utilization of an Indoor PM2.5 Concentration Prediction Model for Predicting PM2.5 Concentrations in Occupied Spaces
Prior to training the prediction model, we performed a correlation analysis to examine the distribution of space-specific variables and determine which variables impact indoor PM2.5 concentrations. First, we examined the time-series distribution of the input and output variables for each space. Moreover, by performing a correlation analysis for each variable, we aimed to identify the outdoor variables influencing indoor PM2.5 concentrations. Z-standardization was applied to all variables, followed by Pearson’s correlation analysis.
The correlation analysis revealed a high correlation (r ≥ 0.90) between outdoor PM2.5 and PM10 concentrations. To address multicollinearity issues, the PM2.5/PM10 was calculated and used as an input variable. Furthermore, prior to training, the input data were normalized to values between 0 and 1, and rows containing values below the detection limit (ND) were excluded to ensure accurate model training.
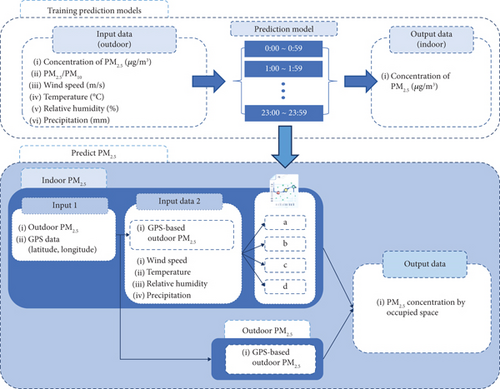
For model training, we utilized the data and hourly prediction model training method from a previous study completed by the research team [39]. The overall framework of the prediction model is illustrated in Figure 2. While the previous study employed a multiple linear regression model for model training, this study is aimed at leveraging optimal machine learning techniques. Therefore, we utilized AutoML, a technique that simultaneously considers multiple machine learning methods and is becoming more prevalent in various fields. AutoML was designed to allow nonexperts in machine learning to access and use machine learning techniques [40]. We selected pycaret.regression, an open-source AutoML package that focuses on regression models, to detect the optimal model based on the R2 criterion for high explanatory power [41].
2.3. Participants
In this study, we aimed to validate the accuracy of the predicted values from the previously developed indoor PM2.5 concentration prediction models for various indoor spaces, based on outdoor variables, by applying it to actual study participants. From November 21, 2022, to April 16, 2023, a total of 39 participants (16 males, 23 females) were recruited for the study (Table 1). Participants were adults aged 19 and older residing in the metropolitan area (Seoul and Gyeonggi-do), without mobility restrictions or difficulties in collecting global positioning system (GPS) data.
| Item | Information |
|---|---|
| Sampling date | 2022.11.21–2023.04.16 |
| Sex | |
| Male | 16 people |
| Female | 23 people |
| Age (median, range) | 40 (19–66) years |
Additionally, this study is part of research aimed at investigating the association between allergic diseases (e.g., asthma, allergic rhinitis, conjunctivitis, and atopic dermatitis) and exposure to environmental risk factors. All studies were conducted after receiving Institutional Review Board (IRB) approval (“Investigation of the Impact of Fine Dust Influx on Indoor Air Pollutant Exposure and Development of Technology for Elucidating Allergic Diseases,” IRB No. 2022GR0384).
2.4. Data Collection From Participants
Data from the study participants were collected, including individual-activity data (e.g., latitude, longitude coordinates and a time–activity diary) and environmental data (e.g., personal PM2.5 concentration). First, for latitude and longitude coordinates, a research application developed by the research team was installed on the smartphones of participants to track their real-time locations during the study period at 5-min intervals [42]. We conducted a survey of symptoms related to allergic diseases along with a time–activity diary survey. Participants completed the time–activity diary in 30-min intervals, categorizing their occupied spaces into six categories (outdoor environment, residential environment, office, subway station, and other indoor environments) throughout the study duration. We used only the results related to occupancy. The occupancy records were collected through a research-specific application developed by the research team to facilitate smooth data collection from participants for clinical purposes.
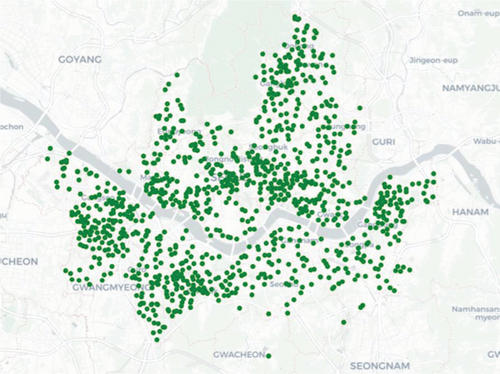
We previously trained an indoor PM2.5 prediction model using PM2.5 concentrations measured from indoor environments and immediately adjacent outdoor spaces. To apply the most suitable outdoor PM2.5 concentrations to the model developed in this study, we aimed to use outdoor PM2.5 concentrations based on participants’ real-time GPS coordinates. In order to more accurately reflect nearby outdoor concentrations rather than relying on national stationary monitors, we used the inverse distance weighting (IDW) interpolation method. First, approximately 1000 IoT-based outdoor air quality sensors (OAQ-C300, K-weather, Korea) were installed across Seoul (Figure 3), measuring concentrations at 1-min intervals. Using the IDW method, outdoor PM2.5 concentration data were generated at a resolution of 500 × 500 m and collected in real time along the participants’ movement routes (latitude and longitude coordinates).
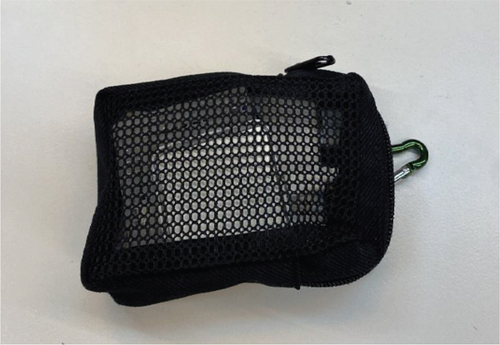
Personal PM2.5 concentrations for validation of predicted values (personal PM2.5 exposure concentrations) were measured with portable fine dust measurement devices, PMM-130 (Brilliant & Company Co. Ltd., Seoul, Korea). The PMM-130 was equipped with a mesh pouch to effectively capture airborne PM2.5. It is designed to be portable, allowing individuals to carry it by attaching it to a bag or clothing (Figure 4).
2.5. Calculation of Predicted Daily Exposure Using Prediction Values
For the personal PM2.5 concentration, the daily average concentration measured during daily activities with the monitor attached to the body was used as the average daily exposure. To calculate the daily average exposure using the portable air quality monitor, we established two criteria to exclude abnormal measurement values caused by transmission errors and sensor malfunctions. The first criterion involved omitting data during periods of low activity. Specifically, we excluded data from 22:00 PM to 06:00 AM if the measured values remained constant for more than 6 h (25% of the day), as this could indicate nonwear time or inactivity during sleep. The second criterion addressed statistical outliers. We identified and removed outliers by filtering out the top 2.5% and bottom 2.5% of the entire dataset, thereby retaining 95% of the data that most accurately reflected typical exposure levels.
3. Results
3.1. Distribution of Indoor and Outdoor PM2.5 Concentrations Across Various Facilities
Table 2 shows the measured indoor and outdoor PM2.5 concentrations for various facilities. In all the indoor spaces, indoor PM2.5 concentrations were lower than the nearby outdoor concentrations. The indoor PM2.5 concentration was highest in the subway station. The indoor-to-outdoor (I/O) ratio differed across various indoor spaces, with subway stations having the highest ratio (exceeding 0.70).
| Facility | Location | N | Mean | SD | I/O | p valuea |
|---|---|---|---|---|---|---|
| House | Indoor | 80,572 | 10.31 | 13.70 | 0.39 | p ≤ 0.000 |
| Outdoor | 80,572 | 26.28 | 20.69 | |||
| Office | Indoor | 412,888 | 16.80 | 22.19 | 0.57 | p ≤ 0.000 |
| Outdoor | 390,717 | 29.44 | 34.74 | |||
| Subway station | Indoor | 42,549 | 20.80 | 18.68 | 0.70 | p ≤ 0.000 |
| Outdoor | 87,500 | 29.90 | 44.78 | |||
| Other microenvironments | Indoor | 417,888 | 15.19 | 21.46 | 0.61 | p ≤ 0.000 |
| Outdoor | 479,247 | 24.96 | 42.00 |
- aResult of Student’s t-test.
Figure 5 displays the results of the correlation analysis between various outdoor measurement variables (PM2.5, PM2.5/PM10, temperature, relative humidity, wind speed, and precipitation) and indoor PM2.5 concentration for each indoor space. First, a positive correlation with a coefficient of 0.35 (p ≤ 0.001) was observed between indoor and outdoor PM2.5 concentrations in residential facilities. Other indoor spaces showed strong correlations, exceeding 0.5 (each, p ≤ 0.001). In particular, the correlation coefficient between indoor and outdoor PM2.5 concentrations in subway stations was 0.85, indicating the strongest correlation among all facility types (p ≤ 0.001).
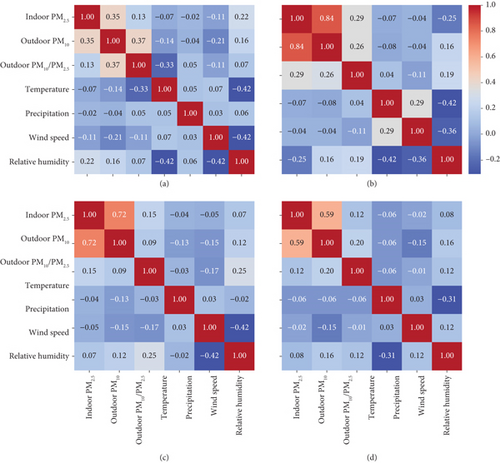
Among the meteorological variables, relative humidity exhibited the highest correlation with indoor PM2.5 concentration. Specifically, the correlation coefficient between indoor PM2.5 and relative humidity was 0.25 in subway stations, indicating a higher correlation compared with that of other indoor spaces. Residential environments also showed relatively high correlations of 0.22 (each, p ≤ 0.001).
The time-series distribution of indoor PM2.5, the subject of interest in this study (Figure 6), revealed that residential environments exhibited higher concentrations during 07:00–09:00 AM than during other periods. The concentrations gradually increased after 18:00 PM, peaked at approximately 20:00 PM, and then gradually decreased. These patterns suggest that the PM2.5 concentrations in residential environments were influenced by the number and activity levels of residents. Increased activity levels during 07:00–09:00 AM (due to preparations for work) and after 18:00 PM (rise in resident numbers and activity levels) contributed to the increase in PM2.5 concentrations, whereas a decrease in activity levels after 20:00 PM (due to preparation for sleep and sleeping) resulted in a reduction in PM2.5 concentrations.
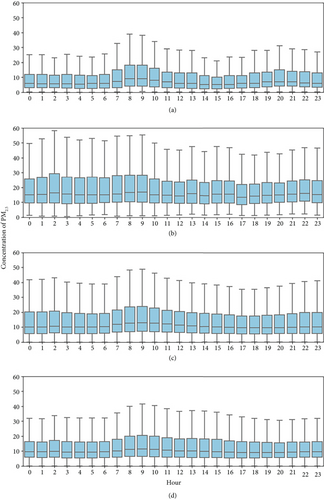
The PM2.5 concentrations in offices showed similar time-series patterns, gradually increasing after 18:00 PM, peaking at 20:00–21:00 PM, and followed by a gradual decrease. In the subway stations, high PM2.5 concentrations were observed at 00:00–09:00 AM, followed by a gradual decrease. After the evening rush hour, the concentrations began to increase again after 17:00 PM. In terms of the measurements taken at subway stations, it could be inferred that settled dust, which remained unsuspended owing to ventilation system inactivity after the cessation of subway operations, was resuspended during the morning rush hour. This was likely caused by increased congestion during morning hours, concentrated ventilation system operation, and increased airflow owing to subway operations.
3.2. Predictions Using Indoor and Outdoor PM2.5 Concentration Models
The performance evaluation results of the prediction models that were employed are listed in Table 3. The R2 value of the subway station model for different time periods was the highest at 0.92 ± 0.07, demonstrating its strong explanatory power. In addition, the R2 values for the other indoor environments were approximately 0.7, indicating good predictive accuracy. Upon examining the RMSE and MAE values, the models for miscellaneous indoor environments (RMSE: 11.00) and offices (MAE: 5.41) exhibited the highest errors. The subway station model with the highest explanatory power exhibited the lowest errors (RMSE: 4.86; MAE: 2.49).
| Facility | Best model | RMSE | MAE | R2 | |||
|---|---|---|---|---|---|---|---|
| Mean | SD | Mean | SD | Mean | SD | ||
| House | ExtraTreesRegressor | 7.77 | 2.25 | 3.79 | 1.03 | 0.66 | 0.12 |
| Office | XGBRegressor | 10.46 | 1.70 | 5.41 | 0.63 | 0.75 | 0.10 |
| Subway station | XGBRegressor | 4.86 | 2.15 | 2.49 | 0.49 | 0.92 | 0.07 |
| Other microenvironments | XGBRegressor | 11.00 | 2.89 | 4.81 | 0.89 | 0.72 | 0.13 |
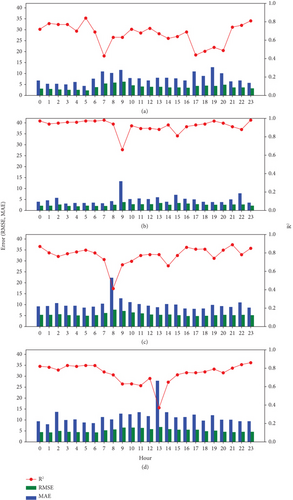
The performances of the time-specific prediction models for the five facilities are shown in Figure 7. Higher RMSE and MAE values correspond to lower R2 values across all facilities. Notably, in the residential environment model, significant errors were observed at approximately 7:00 AM and 19:00–20:00 PM. For the office and subway station models, prominent errors occurred during the morning hours at 8:00–11:00 AM. In the case of the miscellaneous indoor environments, the highest errors were recorded around lunchtime at 13:00 PM.
3.3. Verification Using a Portable Device
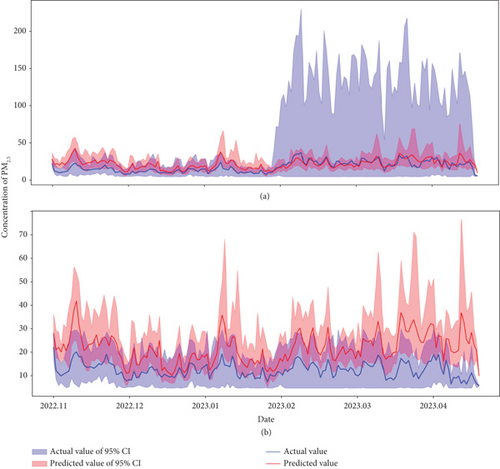
The results of the verification of the proposed model using a portable measurement device showed that the measured daily average concentration of PM2.5 during daily activities and the predicted concentration from the model were 22.51 ± 17.74 and 21.92 ± 8.72 μg/m3, respectively (Table 4 and Figure S1). No statistically significant differences were observed between the predicted and measured concentrations.
| Value | N | Mean ± SD | Max | p valuea |
|---|---|---|---|---|
| Actual value | 3951 | 22.51 ± 17.74 | 169.98 | 0.06 |
| Predicted value | 3951 | 21.92 ± 8.72 | 89.17 |
- aResult of paired t-test.
The average concentrations of the measured and predicted values for all participants during the research period exhibited very similar trends (Figure 8). This result confirms the applicability of the proposed individual exposure estimation method for practical applications and demonstrates that individual exposure assessment can be achieved without direct monitoring using a sensor, relying solely on outdoor PM2.5 concentrations and meteorological data.
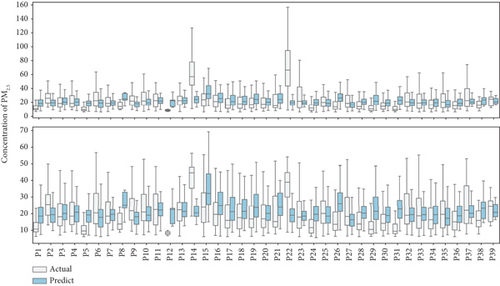
Comparing the measured and predicted values for each research participant (Figure 9) revealed that P14 and P22 had measured values that were 2.5 times and 3.6 times higher than the predicted values, respectively. This suggests that, in the indoor spaces where these individuals resided, the measured values were higher than the predicted values. Further refinement of the prediction model through the identification of influential variables affecting indoor PM2.5 concentrations and incorporating them into the model should improve predictions for cases with elevated exposure levels.
4. Discussion
In this study, we propose a technique for predicting individual daily PM2.5 exposure concentration by considering personal movement routes (using GPS coordinates) and activity spaces (using a time–activity diary). Individual exposure levels, accounting for each participant’s mobility patterns and time spent in different microenvironments, were predicted. Furthermore, the estimated individual exposure levels were compared to and verified against personal PM2.5 concentrations recorded with portable air quality monitors. The aim was to develop and evaluate the individual exposure estimation model and to demonstrate its potential applicability in assessing individual exposure by applying the model to real-world situations.
Measured PM2.5 concentrations in residential and other indoor spaces revealed that the I/O ratio for PM2.5 was consistently less than 1 across all environments. An I/O ratio exceeding 1 typically indicates the influence of indoor sources, such as smoking or other combustion activities, whereas a ratio below 1 suggests that outdoor air exchange is a determining factor in indoor concentration levels [44]. Therefore, it was inferred that the outdoor air was a major contributor to PM2.5 concentrations in all indoor spaces studied. Previous research has demonstrated that outdoor air is the primary influencing factor in indoor environments in spaces devoid of specific indoor sources, such as schools and offices [45, 46]. The I/O ratio tends to be lower in homes with high natural ventilation rates [47], whereas indoor particle accumulation is more pronounced at low air exchange rates [48].
Furthermore, ventilation rates are influenced by outdoor temperature, showing distinct seasonal fluctuations [44], which suggests that both outdoor PM2.5 concentrations and seasons are important factors influencing indoor PM2.5. Consequently, the weather variables used as inputs in this study were confirmed to be significant explanatory variables for predicting indoor PM2.5 concentrations.
When analyzing the correlation between indoor and outdoor PM2.5, a weak correlation (r = 0.35, p ≤ 0.001) was observed for residential environments, whereas other indoor microenvironments (offices, subway stations, and other microenvironments) showed correlations of approximately 0.6 or higher. Previous studies have reported positive correlations between indoor and outdoor PM2.5 concentrations, with correlation coefficients ranging from 0.52 to 0.94 in various indoor spaces [49–51]. The correlation analysis between indoor PM2.5 concentrations and outdoor meteorological variables (temperature, relative humidity, wind speed, and precipitation) revealed that relative humidity exhibited the strongest correlation across all facilities. Wind speed was also correlated with indoor PM2.5 concentrations. This aligns with previous research results [52, 53], emphasizing the impact of atmospheric conditions on indoor PM2.5 concentrations.
Examining the temporal distribution characteristics of the concentrations in the five facilities, subway stations exhibited the highest average concentrations across all time periods. Each facility exhibited elevated concentrations during specific time periods. Previous studies have shown that indoor PM2.5 concentrations differ depending on the activities of the occupants, with higher concentrations occurring during periods of increased activity [53]. Therefore, considering temporal patterns is crucial for the accurate assessment of indoor pollutant levels.
Based on the use of AutoML for the five types of indoor spaces, the optimal models for residential and other indoor environments were identified as ExtraTreesRegressor and XGBRegressor, respectively. The subway station model exhibited the best predictive performance (RMSE, 4.86; MAE, 2.49; and R2, 0.92), whereas the residential environment model had a predictive performance lower than that of other facilities. This discrepancy is likely due to frequent combustion activities (cooking, candle usage, and smoking) in residential environments, which can influence indoor PM2.5 concentrations more often than in other indoor environments [54, 55]. Continuous research on the relationship between outdoor data and indoor PM2.5 concentrations is necessary to overcome the cost limitations associated with monitoring via instrument installations and to accurately estimate individual exposures.
Furthermore, trained prediction models were applied to actual study participants and the predicted values were compared with real-time PM2.5 exposure concentrations recorded by portable monitors. Comparisons were made between daily average concentrations and predicted values calculated using the models that considered time-weighted average based on activity spaces and occupancy times. A comparison of the measured daily average concentrations revealed no statistically significant differences between the predicted and measured values. Although two participants with high concentrations showed discrepancies between predicted and measured values, this was attributed to their high frequency of exposure to indoor sources. In the future, if more data are collected and additional variables beyond the outdoor variables used in this study are incorporated to reflect indoor pollution sources, it will likely help in predicting the exposure levels of individuals experiencing high concentrations due to indoor emission sources.
When comparing the predictive performance of the models across various time periods, offices and subway stations showed similar patterns of high concentrations and low predictive performance during specific time periods, such as 08:00–09:00 AM, when the probability of high activity intensity of occupants was greatest. Therefore, high activity frequency during specific time periods can lead to imbalances, outliers (cases where concentrations are significantly higher than the mean), and a negative impact on prediction model training [56]. The quality of data (outliers, uneven distribution, etc.) has a significant influence on predictive performance, and addressing these issues requires additional research [57], especially considering that pollution data frequently do not follow a normal distribution or uniformity, as observed in this study. To address these issues, researchers in various fields are pursuing new solutions. Future improvements in these areas are expected to lead to more accurate assessments of individual exposure. In the future, once these limitations are addressed, more accurate evaluations of the health effects associated with exposure to PM2.5 are expected. This study demonstrated the importance of training data and spatiotemporal factors in determining prediction model performance, which can serve as a basis for future model training. Rather than solely focusing on the types of machine learning techniques used in model training, the significance of training data is increasingly being recognized [57, 58]. Because this study relied on limited data for indirect estimation, acquiring a wider range of data for various spaces is expected to enhance the accuracy of evaluating individual exposures. Moreover, further in-depth research is required to identify the variables for predicting PM2.5 concentrations in various indoor spaces.
Despite these limitations, the average levels and trends of predicted and actual daily individual exposure were similar. The current study is part of an epidemiological research effort focusing on the accurate estimation of individual PM2.5 exposure levels. The proposed method is expected to be utilized in future studies exploring the associations between various diseases, such as respiratory and cardiovascular diseases, and PM2.5 exposure. This will enable a more precise exploration of the health effects related to PM2.5 exposure, ultimately contributing to the development of targeted public health interventions. By enhancing our understanding of exposure–disease relationships, we believe this methodology can be instrumental in bridging knowledge gaps in environmental health research.
5. Conclusion
In this study, we proposed and validated a method for predicting individual daily PM2.5 exposure concentrations using GPS coordinates and time–activity diary data. The results confirmed that outdoor PM2.5 concentrations significantly influenced indoor concentrations across all indoor environments, and meteorological variables were also shown to be important explanatory variables for predicting indoor PM2.5 concentrations. The performance of the prediction models trained using AutoML varied depending on the type of space, with the subway station model showing the highest predictive performance. When the developed prediction model was compared to data from actual study participants, the daily average levels and trends of the predicted individual exposure concentrations were similar to those measured in real time, demonstrating the practical applicability of the proposed method.
Although some limitations exist, the methodology presented in this study is considered to be an important first step toward improving the accuracy of individual exposure estimation. With future efforts to collect additional data and incorporate more variables, more precise health impact assessments are expected. This approach can be effectively utilized in future studies exploring the associations between PM2.5 exposure and various diseases, such as respiratory and cardiovascular diseases. Ultimately, it is anticipated that this methodology will play a significant role in accurately evaluating health effects due to PM2.5 exposure, contributing to the development of targeted public health interventions, and bridging knowledge gaps in environmental health research.
Ethics Statement
IRB approval was received (“Investigation of the Impact of Fine Dust Influx on Indoor Air Pollutant Exposure and Development of Technology for Elucidating Allergic Diseases,” IRB No. 2022GR0384).
Conflicts of Interest
The authors declare no conflicts of interest.
Author Contributions
Conceptualization, Shin-Young Park, Cheol-Min Lee, and Dae-Jin Song; data curation, Shin-Young Park, Cheol-Min Lee, and Dae-Jin Song; formula analysis, Shin-Young Park and Cheol-Min Lee; investigation, Shin-Young Park; methodology, Shin-Young Park, Jeong-An Gim, Il-Ho Park, Cheol-Min Lee, and Dae-Jin Song; project administration, Cheol-Min Lee and Dae-Jin Song; supervision, Cheol-Min Lee and Dae-Jin Song; visualization, Shin-Young Park; data analysis, Shin-Young Park; writing—original draft preparation, Shin-Young Park; writing—review and editing, Shin-Young Park and Cheol-Min Lee. All authors have read and agreed to the published version of the manuscript.
Funding
This research was supported by Korea Environmental Industry & Technology Institute (KEITI) through the Environmental Disease Prevention and Management Core Technology Development Project, funded by Korea Ministry of Environment (MOE) (project number RS-2022-KE002339/2480000031).
Open Research
Data Availability Statement
The concentration, GPS, time–activity data used to support the findings of this study are restricted by IRB No. 2022GR0384 to protect patient privacy. AWS data can be obtained free of charge from https://data.kma.go.kr/data/grnd/selectAwsRltmList.do.


