Comparative Assessment of Thermal and Visual Comfort in Immersive Virtual Environments Based on Varied Activity Intensity: A Pilot Experimental Study
Abstract
Activity levels are crucial in thermal comfort (TC) studies, and specific activities determine the choice of visuals in building design for users. This research presents a pilot study for the experimental design to assess comparability between visual scenarios and TC in controlled settings under different activity intensities for an immersive virtual environment (IVE) while sampling unregulated environments. This experimental design compares two distinct metabolic activity intensities, comparing observations between unregulated and virtual thermal controlled environments. Observations were conducted in Monash University Makerspace, an unregulated environment, to understand users’ thermal and visual perceptions based on activity intensities, clothing levels, and lighting. The observations in a controlled setting were carried out in the simulated IVE where participants were exposed to 18°C, 24°C, and 30°C with cool white light simulation. Data were analyzed using interval plots and linear regression which indicates higher thermal sensations, discomfort, and heat when carrying out high-intensity activity for the same clothing level. In comparison, in the controlled setting, the same behavioral intention selected in the IVE applied to the unregulated environment. Previous studies have not explored whether TC aligns in virtual reality (VR) for different activity intensities, especially for high-intensity activity. Also, there is a need to understand how thermal and visual comfort is influenced by visual scenarios under varied activity intensity and thermal condition changes. A feasibility study using VR for low-intensity activity in a controlled climate shows changes in visual perception during different thermal conditions. The study contributes to understanding the feasibility of the experimental design of VR for the TC changes’ observations based on two activities.
Summary
- •
Comparability study between visual scenarios and thermal comfort in a controlled setting for IVE with observation from an unregulated environment.
- •
A conceptual model for the unregulated environment and immersive virtual environment hypothesis testing.
- •
Feasibility of the experimental design for VR to understand thermal and visual comfort observations and adaptive behaviors.
- •
The study revealed higher thermal sensations, discomfort, and heat when carrying out high-intensity activity for the same clothing level in unregulated environments.
- •
The same behavioral intention selected in the IVE applied to an unregulated environment at the same temperature ranges.
1. Introduction
Thermal comfort is a state of psychological and physiological satisfaction with the indoor environment [1]. This depends on several factors, such as air temperature, relative humidity, air velocity, clothing insulation, and activity level [2]. Researchers emphasized that thermal comfort is more of subjective opinions or feelings than the objective approach of environmental stimulus in a field or laboratory. Thermal comfort can be evaluated using either a subjective or objective approach, although there is no agreement or consensus on how thermal comfort should be assessed [3].
The subjective measure or approach collects thermal comfort perception by making inquiries from users. The objective measure is estimating predicted mean vote (PMV) derived from the complex equation or using smart devices (Fitbit, Empatica wristband) to understand the physiological responses such as skin temperature and heart rate of humans under different thermal conditions [4]. However, there are discrepancies between both measures where one might be suitable or not for certain groups, environments, or genders [5–7]. Studies have adopted more subjective measures from participants than objective measures which do not depict holistic perceptions [8–10].
In recent years, research in indoor environments has moved from a single domain to a multidomain or multimodal effect which has a link or impact on human perceptions and behavior [11]. Studies are now carried out to understand the effects of two or more indoor environmental stimuli such as a combination of thermal and visual, visual and acoustic, thermal and acoustic, and thermal and air quality and its impact on perception and performance. Multidomain studies can be categorized into two: cross-modal and combined effect. The cross-modal can be further categorized as cross-modal main effects and cross-modal interaction effect [12]. However, the cross-modal effect is when a stimulus influences other stimuli (i.e., light influences thermal responses or vice versa). The combined effect is when multiple stimuli influence comfort perception, behavior, and performance.
In setting up a single or multidomain study with human participants, a pilot study is required to understand the experimental design which is vital to comprehending the perception of users. Pilot and feasibility studies are tools or concepts used to explore a trial design for in-depth information before progressing with the main study [13]. The feasibility concept encapsulates whether an idea will work or can be done and whether it can proceed to the main study. Nevertheless, all pilot studies are feasibility studies but not all feasibility studies are pilot studies. A pilot study can assist in reshaping or restructuring questions or processes and help in understanding any mistakes that need amendment in the main study.
- 1.
To understand trends of literature on visual and thermal comfort for built environments in VR
- 2.
Carry out a pilot study test in an unregulated environment for thermal and visual comfort and user adaptive behaviors and conduct a feasibility study test in a regulated environment for VR
- 3.
To conduct a detailed explanation of hypothesis testing for previous thermal and visual comfort in VR and conceptual model for this study
- 4.
To measure the possible adverse effects of cybersickness in VR
The rest of the paper is as follows: Section 2 reviews the existing thermal comfort design and conceptual framework for this experiment. Section 3 discusses the methodological approach used in carrying out the pilot experiment and observational study while Section 4 discusses the preliminary findings obtained from the experiment. Section 5 describes the conclusion and limitations of the study.
2. Literature Review
2.1. Overview
This section explains thermal comfort and factors influencing thermal comfort such as activity, physiological, and personal features of individuals. It also reviews the conceptual framework for designing thermal comfort research and discusses the hypotheses behind previous studies and other gaps that need exploration. Finally, the limitations of some of the experimental designs especially using virtual technology for thermal and visual comfort research were elaborated.
2.2. Conceptual Framework for Thermal Comfort Research Design
Thermal comfort is influenced by two factors which are environmental and personal. Environmental factors consist of air temperature, relative humidity, radiation temperature, and airspeed while personal factors include the clothing level and metabolic rate [15]. Among these two factors, personal or human factors cannot be accurately measured or predicted, unlike environmental factors where sensors are used. Even though ASHRAE 55 standards have been given for clothing ensemble and activity-based metabolic rate values, this does not properly depict or accurately capture the current clothing insulation and metabolic rate of individuals in a building because different clothing has various insulation values and activities have several intensities [16]. Clothing is an important measure that serves as insulation to prevent or ameliorate environmental conditions (indoor or outdoor) to the body [17]. The clothing level values vary from 0.36 to 1.5 depending on the level of clothing worn by individuals which can be calculated using ASHRAE 55 standards for each clothes. The perception of indoor environments being cold, hot, or neutral is subjective and can be influenced by these personal factors, the physiological and psychological state of users.
Activity-based metabolic rate has a significant influence on thermal sensations and comfort of occupants or users which includes sitting, walking, running, and climbing [2]. The level of activity carried out by users causes the transformation of chemical energy into heat and mechanical work. This is usually expressed in watt per meter square (W/m2) where 1 met =58.15 W/m2 for a relaxed position. However, the activity diary which shows the current metabolic rate estimation for different activities ascribes metabolic rate as a constant value that does not factor in individual differences such as age, sex, steady state, and body mass index (BMI) [16].
As the metabolic rate rises, there is also a rise in the quantum of heat generated, and for the heat to be dissipated, the blood flow increases which in turn increases the heart rate [18]. The physiological response such as heart rate and skin temperature measurement serve as an indicator of the subjective experience of users within a given environment. This measure can provide valuable insights into how individuals interact with and respond to their surroundings. According to research, physiological response ranges of skin temperature and heart rate for sedentary activities are 31°C–35°C and 70–100 beats per minute (bpm), respectively [2]. Nevertheless, heart rate varies between individuals depending on their age, weight, lifestyle, health, and other physical features. This heart rate tends to increase in hot and cold conditions and the increase in the heartbeats can vary from 5 to 10 bpm if the individual is subjected to hot or cold conditions during physical activity [19].
Activity level has a high tendency to boost the metabolic rate of occupants from the usual relaxed sitting position of 58 W/m2 which affects thermal sensation and comfort level [20]. Besides, visual conditions have been said to have a significant impact on thermal perception. Moreover, studies have hitherto concentrated on a particular stimulus, such as thermal, visual, air quality, and acoustic. Of late, research has been conducted to better understand the multimodal effects of indoor environments using a real environment with the aid of cutting-edge technology, that is, VR. In line with a few of the findings using this technology, visual conditions have the potential to alter the perception of thermal comfort which necessitates more explorations [21–23].
As indicated in Figure 1, the experimental design for thermal comfort research is divided into two categories which are between subjects (independent measures) and within subjects (repeated measures) [11]. Between-subjects design is commonly used for thermal comfort experiments because it allows examination of populational features such as ethnicity, age, and sex which may not be achievable when adopting within-subjects design. For between subjects, this can be categorized as matched or unmatched groups. When the groups are matched, anthropometric variables such as height, weight, percentage of body fat, body surface area, and BMI are adopted [14]. However, if the groups are not matched, a covariate analysis is recommended to minimize the effect of confounding variables for indoor settings. These covariates such as age, gender, ethnicity, height, weight, and metabolic rate which change based on activities performed can affect dependent variables [20].
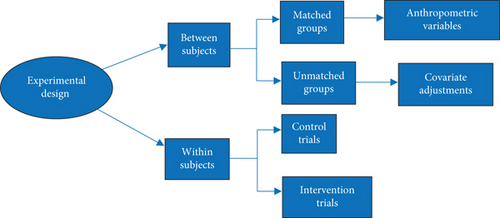
Within-subjects design is adopted to comprehend differences in different conditions or treatments [24]. Within-subjects design is employed to test influence or differences in different conditions. For example, a test needs to be carried out to understand the seasonal variation in thermal comfort in a chamber lab or field study [25]. The same participant used for one season should be used for other season changes that need to be tested. Under the design, we have the intervention and control trials; these are used to rule out potential order effects. Depending on the nature of the experiment, the separation period for control or intervention trials differs. The control and intervention trials must be conducted or designed in a manner that is randomized and counterbalanced [26].
According to previous studies, experimental duration varies depending on the type of test that needs to be performed. This can be categorized into short, medium, and long-duration experiments. The short period of the test takes 1.5–2 h of chamber lab study [27]. This is mostly used to understand the personal thermal comfort of users while the medium period of the test takes 3.5–8 h duration [28]. This is performed to assess work or learning performance. When the test is carried out to understand heat wave event study whether acute or chronic exposure, this a long duration [29, 30].
Table 1 displays the previous study on thermal and visual comfort observations and design for VR. Prior studies indicate that the stabilization period for changes in thermal conditions in the experimental setup (18°C–24°C, 24°C–29°C, 16°C–24°C) is set within the range of 15–20 min [45]. The acclimatization period (pre-experimental phase) is typically between 10 and 20 min depending on what other information needs to be passed to participants before starting the experiment in the testing room [34]. Yeom et al. [40] did not specify the amount of time that was used to stabilize each thermal condition that was observed. It was merely mentioned that the temperature was changed by 1°C after 10 min and thermal perception was collected. Furthermore, Salamone et al. [41] did not disclose the thermal conditions that were used for the participants in both real and virtual environments. Chinazzo et al. [21] reported that one participant used 30 min for three daylight conditions that were observed which translates to 10 min for each daylight observed for specific thermal conditions. A thorough experimental design was absent as regards the acclimatization and stabilization period for the VR thermal comfort observations.
| Authors | Experimental design | Sample size | Thermal conditions | Visual conditions | The time interval for thermal/visual perception | Perceptual variables | Physiological variables | Activity | Behavioral actions/intentions | Clothing insulation level | Validation (real and IVE) | Single/multidomain |
|---|---|---|---|---|---|---|---|---|---|---|---|---|
| [31] | Between subjects | 9 | — | 2 visual conditions (dark and bright) | 30 s | Performance | — | Reading task, identifying, and counting objects | — | — | √ | Single domain |
| [32] | Between subjects | 112 | — | Four visual environments | — | Visual comfort | — | Reading task | — | — | — | Single domain |
| [33] | Between subjects | 160 | — | Five lighting conditions | 30–45 min | Visual preferences | — | Reading task | Blind control | — | — | Single domain |
| [34] | Within subjects | 17 | 18°C, 24°C, and 29°C | — | 5 min | Thermal perception | Heart rate and skin temperature | Listening to music | √ | Varies | √ | Single domain |
| [35] | Between subjects | 89 | — | 32 lighting combinations | — | Lighting preferences | — | Reading | — | — | — | Single domain |
| [36] | Between subjects | 1 | — | 4 occupancy and lighting state (STED modeling) | 70 min | — | — | — | √ | — | — | Single domain |
| [37] | Between subjects | 27 | 24°C and 29°C | Three visual conditions (blue, neutral, and orange) | 10 min | Thermal and visual perception | Skin temperature and heart rate | Reading | — | 0.80 | Multidomain | |
| [23] | Between subjects | 45 | 22°C–23°C, 26°C–27°C | Synthetic glare (north and south facing) | 10–15 min | Thermal and visual perception | — | Reading | √ | N/A | — | Multidomain |
| [38] | Within subjects | 28 | — | Daylight (clear and overcast sky) | 30 min | Visual comfort | — | — | — | — | √ | Single domain |
| [39] | Within subjects | 20 | — | Luminous conditions | 5 min | Visual perception and appearance | — | — | — | — | √ | Single domain |
| [40] | Between subjects | 16 | 20°C–30°C | — | 10 min each | Thermal sensation | Heart rate and skin temperature | Reading | — | 0.80 | √ | Single domain |
| [21] | Between subjects | 27 | 24°C and 29°C | Daylight (blue, neutral, and orange) | 10 min | Thermal and visual perception | Skin temperature and heart rate | — | — | 0.61 | Multidomain | |
| [41] | Within subjects | 25 | Not specified | Hot environment (red) and cold environment (blue) | 8 min | Thermal and visual perception | Skin temperature and heart rate | Low-intense activity, that is, watching | — | — | √ | Multidomain |
| [42] | Between | 30 | — | 3 different lighting scenarios | 20 min each | Visual preferences, satisfaction, task performance | — | Reading task | Light control | — | — | Single domain |
| [43] | Between subjects | 53 | — | 8 light scenes | 25 min | Visual comfort | — | — | — | — | √ | Single domain |
| [44] | Between subjects | 104 | 24°C | 4000 k | 10 min each | Visual and thermal perception | — | Reading | √ | 0.61 | √ | Single |
| [45] | Between subjects | 52 | 16°C and 24°C | 4000 k | 10 min each | Visual and thermal perception | — | Reading | √ | 0.61 | — | Single domain |
In addition, Heydarian et al. [32] and Heydarian et al. [35] research did not specify how long each participant had to choose lighting and complete reading tasks in the experiment. Similarly, visual preferences and control were conducted and the duration of the experiment was stated in the same author’s research which might fall within the same range [33]. Abd-Alhamid et al. [39] examined visual preferences that were pleasantness, interest, spaciousness, complexity, and excitement as stated in Table 1 while luminous appearances were assessed by subjective opinions of users which included brightness, color temperature, and distribution. Mahmoudzadeh et al. [42] assessed lighting system control for three scenarios which are conventional lighting, daylight responsive lighting, and interactive lighting. The studies revealed that users prefer a combination of natural and artificial lighting.
2.3. Previous Studies on Hypothesis Development for Thermal and Visual Perceptions in VR
The hypothesis development for thermal and visual comfort research in the built environment is summarized in Table 1. Heydarian et al. [46] investigated lighting-use behavior for manual or semiautomatic control with a focus on control, including shades and lights. Another study by Heydarian et al. [32] investigated different groups (i.e., bright and dark scenarios) in real and virtual environments to understand performance levels (comprehension, reading speed, and object identification). The study adopted a within-group design for dark and bright for physical or virtual and between-group design, respectively, IVE and physical environment. Significant differences were recorded between dark and bright conditions of IVE as well as physical conditions for comprehension, reading speed, and object identification, respectively. Saeidi [34] investigated whether there is a range of different thermal conditions for both environments, that is, real and virtual contexts. However, there was no significant difference in those thermal conditions examined. Furthermore, the study revealed a moderate to strong correlation on thermal perception except for 24°C.
Heydarian et al. [33] hypothesized whether users will keep default lighting settings or adjust to different natural and artificial lighting such as opening shadings. Heydarian et al. [35] tested how interpersonal characteristics of user influence their visual comfort and lighting behaviors. In both studies, most users who participated preferred daylight over electric lighting. Saeidi et al. [36] sought to determine whether real-world illumination behavior matched with the simulated environment. The entire study supports the usage of an immersive virtual environment to simulate the real environment.
For a between-subjects design, Yeom et al. [40] adopted mismatched groups for a covariate, that is, gender. The result indicates there were higher thermal sensations in IVE compared to the real environment. Additionally, the average heart rate values for males were higher in real to immersive environments by 1.4 bpm from an average heart rate of 85.5 bpm in IVE while for the females they had the same range (75 bpm) for both contexts. Chamilothori et al. [38] tested whether there is a significant difference in visual perception for real and virtual environments for office settings. Ozcelik et al. [23] hypothesized that interactions with heating/cooling and lighting fixtures/shades/blinds are the same for Groups 1 and 2. Group 1 is 26°C–27°C, south facing office, while Group 2 is 22°C–23°C north facing office in Los Angeles, Southern California, United States. This study found out that Group 1 focused on visual comfort first before adjusting thermal conditions while this was vice versa in Group 2.
Also, research tested how visual stimuli (watching videos of hot (red)/cold (blue) environments) influence thermal perception. The hot environment in the context of the VR experiment was volcanos evoking heat and the other environment was snow scenes as a cold sensation which symbolizes the hue heat hypothesis [41]. There were no significant differences experienced in both environments (real and IVE). Chinazzo et al. [21] tested the effect of visual conditions in varied thermal conditions, that is, daylights combined with thermal conditions, and its impact on thermal and visual perception. Daylight color significantly influenced the thermal perception of users, but there was no significant effect of thermal conditions on visual perception.
Rockcastle et al. [43] theory was based on how viewing direction and sky type influence visual attraction in the area under various daylight conditions. Mahmoudzadeh et al. [42] investigated visual preferences for three different control arrangements for lighting (natural and artificial), that is, manual, automated, and semicontrol. Users prefer natural or natural coupled with electric light. Latini et al. [44] investigated if there was a significant difference between real and virtual environments for the same thermal condition but found no significant differences. Latini et al. [45] investigated the impact of two thermal conditions (16°C and 24°C) on visual and thermal comfort. Significant differences were observed between the two conditions. Limited evidence suggests that further investigation is required to understand how visual perception changes under different thermal conditions and vice versa. This is in contrast to previous studies by [21, 23, 45]. While there have been studies exploring the multidomain effects of immersive environments, more research is needed to understand the cross-modal impact of visual and thermal conditions on perception and behavior. Additionally, studies involving VR and visual and thermal perceptions are focused on sedentary activities, such as reading, sitting, listening to music, or watching videos in an IVE. Studies are essential to understand the perceptions and behaviors of users in an intense activity which is higher than the sedentary activities in VR.
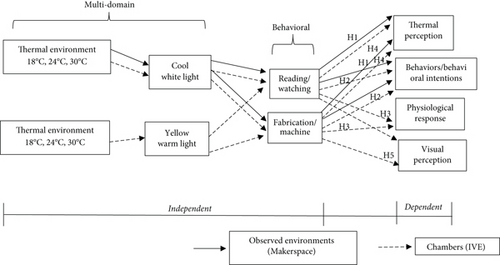
To validate the study of unregulated environments, two activities will be examined in a controlled climate chamber. When designing the experiments for the pilot study, practical considerations such as the uniform clothing level were taken into account. It is worth noting that the environment, where observations of two activity levels were collected, was unregulated and differed from the chamber with a controlled climate. In the unregulated environment, variables constantly change with time and are dynamic. These variables include environmental, wearing and removing clothes without restriction, psychological, physiological, and behavioral adaptation. Furthermore, in an unregulated or realistic environment, it becomes impractical to manage the insulation level of clothing worn by individuals for daily observations in the physical space. The clothing insulation levels would need to be collected through surveys during the observation process. The study is aimed at categorizing different types of clothing worn during observations and understanding how the insulation level of these clothes affects thermal perception. To validate the experiment in the chamber with real-world thermal comfort observations, it is necessary to get averages and median of clothing levels during physical space observations for temperature ranges to better understand patterns and changes. A proposed conceptual model was developed for the thermal comfort observations that are intended to be carried out for the main study as shown in Figure 2.
2.4. Research Hypothesis
Hypothesis 1. There is no significant difference in thermal perception between the physical environment and IVE for reading/watching and fabrication/machine work.
Hypothesis 2. There is no significant difference between observed adaptive behaviors in the physical environment and behavioral intentions in an IVE for reading/watching and fabrication/machine work.
Hypothesis 3. There is no significant difference between the physiological responses in the IVEs (warm yellow light and cool white light) for reading/watching and fabrication/machine works.
Hypothesis 4. There is no significant difference between thermal perception in the IVEs (warm yellow light and cool white light) for reading/watching and fabrication/machine works.
Hypothesis 5. There is no significant difference between visual perception of IVEs (warm yellow light and cool white light) under different thermal conditions for reading/watching and fabrication/machine works.
3. Research Process and Approach
Postpositivism and mixed-method approaches were adopted for this research. The data collection techniques used in thermal comfort studies include questionnaires, experiments, calculations, and simulations in laboratory or field settings [47]. Thermal comfort studies can be carried out in two major ways which are field or laboratory studies and are called rational (chamber) and adaptive (field). A rational approach would entail conducting a study in a controlled setting, where the intended environmental conditions can be established and regulated. Conversely, the adaptive approach is more practical as it employs real-world settings, where individuals have full autonomy to carry out their duties and variables fluctuate over time. These variables are not static and dynamic such as wearing different clothes; environmental changes; and psychological, physiological, and behavioral adaptation [48]. The study adopted two different ways of observing dependent variables of thermal comfort using subjective and objective measures.
3.1. Surveyed Building
The surveyed building is the Monash Makerspace where real environment observations and data are collected with NEMo (next environmental monitoring) sensors and perceptions through questionnaires. The questionnaires were based on demographic information, thermal and visual perception, and adaptive behaviors. This is a dynamic environment where variables change with time such as environmental and personal parameters. The Monash Makerspace is a collaborative environment where students can develop innovative products from conception to completion as shown in Figure 3. There are various teams in this building such as Precious Plastic Monash (PPM), High Powered Rocketry (HPR), Monash Human Power (MHP), Unscrewed Aerial Systems (UAS), Monash Nova Rover (MNR), Monash Motorsport (MMS), and electrical section. However, each team has students who are trained to work in the machine and fabrication section of the space.
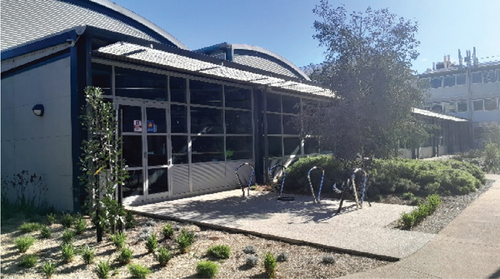
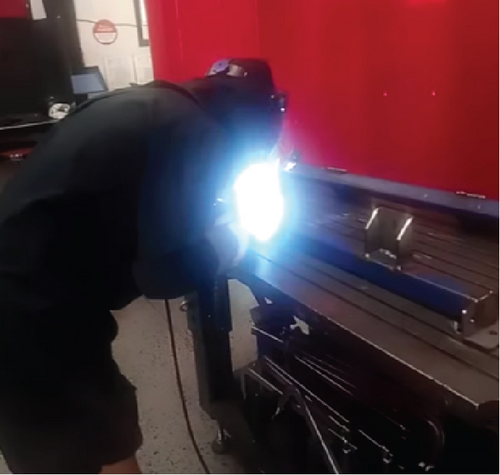
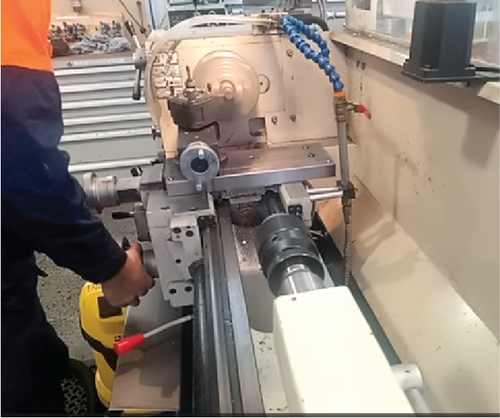
An observational study of thermal comfort and user-adaptive behaviors was carried out in the Makerspace. These observations were only focused on two forms of physical activity, that is, reading/watching (low-intensity activity) and fabrication/machine (high-intensity activity). There are various adaptive behaviors users exhibit when carrying out activities such as clothing adjustment, fans on/off, heaters on/off, thermostat increase/decrease, window open/close, drinking water, and no intention/action. However, this study focuses on the most common adaptive behaviors which are clothing adjustment, fans, no action/intention, window open/close, and heater [49].
3.2. Observations With Questionnaires
Before observations were carried out in space, approvals were obtained from the human research ethics from the university. The observations for the pilot study were carried out for 2 weeks in May during the autumn season to understand thermal sensation when performing different levels of activity. The researcher went into the building every day to collect thermal perception based on varied levels of physical activity, that is, low- and high-intensity activity.
For the high-intensity activity, the researchers stay with participants carrying out the activity and collect their thermal perception during or at the end of the activity as shown in Figure 3b,c. During the activity, the participant pauses the activity to fill the survey for 2 min, or it is filled by the researcher carrying out the observations by asking them questions and filling out the survey on their behalf. These observations were carried out at least 3 days a week. The researcher stays in the building throughout to observe various forms of activity and collect thermal perception at different points in time using the survey QR code or Google form link.
3.3. Experimental Design and Immersive Virtual Environment Pilot Test
The main study will use a within-subjects research design to investigate how visual changes affect thermal and visual perception during Activity 1 and Activity 2, as outlined in Figures 4 and 5, under cool, normal, and hot thermal conditions. Both Activities 1 and 2 will use 25–30 participants under different visual treatments. The clothing insulation level (Clo = 0.61) which is long sleeves and trousers will be ensured for every participant which was also ensured in the pilot study for the VR experiment.
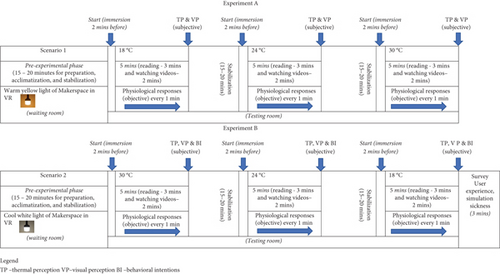
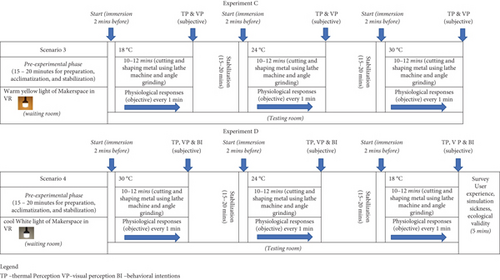
Two participants participated in the pilot study to understand the timeline of each experiment protocol and the feasibility of the test. The experiment for each participant took an hour and 10 min. The participants acclimatized to the normal environmental conditions at 22°C for 15–20 min during the pre-experimental phase before being moved to the testing room. During the experiment, the participants were asked to wear VR headsets while in a room set to a temperature of 18°C. They were then instructed to read the virtual text for 5 min. The study collected data on the participants’ thermal and visual perceptions during these thermal conditions. This process was then repeated for warmer conditions, specifically at 24°C and 30°C. This experimental design is expected to be carried out for high-intensity activity in VR which extends the existing body of knowledge in VR applications.
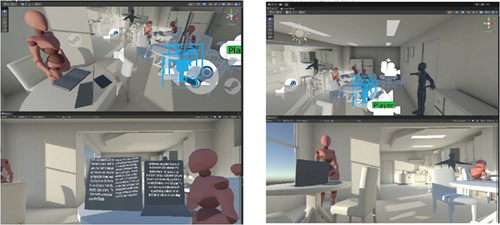
A virtual reality environment was created to test the feasibility of conducting a chamber study for a low-intensity activity such as reading. The experiment was carried out with cool white light to understand the experimental design. The immersive experience was created using a 3D model of a real environment as shown in Figures 6a,b. The main study will examine two visual scenarios: the first scenario is 3000 K (warm yellow light), and the second scenario is 6000 K (cool white light). The 3D max will be used to create the scenarios before importing them into Unity for programming various interactions and activities to be carried out in the virtual space, such as low and high-intensity activities.

4. Preliminary Findings and Discussion
A pilot study was conducted to test the research design and hypotheses on thermal comfort perception based on two activities in the Makerspace. The data was collected from respondents in the Makerspace who were performing Activities 1 and 2. The survey data was filled out by the researcher in correspondence with those carrying out machine and heavy fabrication work. The pilot study was carried out for 2 weeks, from May 8th to May 22nd. During this time, 30 responses were gathered to collect thermal perception data. A minimum sample size of 27 is required for two dependent means using G∗Power software. Out of these, 12 responses were collected from fabrication and machine work, while 18 responses were collected from reading activity. The box plot was used to analyze the pilot study and understand thermal sensations at a specific temperature. Based on the collected data, the temperature ranges during this data collection were from 17°C to 23°C to compare Activities 1 and 2. To effectively compare sensations at specific ranges, Activity 2 data were collected more at 19°C and 20°C, which was easy to compare with Activity 1. Figure 7 shows the analysis of the thermal sensations of these activities and air temperature using a box plot.
The thermal sensation votes (TSVs) range from −3 to 3 where −3 depicts cold, −2 shows cool, −1 connotes slightly cool, 0 denotes neutral, 1 denotes slightly warm, 2 denotes warm, and 3 denotes hot. At an air temperature of 19°C, for Activity 1, the upper quartile value for TSV is slightly warm (1) compared to Activity 2 which is warm (2). The median value for TSV for Activity 1 is neutral (0) while for Activity 2 it is between slightly warm and warm (1.5). This implies there is a higher thermal sensation value when users do a physical activity compared to a resting mode like reading. The lower quartile value for TSV for Activity 1 was within neutral and slightly cool (−0.5) while Activity 2 was cool (−2). The minimum value for TSV for Activity 1 is slightly cool.
For air temperature at 20°C, the upper quartile value for Activity 1 is warm (2) while for Activity 2 it is hot (3). The median value for TSV for Activity 1 and Activity 2 is slightly warm (1) and warm (2), respectively. The lower quartile values for Activities 1 and 2 are neutral (0) and slightly warm (1), respectively. This means that users tend to have higher TSVs when carrying out machine/fabrication works.
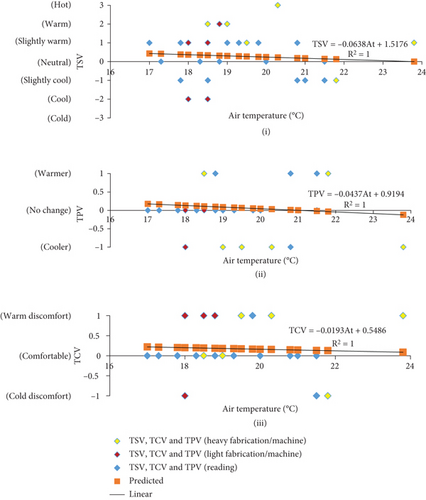
The preliminary results for thermal perception were analyzed using linear regression to determine the relationship between air temperature and TSVs, air temperature and thermal comfort votes (TCVs), and air temperature and thermal preference votes (TPVs). The linear regression equation for TSV, TPV, TCV for both activities were TSV = −0.0638At + 1.5176, TPV = −0.0437At + 0.9194 and TCV = −0.0193At + 0.5486. The linear regression equation TPV = −0.0437At + 0.9194 are shown in Figure 8a(i–iii). The At represents the air temperature for TSV, TPV, and TCV analyzed.
The result showed a slight negative relationship between those variables for Activities 1 and 2. For thermal sensation, participants working in the heavy fabrication/machine section had a higher thermal sensation compared to Activity 1 as shown in Figure 8a(i). In terms of thermal preferences, participants also revealed that they want or prefer a cooler environment when carrying out Activity 2, especially for heavy fabrication/machine work. Most participants for Activity 1 revealed that they are comfortable with the thermal environment. Based on the pilot study result, this study will focus on heavy fabrication/machine works for the main study which has higher thermal sensation compared to Activity 1.
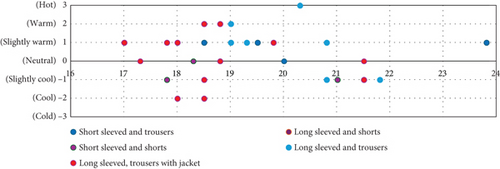
The thermal insulating values of clothing for each category of clothing level worn in the physical environment are short sleeved and shorts (0.36), short-sleeved and trousers (0.57), long-sleeved and shorts (0.50), long-sleeved and trousers (0.61), and long-sleeved and trousers with jacket (0.96) as shown in Figure 8b. At 18°C and below, users adopt the adaptive behavior of wearing jackets to improve their comfort level except for a few users who feel slightly cool because of their clothing insulation level (short sleeve and trousers). The same clothing level (long-sleeved, trousers with jacket) for low and high intensity was used to compare, and it was observed that fabrication/machine activity had a higher sensation of discomfort due to the heat generated and increased level of metabolic rates.
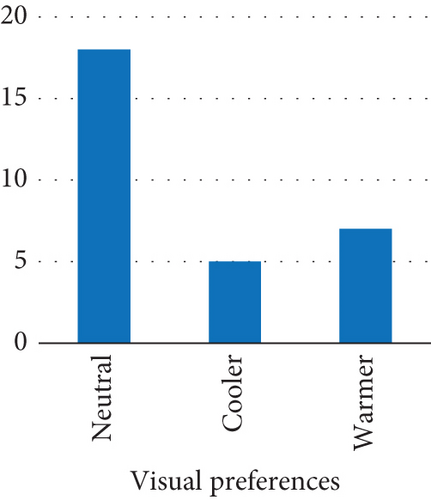
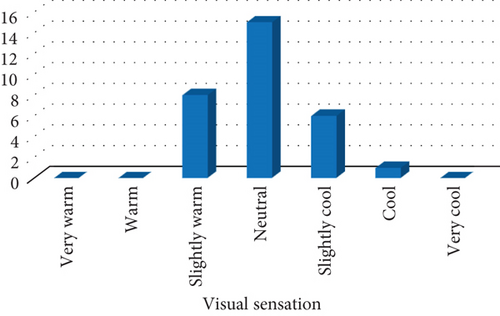
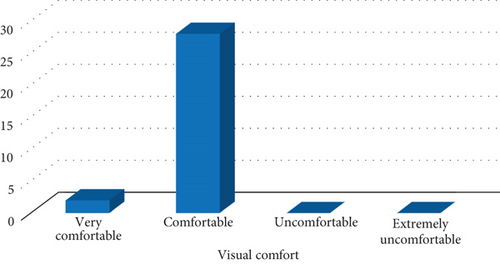
Based on the visual perception of users in the buildings as shown in Figures 9a, 9b, and 9c, 60% of the respondents are satisfied with the visual level of the buildings while 16.7% of the users prefer much cooler and 23.3% of the respondents prefer warmer visual lighting. However, for the visual sensation, 26.7% of the respondents revealed that the visual is slightly warm, and 50% of the respondents were satisfied with the visual in the environment. Twenty percent of the respondents showed that the visual sensation is slightly cool while 3% said the visual sensation is cool. For the visual comfort perception, 93% noted that they are comfortable with the visual lighting in the buildings while 6.7% of the respondents are very comfortable with the visual.
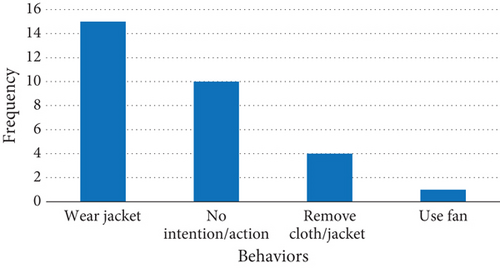
Behaviors in the Makerspace were also observed during these thermal conditions which were mostly 18°C–20°C. The most observed adaptive behavior was wearing a jacket which connotes 50% of the respondents as depicted in Figure 10. These were collected from the responses in the survey on clothing level. Of the respondents, 33.3% felt that there is no intention or action that they take in controlling thermal conditions. Thirteen percent of the respondents stated they would remove their clothes when the thermal conditions were around 23°C while 3.3% of the respondents said they would use a fan which does not have much significance Figure 6.
4.1. Pilot Study on the Feasibility of Replicating Activity 2 in VR and General Chamber Experiment
A pilot survey was conducted in Makerspace to observe the activities, tools, and machines used in fabrication and machining sections. The machining section involves the use of a lathe machine for cutting and shaping metals, chuck jaw, milling machine, cold saw, and other related tools. The fabrication section includes light fabrication tools such as hand drills, pedestal drills, G clamps, hand shear, and heavy fabrication tools mainly used for welding and cutting, which include vertical band saw, angle grinder, and electric arc welding.
Consequently, three main factors must be considered in VR-reproduced experiments which are the availability of physical world data, behavioral interest, and replicability in VR [50]. In comparing the physical world behavior to virtual scenarios, the gathered behavioral data will be used to reproduce the same scene in VR experiments. After conducting some research on what is done in Makerspace and what can be reproduced in VR, it is only possible to replicate the use of angle grinders for cutting metal sheets, electric arc welding, drilling tools, and lathe machines in VR. However, due to space limitations in the chambers, only three machines or equipment can be focused on, which are angle grinders, arc welding, and lathe machines. Table 2 presents the results of a pilot study conducted to assess the feasibility of using VR in the chamber for physiological responses and thermal comfort perception.
| Activity 1—reading | Thermal sensation | Thermal preferences | Thermal comfort | Heart rate (avg. bpm) | Behavioral intentions |
|---|---|---|---|---|---|
| Participant 1 | |||||
| 18°C | Slightly cool | Warmer | Cold discomfort | 86.5 | Wear jacket |
| 24°C | Slightly warm | No change | Comfortable | 86.5 | No intention/action |
| 30°C | Warm | Cooler | Warm discomfort | 90 | Thermostat decrease |
| Participant 2 | |||||
| 18°C | Cool | Warmer | Cold discomfort | 81 | Wear jacket |
| 24°C | Neutral | No change | Comfortable | 89.5 | Open window |
| 30°C | Hot | Cooler | Warm discomfort | 84 | Thermostat decrease |
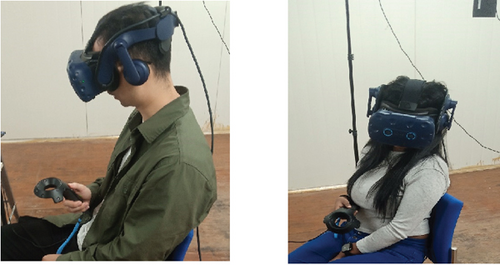
A pilot study was conducted to understand the thermal sensations, physiological responses, and behavioral intentions in those conditions. Also, the visual perception of the cool white light during each thermal condition was collected as shown in Table 3. There were differences in the visual perception during different thermal conditions which need to be further investigated in the main study which agrees with Latini et al. [45] study. However, the two participants used for the study were immersed in a different environment to assist in understanding the feasibility of the experiment as shown in Figure 7a,b. The proper experiment will immerse users into the virtual environment of Makerspace for Activities 1 and 2.
| Activity 1—reading | Visual sensation | Visual preferences | Visual comfort |
|---|---|---|---|
| Participant 1 | |||
| 18°C | Neutral | Neutral | Very comfortable |
| 24°C | Neutral | Neutral | Very comfortable |
| 30°C | Very warm | Neutral | Comfortable |
| Participant 2 | |||
| 18°C | Neutral | Neutral | Comfortable |
| 24°C | Slightly cool | Cooler | Very comfortable |
| 30°C | Neutral | Cooler | Very comfortable |
4.2. Activity and Thermal and Visual Comfort for Regulated and Unregulated Environments
Based on the observations collected in the Makerspace, the air temperature was within 17°C–22°C. At 17°C–19°C, the observation on thermal comfort falls within slightly cool, neutral, and slightly warm for low-intensity activity. However, it was noticed that those participants observed in the space had extra clothing insulation (mean clo = 0.83) as shown in Figure 9b, that is, jackets to make themselves warm in the buildings. This is consistent with [51, 52] who emphasized that clothing insulation is an important adaptive strategy to cope with dynamic thermal conditions for users and also influence their comfort.
For high-intensity activity, users were said to be slightly warm, warm, and hot during the process of carrying out those activities. This is in accordance to Goto et al. [53] who stated that individual thermal sensation tends to rise and decline after there is a change in the level of activity but a steady state of thermal sensation can take some time after activity changes. Also, this is in support of previous findings and affirmation that metabolic rate which connotes heat generated within the body due to activity is a vital factor for the thermal prediction [18, 20, 54–56].
The VR experiment that was conducted used a uniform clothing insulation level (clo = 0.61) for participants to avoid disparity in the process which made the thermal comfort perception slightly different from the observed environment. The two participants revealed slightly cool and cool, respectively. The adaptive behavior in the VR experiment at 18°C for two participants revealed wearing jackets which corresponded to the observed environment where 80% of users during these thermal conditions wore jackets. During the VR-controlled experiments, there were no adverse effects of thermal conditions or cybersickness such as shivering, sweating, and dizziness.
In the validation study carried out in previous studies in Table 1, Saeidi [34] ensured different clothing insulation of participants to be used for both real and virtual environments which were both carried out in the chamber. However, there was less correlation between the real and virtual during the 24°C test that was carried out which means the relationship is weak but there was no significant difference. Yeom et al. [40] used the same clothing insulation level; however, there was still a higher thermal sensation in IVE to the real environment. Despite Salamone et al. [41], the research did not state the clothing level of participants used and thermal conditions in a real and virtual environment. Still, according to the study, there were no significant differences between the real and IVE. Latini et al. [44] research stated there was no significant difference between groups used for real and IVE though the same clothing insulation level was ensured in both environments. This implies clothing insulation level is an important aspect that influences thermal comfort, but these studies were both carried out in climate chambers for both environments.
The male gender had a lower and higher thermal sensation at 18°C and 30°C compared to the female gender in the controlled experiment. This could be influenced by cultural and climatic background and might not apply to other users [57]. Furthermore, other thermal comfort observations carried out in the VR experiment cannot be compared to observed thermal perception because there was not enough data for 24°C and 30°C, respectively, which will be conducted in the main study. The observations in the survey were just for 2 weeks to understand variations in thermal sensations for the two physical forms of activity considered in the study.
The visual perception collected shows slight differences in the perception of different thermal conditions. This is in agreement with [45] who observed that visual perception can change during thermal conditions. Comparing the visual perception in the unregulated environment to the regulated environment for VR, the visual sensation, preferences, and comfort were neutral, neutral, and comfortable at 18°C in a regulated environment which were similar to unregulated environments. Also, the heart rate was within the proposition of Lee and Ham [2] who stated that the heart rate ranges from 70 to 100 bpm in a resting mode depending on individual characteristics.
4.3. User Experience and Cybersickness Questionnaire
User experience and simulation sickness questionnaire was sent to participants at the end of the experiment to understand the effect of VR on users and their experiences in the virtual world. The two participants were asked to rank on a 5-point Likert scale (1—very low, 2—low, 3—average, 4—high, 5—very high) of their experiences. “Feeling real in the environment” the participants chose very high and high. Participants selected they had no distractions and could concentrate during the interaction with the environment. In terms of having full control of the event, participants selected average and very high. The two participants selected high and very high for feeling involved in the environment. For the visual level of the 3D environment that participants were being immersed in, they selected high and very high. For movement and manipulation in the virtual environment, participants selected average and very high, while for easy interaction with the environment, the respondents chose high and very high. Both participants could adapt very well to the environment. For the feel of presence in the virtual environment, the participants selected high and very high.
For the simulation sickness aspect, participants noted they were not motion sick. Others include discomfort, fatigue, headache, eyestrain, difficulty in focusing, increased salivation, sweating, nausea, dizziness, blurred vision, and difficulty in concentrating. The respondents revealed that they had no issue with those listed above when using VR. This was ranked on a 4-point Likert scale (0 = not at all, 1 = mild, 2 = moderate, 3 = severe) based on the new method of quantification [58, 59]. This implies that there were no adverse effects of VR on the result of the experiment. One of the comments made by one of the participants, it was a good and new experience because it was user-friendly. Both participants also revealed they would love to interact with building systems in the virtual world to improve wellness and productivity.
5. Conclusion and Limitations
The study has explored a pilot experimental design to assess comparability between visual comfort in immersive virtual environments and thermal comfort in controlled settings under different activity intensities, while also considering unregulated environments. The pilot study has helped in determining the feasibility of experimental procedures by identifying potential challenges and areas that need refinement. It has aided in understanding how different contexts (immersive environments, controlled settings, and unregulated environments) influence visual and thermal comfort which provides broader applicability and generalizability of findings.
This study discusses previous experimental designs for thermal and visual comfort observations and assessment. It revealed some inadequacies in previous studies where some information was not detailed and few studies did not explain their experimental design. Furthermore, it also discussed the proposed conceptual model for the main research and this has aided in understanding the conceptual framework and theoretical underpinnings of the research. The pilot study offers insights by integrating knowledge from environmental psychology, human–computer interaction, and thermal comfort research. This has helped to contribute to the comprehensive theoretical understanding of comfort for different activity intensities.
The thermal comfort observations carried out in the physical environment, that is, unregulated environments, revealed a higher sensation for high-intensity activity of 1.5 compared to low-intensity activity. The thermal perception in an unregulated environment was slightly different in a controlled environment due to the adaptive behavior of users in an unregulated environment. This led to users feeling comfortable compared to the controlled environment which was cold discomfort. The VR chamber experiment aided in understanding thermal and visual comfort, adaptive behaviors, and its feasibility. It found that there were similar visual perceptions of unregulated and regulated environments. Also, visual perceptions could be altered during different thermal conditions and similar adaptive behaviors were experienced in both environments, that is, wearing jackets to feel comfortable.
Despite the findings revealed in the pilot study, there are some limitations observed to improve the main study. There is a need to increase the 7-point thermal sensation based on ASHRAE 55 standards to 9 points for the survey. This has been implemented in the main study. Clothing insulation is a vital element that influences the thermal perception of users in the building. Clothing insulation will be used to understand how these influence thermal comfort in the observed environments by getting average clothing levels for each temperature range to better compare with VR experiments where the same clothing insulation will be ensured.
The main study will focus on heavy fabrication/machine works revealing a higher thermal sensation whereas light fabrication had a similar thermal sensation like low-intensity activities in an unregulated environment. Also, in the VR pilot study, it was speculated that a few rays of natural or day lighting might have affected the artificial lighting which may have influenced the visual perception of users. The primary study will eliminate all-natural lighting focusing only on artificial lighting where the daylight setting (Skybox) will be fixed at night to avoid circadian rhythms.
Disclosure
A preprint has previously been published [SSRN 4689004].
Conflicts of Interest
The authors declare no conflicts of interest.
Author Contributions
Victor Adetunji Arowoiya: conceptualization, formal analysis, resources, methodology, software, visualization, resources, writing–original draft, writing–review and editing. Robert Christian Moehler: supervision, resources, writing–review and editing. Yihai Fang: supervision, reviewing, editing.
Funding
This work was supported by Monash University, Australia (MGS and MITS), for the PhD research.
Acknowledgments
We would like to thank Victor Gan (Research Assistant) and Dr. Jenny Zhou for their contributions to data collection.
Open Research
Data Availability Statement
Data will be made available on request.


