Quantifying Indoor Air Quality Determinants in Green-Certified Buildings Using a Hybrid Machine Learning Method: A Case Study in Florida
Abstract
This study investigates the indoor air quality (IAQ) conditions in green-certified buildings and examines the factors influencing them. An integrated IoT sensing system was implemented indoors and outdoors to assess the levels of particulate matter, nitrogen dioxide, and ozone at five Leadership in Energy and Environmental Design (LEED)-certified and five non-LEED educational buildings in Central Florida. Building-related characteristics were collected through walk-through surveys, BACnet systems, and construction drawings. An algorithm model based on support vector machine (SVM) and nonnegative matrix factorization (NMF) was developed to analyze the features of pollutants and the relative contribution of different influencing factors. The findings reveal that concentrations of target pollutants are generally lower in LEED buildings compared to non-LEED buildings. Although IAQ influencing factors are generally similar between LEED and non-LEED buildings, the weighted contribution ratios of specific factors, particularly for indoor nitrogen dioxide and ozone, vary significantly. The concentration of pollutants in non-LEED buildings is more susceptible to adverse environmental factors. The SVM-NMF model demonstrates significant advantages in nonlinear feature extraction and handling multicollinearity issues. It surpasses multiple linear regression and backpropagation neural network models in analyzing multidimensional indoor air data by 26.9% and 18% (p < 0.001), respectively. The robustness of the model was validated through fit comparison, cross-validation, and residual analysis. This study provides a foundational information base and effective technical means for subsequent research on IAQ management.
1. Introduction
Poor indoor air quality (IAQ) was attributed to an estimated 25% of global deaths before the COVID-19 pandemic [1]. Both long-term and short-term exposure to indoor air pollution may lead to the prevalence of sick-building syndrome (SBS) and building-related illness (BRI) [2]. There is an increased emphasis on reducing air pollution in the built environment to ensure occupant health and well-being [3]. Leadership in Energy and Environmental Design (LEED), developed by the US Green Building Council (USGBC), is one of the most preeminent green and healthy building certification systems. As of 2024, there are more than 197,000 projects certified LEED in 186 countries [4]. There are four levels of LEED certification based on total score points (pts) earned across nine categories, including certified (40–49 pts), silver (50–59 pts), gold (60–79 pts), and platinum (> 80 pts). However, few studies concluded that LEED buildings had higher energy and water consumption during their operation and maintenance phases than non-LEED buildings [5, 6]. Hence, research should also be undertaken to investigate if LEED buildings can guarantee better IAQ. An effective way is to conduct real-time monitoring and field surveys.
The LEED-IEQ category accounted for the second-largest proportion of the total available pts since LEED BD + C Version 2.0 (Building Design and Construction). The IAQ-related credits consist of 65% of the total pts of the IEQ category in versions 2 and 3 (61% in version 4) [7]. To date, the IAQ-related credits in the latest version of LEED BD + C (V4) include enhanced IAQ strategies (2 pts), low-emitting materials (3 pts), IAQ management plan (1 pts), IAQ assessment (2 pts), in addition to two prerequisites: minimum IAQ performance and tobacco smoke control. Some studies showed that overall IEQ performance was higher in LEED-certified buildings than in non-LEED buildings [7–9]. However, Gou et al. [10] reported no significant differences in most of the IEQ parameters between LEED and non-LEED buildings. Schiavon and Altomonte [11] and Altomonte and Schiavon [7] found that the IAQ performance of LEED-certified buildings was not always higher than non-LEED buildings. Comparative studies on the IAQ differences within and between LEED and non-LEED educational buildings are not often explicitly detailed.
Particulate matter (PM2.5 and PM10), ozone (O3), nitrogen dioxide (NO2), sulfur dioxide (SO2), and carbon monoxide (CO) are the most common indoor pollutants documented by both the US EPA and the World Health Organization (WHO) [12]. Indoor PM2.5 and PM10 are mainly generated from mineral dust, fuel, gasoline combustion, or secondary particles in the atmosphere. Fossil fuels and photochemical reactions can form indoor gaseous pollutants such as O3 and NO2. Besides, anthropogenic activities and occupancy can also affect the concentrations of these pollutants [13]. Many organizations offer health benchmarks for IAQ, such as the US EPA, WHO, ANSI/ASHRAE, OSHA, NAAQS, and ACGIH. Abdul-Wahab et al. [14] and Zhang et al. [15] conducted systematic reviews of these standards and analyzed their priorities and limitations. Meeting the minimum IAQ performance of ASHRAE 62.1 standards is one of the prerequisites (Eqp1.) required by the LEED V4–indoor environmental quality (IEQ) category. The current ASHRAE 62.1 (2022) suggested primary levels of PM2.5 (annual mean: 12 μg/m3), PM10 (24-h mean: 150 μg/m3); NO2 (annual mean: 53 ppb), and O3 (8-h: 70 ppb) [12, 16].
Langer et al. [17] applied multiple linear regression (MLR) modeling to identify the factors influencing indoor volatile organic compounds (VOCs), four aldehydes, and particulate matter in French dwellings based on various building characteristics. A similar MLR model was used by Tang et al. [18], Das et al. [19], Zhang et al. [20], and Kiurski et al. [21]. The nonnegative matrix factorization (NMF)–based approach is a demonstrated dimensionality reduction technique that decomposes multivariate data by creating a representation of the original data [22]. While NMF is good for feature reduction and interpretation, it is not a predictive model on its own. It is also limited in initialization sensitivity, on-convex optimization (local minima), and nonnegativity data requirements when used alone [23]. Recent research has also seen a shift towards more advanced machine learning-driven regression techniques. Techniques such as random forest regression (RFR) and support vector machine (SVM) have been employed by Ravindra et al. [24] and Liu et al. [25] to capture complex nonlinear associations in IAQ data. SVM excels in pattern recognition and classification within high-dimensional spaces, but is limited in linearity, feature interpretation, and scalability when used individually [26–28]. Other novel approaches include the use of artificial neural network (ANN)–based regression, such as auto regression integrated moving average negative matrix factorization (ARIMA), as demonstrated by Gourav et al. [29], Cho et al. [30], and Spyrou et al. [31], which can model intricate dynamics of associations within time-series IAQ data. Nevertheless, these advanced techniques often present challenges related to overfitting, interpretability, and computational demand. Therefore, the selection of an appropriate IAQ analysis technique should be guided by the specific features and characteristics of the data.
This study explores and compares the factors influencing IAQ in LEED-certified and non-LEED-certified educational buildings using an SVM-NMF-based approach. Indoor and outdoor PM2.5, NO2, O3, temperature, and humidity were monitored during the summer season within 10 unique case study buildings, including classrooms and offices. These diverse case study buildings have been selected to underline the differences in building use, operation, design, and ventilation strategies.
2. Materials and Methods
2.1. Studied Buildings
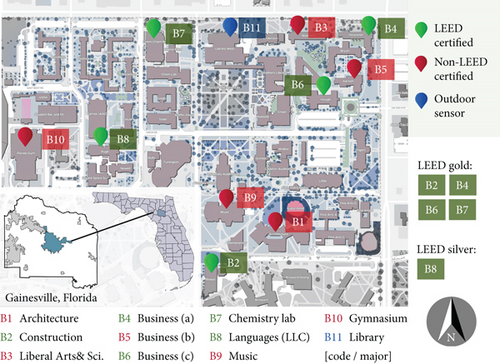
After receiving approval from the institutional review board (IRB) (No. 202003000) and the University of Florida (UF) ethics committee, this study was conducted in the main UF campus area from May 2021 to August 2021. The University is in a warm-humid climatic zone in North–Central Florida. Ten educational buildings (B1-10) were chosen as case studies, with an additional library building (B11) included for outdoor environmental data collection (Figure 1). The median distance between the case buildings and the campus center was 923 ft, ranging from 717 ft to 1359 ft. Among these cases, five buildings (B2, B4, B6, B7, and B8) are LEED-certified and five are non-LEED-certified (B2, B3, B5, B9, and B10). Buildings B1, B4, B6, and B7 have each achieved LEED-gold certification with scores of 39/69 (V2.0), 62/110 (V3.0), 45/69 (V2.2), and 72/110 (V3.0) pts, respectively. B8 obtained LEED-Silver certification with a score of 36/69 (V2.0) in 2009. In 2004, B2 became the first LEED-gold certified building in the state of Florida, distinguished for its complete utilization of low-VOC materials in interior construction. B7 achieved the highest LEED-IEQ score (11/15) among the LEED buildings. All included buildings were nearly unoccupied during the investigation due to the COVID-19 pandemic and the summer break. One classroom and one office per building were used for indoor environment monitoring and evaluation. After several walkthrough inspections, existing building conditions, such as wall-ceiling cracks, interior materials, space layouts, and outdoor surroundings, were recorded. Besides, numeric building-related parameters were obtained from construction and mechanical drawings provided by the UF business affairs team. The main building characteristics are organized in Table 1.
| Parameter | Building number | |||||||||
|---|---|---|---|---|---|---|---|---|---|---|
| B1 | B2 | B3 | B4 | B5 | B6 | B7 | B8 | B9 | B10 | |
| Build. gross area (sq. ft) | 114,146 | 48,096 | 60,156 | 57,000 | 44,630 | 72,140 | 111,552 | 45,690 | 73,057 | 163,492 |
| LEED total points | 39 | / | / | 62 | / | 45 | 72 | 36 | / | / |
| LEED IEQ points | Not available | / | / | 8/15 | / | 8/15 | 11/15 | 10/15 | / | / |
| LEED version | / | NC-V2.0 | / | NC-V3.0 | / | NC-V2.2 | NC-V3.0 | NC-V2.2 | / | / |
| Total tested room volume (cu.ft) | 13,068 | 20,030 | 8423 | 22,371 | 10,365 | 28,506 | 7268 | 13,408 | 19,113 | 5,006 |
| Win/wall ratio | 0.35 | 0.15 | 0.28 | 0.08 | 0.04 | 0.13 | 0.03 | 0.19 | 0.00 | 0.81 |
| DBS (ft) | 670 | 1187 | 112 | 60 | 140 | 316 | 12 | 895.5 | 976 | 625 |
| Wall, ceiling, and flooring | Conc. PCW carpet | PCW carpet MFT | Wood carpet MFT PCW | Wood carpet MFT PCW | Wood carpet MFT PCW | PCW carpet MFT | PCW carpet MFT | Wood carpet MFT PCW | CT carpet MFT PCW | Wood carpet MFT PCW |
| Total room cracks occur | 1 | 2 | 2 | 3 | 5 | 3 | 2 | 4 | 7 | 5 |
| ASA (cfm) | 172 | 170 | 709 | 941 | 203 | 490 | 129 | 492 | 614 | 64 |
| AFS (cfm) | 85 | 150 | 821 | 1295 | 207 | 459 | 146 | 494 | 612 | 229 |
| ZTS (deg. F) | 74 | 73.27 | 74 | 74.35 | 74 | 73.45 | 70 | 72.5 | 72 | 74 |
| Total no. SAG | 8 | 14 | 9 | 10 | 20 | 16 | 3 | 16 | 1 | 7 |
| Total no. RAG | 1 | 6 | 3 | 1 | 6 | 3 | 4 | 6 | 3 | 2 |
| SAG area (sq.ft) | 15.5 | 14.6 | 47.85 | 40 | 80 | 32 | 12 | 52 | 1 | 28 |
| RAG area (sq.ft) | 3 | 5.8 | 8.33 | 3 | 23.2 | 11.2 | 16 | 17 | 20.8 | 3.45 |
- Abbreviations: ASA, average supply airflow; DBS, distance between street; FP, fiber panel; IEQ, indoor environmental quality; LPW, lead-paint wall; MFT, mineral fiber tiles; NC, new construction; OPW, oil-paint wall; RAG, return air grille; RAG, return air grille; SAG, supply air grille; SAG, supply air grille; VA, variable air volume systems; VCT, vinyl compositing tile; ZTS, zone temperature setpoint.
2.2. Building Ventilation System
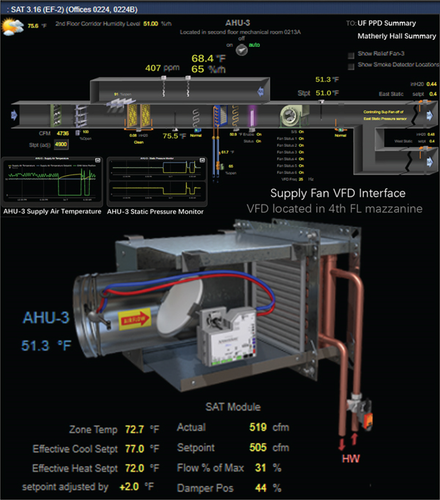
All studied buildings are operated by auto-controlled HVAC systems year-round to improve indoor thermal comfort and save energy. In addition, all windows remain closed throughout the entire year. Building automation and control network (BACnet)–based techniques are used to access the variable air volume (VAV) database and direct digital control (DDC). The implemented BACnet in cases B1, B2, B4, B9, and B10 is the Johnson Control Metasys, while B3, B5, and B6 use the automated logic WebCTRL (Figure 2). The Siemens APOGEE serves B7 and B8. The distinction between these techniques often hinges on building size scalability, existing HVAC equipment compatibility, and remote monitoring capabilities. For instance, carbon dioxide data are only available in B4, B6, and B7 due to the installation of relevant sensor modules within the return air duct and mixed air plenums of these buildings. BACnet-based dehumidification control is accessible in buildings B5, B8, and B10. Even following the same BACnet protocol, each building has distinct airflow, thermostats, and predefined schedule settings adapted to the individual requirements of demand control. All case buildings have incorporated HEPA filters with a MERV-13 rating level in accordance with the ANSI/ASHRAE 62.1 [32]. Activated carbon filters are not used or mandated in any of the studied buildings, leaving the prevention of gaseous pollution unclear.
2.3. Indoor and Outdoor Measuring
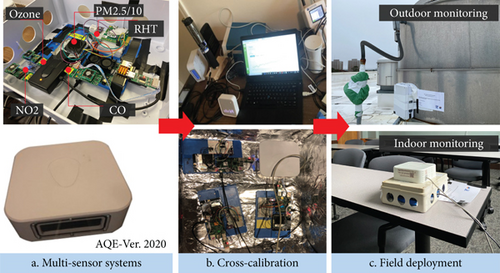
Data regarding indoor and outdoor PM2.5, NO2, O3, temperature, and humidity were measured from the South Coast Air Quality Management District (SCAQMD) evaluated monitor (AQE-V2.0) and self-built low-cost sensor device at each case building (Figure 3). Both devices are equipped with the same sensor setup and kept in weather-proofed boxes. For PM2.5 concentration, the laser-scattering sensor modules PMS5003 by Plantower and SDS011 by Nova Fitness were used [15]. NO2 and O3 concentrations were measured using electrochemical sensors produced by Interlink Electronics (NO2: DGS-968-043 and O3: DGS-968-042). The selection of these devices was based on their availability in the commercial market, prefactory calibration, reliable data repeatability (≤ ± 15%), easy data accessibility, and cost-effectiveness in terms of purchase and operation. The WHO IAQ monitoring protocol and European IAQ observatory guidelines were followed to minimize measurement uncertainty [33, 34]. Detailed sensor specifications and deployments can refer to the previous studies [35]. In brief, continuous measurements were conducted in one classroom and one office per building for a total duration of 7 days, with data recorded at 10-min intervals and hourly averaged. The position of IAQ sensors was maintained at a minimum gap of a meter (3.28 ft) from any obstacles. The outdoor monitor was securely affixed on the rooftop of Building B11 and was equipped with water and electricity protection measures.
2.4. SVM-Based NMF Modeling
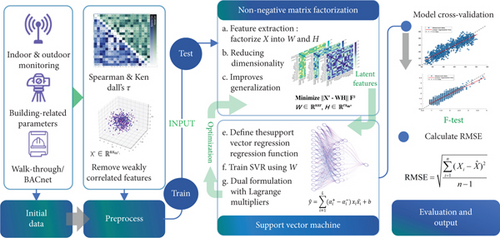
SVM is designed to simplify the complexity of the model by evaluating correlated variables, while NMF is utilized to augment the SVM by extracting features and reducing dimensionality, thereby enhancing the SVM’s performance in pattern recognition and classification tasks [40]. NMF is a highly effective statistical approach for pattern recognition by revealing constituent features in datasets. The concept of the approach lies in breaking down a data matrix into a select number of distinct patterns, known as NMF factors, along with their corresponding weights [41] . By reassembling these factors using their respective weights, one can closely reconstruct the original data through positive contributions. This process results in a condensed, lower-dimensional form of substantial datasets. Restricted by the nonnegativity of the raw data matrix X ∈ Rn×m as well as the arising NMF factors W ∈ Rn×R and their corresponding weights H ∈ RR×m, the NMF factorization X ≈ WH (wi,a ≥ 0, hb,j ≥ 0, i = 1, ⋯, n, j = 1, ⋯, m, a, b = 1, ⋯, r) is approximate, since for r holds r < <min(n, m). To validate the performance of the SVM-NMF models, we computed unbiased root mean square error (RMSE) between simulated and measured data. The schematic structure of the model is shown in Figure 4.
3. Results and Discussion
3.1. Indoor and Outdoor Measurements
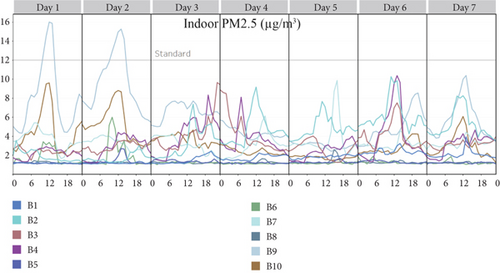
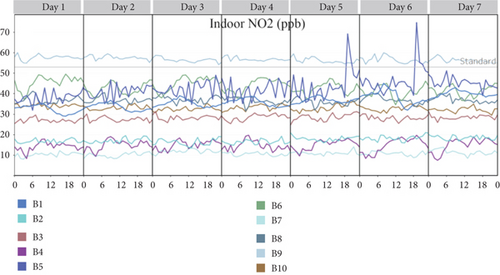
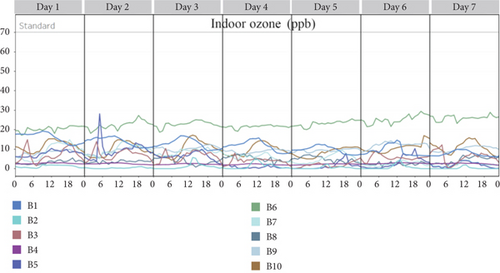
Regardless of LEED certification, all investigated buildings displayed temperature and humidity within the conventional range for typical buildings present in the warm-humid climatic zone in North–Central Florida (average temperature; humidity for LEED and non-LEED sites: 73.9°F; 50.6% and 75.7°F; 53%). The HVAC system across the campus appears to be consistent in successfully maintaining the optimal occupant conditions. Due to well-conditioned spaces and adequate ventilation, the overall indoor pollutant concentrations observed were low compared to outdoor readings, while being below the ASHRAE 62.1 recommended limits (PM2.5: 12 μg/m3; NO2: 53 ppb; O3: 70 ppb) in most cases. The NO2 value measured at Building 9 (56.77 ppb) is beyond the acceptable limit by a close margin (Figure 5). While all investigated buildings had incorporated MERV-13 HEPA filters, a 16.56% decrease in mean PM2.5 concentration was observed in LEED-certified buildings (2.62 μg/m3) compared to non-LEED sites (3.14 μg/m3). This could be attributed to sustainable construction practices in LEED buildings, such as utilizing low-VOC materials in interior construction [42]. The difference between mean NO2 concentration for LEED and non-LEED buildings was considerable (LEED: 24.59 ppb and non-LEED: 39.34 ppb), whereas the difference in mean O3 values was negligible (LEED: 7.26 ppb and non-LEED: 8.2 ppb). B9 (non-LEED) recorded the highest mean NO2 value at 56.77 ppb, while the three lowest concentrations were measured in sites B7, B4, and B2 (10.85 ppb, 14.78 ppb, and 17.40 ppb), which were all LEED certified. A total of seven rooms had cracks in them for B9, which was the highest among all case sites. This could be a potential reason for the increased NO2 value. Table 2 represents the mean hourly indoor pollutant concentrations for PM2.5, NO2, and O3 for all 10 buildings across a 7-day timespan.
| PM2.5 | NO2 | Ozone | Temperature | Humidity | I/O ratio | |
|---|---|---|---|---|---|---|
| B1_in | 1.70 ± 0.51 | 36.00 ± 3.17 | 11.49 ± 3.56 | 74.03 ± 0.26 | 51.59 ± 0.63 | 0.35 |
| B2_in | 3.97 ± 2.05 | 17.40 ± 1.47 | 0.72 ± 1.08 | 77.31 ± 0.66 | 49.30 ± 2.09 | 0.15 |
| B1(2)_out | 11.51 ± 3.10 | 77.26 ± 57.63 | 232.71 ± 217.72 | 83.12 ± 9.42 | 54.03 ± 15.57 | / |
| B3_in | 3.38 ± 1.44 | 28.09 ± 1.37 | 5.32 ± 2.96 | 78.53 ± 1.73 | 45.97 ± 1.84 | 0.28 |
| B4_in | 3.20 ± 1.65 | 14.78 ± 2.63 | 2.43 ± 0.33 | 73.04 ± 1.16 | 45.29 ± 1.24 | 0.08 |
| B3(4) _out | 8.95 ± 2.28 | 89.72 ± 46.39 | 88.03 ± 131.84 | 80.60 ± 7.01 | 79.92 ± 14.68 | / |
| B5_in | 1.28 ± 0.20 | 42.79 ± 5.52 | 4.36 ± 4.03 | 73.77 ± 0.53 | 55.31 ± 1.36 | 0.04 |
| B6_in | 1.38 ± 0.69 | 43.16 ± 3.36 | 23.09 ± 2.43 | 72.34 ± 0.89 | 55.41 ± 2.00 | 0.13 |
| B5(6) _out | 9.07 ± 2.30 | 97.88 ± 60.06 | 90.65 ± 132.19 | 80.54 ± 6.95 | 80.41 ± 14.23 | |
| B7_in | 3.32 ± 1.04 | 10.85 ± 1.15 | 6.08 ± 3.56 | 72.55 ± 0.30 | 46.29 ± 0.46 | 0.03 |
| B8_in | 1.25 ± 0.16 | 36.78 ± 1.68 | 3.96 ± 1.61 | 74.29 ± 0.78 | 56.75 ± 2.80 | 0.19 |
| B7(8) _out | 9.46 ± 2.21 | 100.34 ± 59.98 | 90.68 ± 132.16 | 85.57 ± 8.10 | 69.61 ± 15.71 | / |
| B9_in | 6.04 ± 2.91 | 56.77 ± 1.30 | 9.74 ± 1.71 | 77.51 ± 0.67 | 55.52 ± 0.61 | 0.00 |
| B10_in | 3.32 ± 1.68 | 33.03 ± 1.36 | 10.11 ± 3.13 | 74.88 ± 0.40 | 56.73 ± 0.54 | 0.81 |
| B9(10) _out | 12.40 ± 5.76 | 78.46 ± 19.53 | 165.61 ± 165.13 | 83.65 ± 8.43 | 78.61 ± 14.50 | / |
The highest value of mean PM2.5 measured in a LEED-certified building was at B2 (3.97 μg/m3). Although B8 is the only LEED Silver-certified building in our list of case studies, it recorded the lowest mean PM2.5 value at 1.25 μg/m3. A potential reason for this could be the effectiveness of ventilation at Site 8, as it has one of the highest numbers of supply and return air grilles at 16 and 6, respectively. This amounts to one supply grille per 838 cu. ft and one return grille per 2235 cu. ft of occupied space. B6 contains windows accounting for a more significant proportion of the wall area compared to other LEED buildings (win/wall ratio: 0.13) while also possessing three rooms with cracks in them, which is above the average no. of rooms with cracks across all LEED buildings (2.8). Improperly closed windows can result in increased exposure to outside traffic, while wall cracks can act as pathways for outdoor pollutant sources to penetrate the building [35, 43]. These reasons could be why Building 6 recorded the highest NO2 concentration at 43.16 ppb. Accordingly, B7, with the lowest win/wall ratio of 0.03, measured the lowest mean NO2 value at 10.85 ppb. The lowest mean O3 was registered at building 2 (0.72 ppb), while the highest was at Building 6 (23.09 ppb).
The lowest mean PM2.5 was measured at B5 (1.28 μg/m3). Although the mean PM2.5 value from Building 9 was well below the ASHRAE 62.1 recommended limit of 12 μg/m3 (6.04 μg/m3), this was the highest data point among all 10 test buildings irrespective of LEED certifications. Similarly, these reasons could potentially contribute to B9 possessing the highest mean NO2 value of 56.77 ppb, which is 7.11% more than the ASHRAE 62.1 recommended limit (53 ppb). This was the only instance where the measured mean pollutant concentration exceeded the acceptable standard value. Among the non-LEED certified buildings, B1 has the highest win/wall ratio (0.35) while being the second highest volume in the test room (13,068 cu.ft) and the second lowest average supply airflow (172 cfm) with respect to gross building area. Although ground-level O3 is difficult to identify and categorize based on its sources owing to the complexity of reactions involved in its generation (O3 can form as a byproduct of reactions involving NOx and TVOCs, among others), a reasonable assumption would be that the aforementioned factors could result in Building 1 possessing the highest recorded mean O3 value at 11.49 ppb. B5 recorded the lowest mean O3 concentration at 4.36 ppb.
3.2. Correlation Analysis
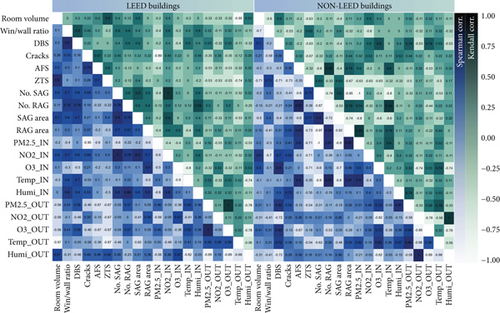
Figure 6 displays the Spearman and Kendall correlation coefficient heatmap for both LEED and non-LEED buildings. The color intensity and sign indicate the strength and direction of the correlation: values close to +1 suggest a strong positive association, values close to −1 indicate a strong negative association, and values near 0 imply little to no monotonic relationship. The indoor NO2 measurements for LEED buildings correlated the highest with the supply air grille area (RSCC = 0.9; RKTC = 0.8). A potential reason for this could be that the air handling unit was operated in air-side economizer mode, where unconditioned outside air is leveraged to complement mechanical cooling. This can introduce NO2 from roadside vehicular emissions into the conditioned space, thereby increasing mean NO2 concentrations [44]. Indoor O3 exhibited the strongest positive correlation with return air grille area (RSCC = 0.8; RKTC = 0.6), while its relationship with indoor temperature was the strongest negative correlation (RSCC = −0.9; RKTC = −0.8) across all LEED buildings. Although source apportionment for ground-level O3 is complex, these derived relationships could be attributed to outdoor chemical reactions between NOx and TVOCs from fuel combustion that penetrate the building interior via mixed air plenums [45]. The need for higher indoor temperature results in increased airflow within the system, both at the supply and return side, which may explain the increased O3 concentrations correlating to lower indoor temperature (increased conditioning efforts for a warm/humid location like North-Central Florida). PM2.5 portrayed stronger correlations with a number of return air grilles (RSCC = 0.87; RKTC = 0.74), return air grille area (RSCC = 0.97; RKTC = 0.95), and airflow setpoint (AFS) (RSCC = 0.8; RKTC = 0.6) across all non-LEED buildings. This could be due to how the test space was conditioned, exhausting indoor air at frequent intervals, thereby highlighting the importance of efficient ventilation strategies in limiting particulate concentration. The observation that PM2.5 displayed the strongest negative correlation with a number of supply air grilles (RSCC = −1; RKTC = −1) and the area of supply air grilles (RSCC = −0.9; RKTC = −0.8) further ascertains this hypothesis. For all non-LEED buildings, the distance between test sites and the main street showcased the highest positive correlation with indoor O3 (RSCC = 0.9; RKTC = 0.8) and the second highest with indoor NO2 (RSCC = 0.7; RKTC = 0.6), behind room volume (RSCC = 0.8; RKTC = 0.6). For LEED buildings, the correlations between PM2.5_in and NO2_in, NO2_out, ZTS, DBS; NO2_in and PM2.5_out, NO2_out, O3_out; and O3_in and Room_volume, SAG_Area have found insignificant. Similarly, for non-LEED buildings, insignificant correlations have been identified between PM2.5_in and NO2_in, NO2_out; NO2_in = No. SAG; O3_in = win-to-wall ratio, ZTS. Indoor PM2.5 shows a very weak correlation with indoor gaseous pollutants (NO2, O3) in both types of buildings. The primary underlying factors for this weak or noncorrelation could be that PM2.5 and gaseous pollutants have distinct sources and varying temporal patterns, meaning they are not always emitted together in the same quantities, leading to weak or no correlation. Additionally, PM2.5 may remain trapped indoors for longer periods, especially in environments with poor ventilation, resulting in higher concentrations compared to gaseous pollutants. Consequently, these correlation pairs will be eliminated from the next phase of computation to enhance the efficiency of the modeling process.
3.3. SVM-NMF–Based Evaluation
A nonlinear model leveraging SVM-NMF was developed to examine correlated factors and quantify the relative impact of principal determinants on target indoor air pollutant levels in LEED-certified and non-LEED buildings. In the iterative optimization algorithm applied within SVM, a learning rate of 0.1 is employed to adjust the weights of the model, while a high regularization parameter of C = 100 is set to prioritize the correct classification of training data over maximizing the margin. SVM, as a nonlinear classifier, effectively captures complex relationships between input features and pollutant levels, but its interpretability is limited due to the high-dimensional nature of the data. NMF addresses this by reducing dimensionality and extracting interpretable latent features, improving both model efficiency and prediction accuracy. By decomposing the nonnegative data matrix into two lower-dimensional matrices with a reduced rank of 5 (determined through cross-validation), NMF reveals latent patterns that correspond to key pollutant determinants, facilitating the identification of dominant sources or processes. Table 3 presents the comparative results derived from SVM-NMF–based models for target indoor pollutants. The statistical significance of these findings was established using T-tests, where the adjusted p values were found to be under the 0.05 benchmark.
| Variables | PM2.5 | NO2 | O3 | |||
|---|---|---|---|---|---|---|
| LEED | Non-LEED | LEED | Non-LEED | LEED | Non-LEED | |
| Room volume | 0.01 (1.01%) | 0.01 (1.08%) | n.s | 0.02 (1.72%) | / | 0.01 (0.64%) |
| Win/wall ratio | n.s | n.s | n.s | n.s | n.s | / |
| DBS | / | −0.02 (2.15%) | n.s | n.s | −0.04 (1.35%) | −0.04 (2.56%) |
| Cracks occur | 0.1 (10.10%) | 0.13 (13.98%) | n.s | n.s | n.s | n.s |
| ASA | −0.02 (2.02%) | −0.02 (2.15%) | 0.19 (12.34%) | −0.17 (14.66%) | −0.02 (0.67%) | −0.05 (3.21%) |
| AFS | 0.01 (1.01%) | 0.02 (2.15%) | −0.14 (9.09%) | 0.13 (11.21%) | −0.03 (1.01%) | 0.05 (3.21%) |
| ZTS | / | n.s | −0.32 (20.78%) | −0.03 (2.59%) | n.s | / |
| No.SAG | 0.02 (2.02%) | 0.03 (3.23%) | n.s | / | 1.25 (42.09%) | n.s |
| No.RAG | 0.02 (2.02%) | 0.01 (1.08%) | n.s | 0.02 (1.72%) | n.s | n.s |
| SAG area | −0.12 (12.12%) | n.s | 0.04 (2.6%) | 0.01 (0.86%) | / | 0.02 (1.28%) |
| RAG area | n.s | n.s | 0.05 (3.25%) | 0.02 (1.72%) | n.s | 0.03 (1.92%) |
| PM2.5_IN | n.s | n.s | n.s | n.s | 0.09 (3.03%) | 0.09 (5.77%) |
| NO2_IN | n.s | n.s | n.s | n.s | −0.13 (4.38%) | −0.07 (4.49%) |
| O3_IN | 0.05 (5.05%) | 0.02 (2.15%) | −0.13 (8.44%) | −0.07 (6.03%) | n.s | n.s |
| Temp_IN | −0.12 (12.12%) | −0.19 (20.43%) | −0.05 (3.25%) | 0.41 (35.34%) | 0.7 (23.57%) | −0.45 (28.85%) |
| Humi_IN | 0.11 (11.11%) | 0.08 (8.6%) | 0.54 (35.06%) | −0.25 (21.55%) | 0.38 (12.79%) | 0.37 (23.72%) |
| PM2.5_OUT | 0.26 (26.26%) | 0.32 (34.41%) | n.s | / | −0.09 (3.03%) | −0.03 (1.92%) |
| NO2_OUT | n.s | n.s | n.s | / | 0.01 (0.34%) | −0.01 (0.64%) |
| O3_OUT | −0.01 (1.01%) | 0.01 (1.08%) | n.s | / | −0.01 (0.34%) | 0.01 (0.64%) |
| Temp_OUT | 0.1 (10.1%) | −0.03 (3.23%) | −0.03 (1.95%) | 0.01 (0.86%) | −0.11 (3.7%) | −0.22 (14.1%) |
| Humi_OUT | 0.01 (1.01%) | −0.03 (3.23%) | −0.04 (2.6%) | 0.01 (0.86%) | −0.1 (3.37%) | −0.1 (6.41%) |
- Note: p < 0.05.
- Abbreviation: n.s. = not significant.
The results reveal that while the factors influencing the monitored concentrations of air pollutants are generally consistent between LEED-certified and non-LEED-certified buildings, the impact of each factor on the levels of different pollutants varies. This variation is particularly significant for inorganic pollutants like NO2 and O3, where the proportionate contribution of each factor to these pollutants’ concentrations is distinct between buildings with and without LEED certification.
3.3.1. Factors Influencing Indoor PM2.5 Levels
In LEED-certified buildings, the main factors influencing indoor PM2.5 concentration levels are, in descending order of impact, outdoor PM2.5 concentration (26.26%), the area of air supply vents (12.12%), indoor temperature (12.12%), indoor humidity (11.11%), and the number of damaged areas on the walls (10.10%). These factors influence PM2.5 concentrations through both direct and indirect mechanisms. For instance, outdoor PM2.5 concentrations have the most substantial effect because of the high likelihood of infiltration through openings in the building envelope, such as windows and air supply vents. The greater the area of air supply vents, the higher the volume of air circulating within the building, which can facilitate the movement of particles indoors, especially when coupled with inefficient filtration [1]. The temperature and humidity indoors can influence the size and behavior of PM2.5 particles, with higher temperatures potentially increasing the volatility of particle-bound compounds and humidity affecting particle agglomeration [46]. For example, under high humidity, PM2.5 particles can absorb water and grow in size, altering their deposition rates on surfaces.
Conversely, while the hierarchy of contributing factors in non-LEED-certified buildings is similar, the concentration of outdoor PM2.5 has a more pronounced effect on indoor PM2.5 levels, being 8.15% greater than that observed in LEED buildings. LEED V4 has specific credits that address the building envelope’s performance, including enhanced air barrier systems that must pass a whole-building air leakage test (ASTM E779, ASTM E1827, and ASTM E779) [47]. Without such stringent requirements, non-LEED buildings may have higher air infiltration rates, which can lead to a more significant transfer of outdoor PM2.5 into the indoor environment. Additionally, the lack of mandatory high-performance filtration (such as MERV 13 or higher as required in some LEED credits) in HVAC systems of non-LEED buildings can result in less effective removal of PM2.5 from incoming outdoor air. Additionally, the sensitivity of indoor PM2.5 concentrations to indoor humidity is 8.31% higher in non-LEED buildings when compared to LEED buildings. Humidity can affect the agglomeration and deposition rates of PM2.5 particles. LEED V4 includes credits for IAQ assessment and management (such as EQ credit: IAQ assessment), which require the monitoring and control of indoor humidity levels within certain limits (typically 30%–60% relative humidity) [3, 7]. This can impact the hygroscopic growth of particles and the potential for secondary particle formation.
Furthermore, the influence of wall damage on indoor PM2.5 levels in LEED buildings is less significant than in non-LEED buildings (13.98%). Wall cracks or damage can provide additional pathways for outdoor PM2.5 to enter indoor spaces. In non-LEED buildings, where there may be fewer measures in place to address building envelope integrity, these cracks can be more prevalent and more damaging. LEED V4 addresses the importance of building envelope performance through credits for thermal comfort, which ensures that the envelope is properly designed and insulated. The integrity of the building envelope is maintained through the commissioning process, where breaches are identified and rectified. This reduces the potential for outdoor pollutants to enter the indoor environment [48]. LEED V4 addresses the integrity of the building structure through credits related to thermal comfort, including the design of the building envelope and proper insulation (such as EA prerequisite: minimum energy performance and EA credit: enhanced commissioning) [8, 10]. This ensures that any breaches in the building envelope are identified and rectified as part of the commissioning process.
3.3.2. Factors Influencing Indoor NO2 Levels
In LEED-certified buildings, the factors influencing indoor NO2 concentrations and their relative contribution rates are as follows: Indoor humidity is the most significant contributor, increasing NO2 levels by 35.06%. Conversely, the indoor temperature setpoint is negatively associated with NO2, showing a 20.78% reduction in concentration with higher set temperatures, likely due to the temperature’s effect on the chemical behavior of NO2. Average supply air velocity contributes positively by 12.34%, indicating that increased air movement can aid in the dispersion of NO2 throughout the indoor space. Higher air velocity may also increase the mixing of indoor air, which can enhance the distribution of NO2 away from localized sources but can also potentially spread it more widely if there is insufficient filtration. The average predefined AFS shows a negative contribution of 9.09%, suggesting that higher ventilation rates, which bring in more outdoor air, can effectively reduce NO2 concentrations. The increased airflow likely helps dilute indoor NO2 by introducing cleaner, filtered air. A similar association between NO2 levels and indoor airflow was observed by Stamp et al. [49].
Additionally, a higher O3 concentration correlates with a decrease in NO2 by 8.44%, possibly due to O3’s reaction with NO2 to form other nitrogenous compounds [50]. In non-LEED-certified buildings, the pattern of influence is somewhat different: Indoor temperature is the dominant factor, with a positive contribution of 35.34% to NO2 levels, suggesting that higher temperatures might increase NO2 concentrations. Indoor humidity, in this case, negatively contributes to NO2 levels by 21.55%, which could indicate that, in non-LEED buildings, increased humidity might aid in the removal or reduction of NO2 from the indoor air. Interestingly, the average supply air velocity has a negative contribution of 14.66%, implying that in non-LEED buildings, increasing air movement may expel NO2 more effectively from the indoor environment, likely due to improved air exchange or dilution of pollutant concentrations through increased airflow. Lastly, the predefined AFS is positively correlated with NO2 levels by 11.21%, indicating that in non-LEED buildings, predetermined airflow rates may not be as effective in mitigating NO2 concentration. This could be due to inefficient air distribution, poor filtration, or insufficient ventilation capacity, which fail to adequately remove the NO2 from the indoor air [51].
These distinct patterns of influence reflect the differences in design and operational standards between LEED and non-LEED buildings. LEED-certified buildings typically adhere to stricter guidelines, including enhanced ventilation systems and higher filtration standards, which contribute to more effective mitigation of indoor NO2 concentrations. In contrast, non-LEED buildings may lack such stringent requirements, resulting in factors such as poorer ventilation, lower filtration efficiency, and a more permeable building envelope, all of which can lead to higher indoor NO2 concentrations compared to LEED-certified buildings.
3.3.3. Factors Influencing Indoor O3 Levels
Indoor O3 concentration is affected by various factors, which have more differences between LEED and non-LEED buildings compared to other pollutants. In LEED-certified buildings, the number of indoor air supply vents is a significant factor, positively influencing O3 concentrations with a relative contribution rate of 42.09%. This suggests that LEED buildings, with their advanced ventilation strategies and higher ventilation rates, may facilitate the introduction of more outdoor O3 indoors. These enhanced ventilation strategies, which are designed to meet strict air quality standards, may lead to greater air exchange between the indoor and outdoor environments, thus increasing the transfer of outdoor O3 into indoor spaces [52]. In contrast, the same factor has minimal influence in non-LEED buildings, likely due to less optimized ventilation systems that are not as efficient at managing outdoor air infiltration. Additionally, indoor humidity has a stronger impact on indoor O3 levels in non-LEED buildings, with a high contribution rate of 23.72%, indicating that in such buildings, changes in humidity may more significantly influence the concentration of O3. Moreover, in LEED buildings, a positive association exists between indoor temperature and O3 levels, contributing 23.57%, while an inverse relationship is observed in non-LEED buildings, where an increase in temperature correlates with a decrease in O3 levels by 28.85%. Studies found that the influence of indoor temperature on O3 level is not straightforward and depends on a multitude of factors, including the specific temperature range, the presence of O3 precursors, the rate of air exchange, and the chemical reactions that O3 undergoes at different temperatures [53, 54]. In LEED buildings, controlled conditions may maintain a temperature that reduces the rate of O3 decay, leading to higher concentrations. Conversely, in non-LEED buildings, less controlled environments may lead to higher temperature variations, which can accelerate O3 decay and reduce indoor concentrations. This suggests that temperature-related chemical reactions affecting O3 are more active in non-LEED buildings. Other building-related factors, such as distance to streets and average indoor airflow, also have a more noticeable impact on indoor O3 concentrations in non-LEED buildings, highlighting the importance of building design and operational characteristics in managing IAQ.
3.4. Cross-Comparison and Validation of SVM-NMF Model
Figure 7 presents scatter plots that juxtapose observed IAQ data along the x-axis against estimates obtained from SVM-NMF models on the y-axis. Key features of the plot include a 1:1 line, which represents perfect agreement between observed and estimated values, and a linear regression line, which provides the best fit for the estimated data based on the observed data. If the regression line closely follows the 1:1 line, the model fits the data well, indicating accurate predictions. If the regression line deviates significantly from the 1:1 line, it suggests that the model predictions may not be reliable or that there is a poor fit. Pts far from the regression line indicate where the model’s predictions are inaccurate for specific observations.
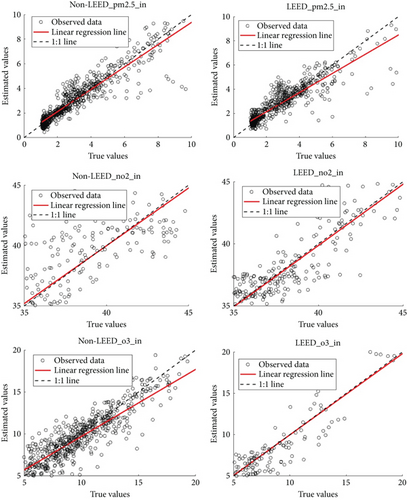
The SVM-NMF model exhibits a strong alignment and congruence of the actual versus forecasted levels for PM2.5, NO2, and O3 across LEED and non-LEED buildings. This pattern suggests that the formulated model is proficient in replicating the concentrations of these contaminants, closely reflecting the true observations. In order to enhance the validation of the accuracy and efficacy of the SVM-NMF, we conducted a comparative analysis of its coefficient of determination (R2) against that of ANNs and conventional multivariate regression models. Furthermore, we corroborated the performance of each model by evaluating its respective RMSE metrics. Table 4 displays the coefficients of determination and the RMSE statistics for the SVM-NMF, ANN, and MLR models. The importance of the p values, all of which fall below the 0.001 threshold, has been scrutinized using F-test evaluations. This not only validates the reliability of the model but also underscores its practical relevance, demonstrating that the SVM-NMF model offers a robust and consistent improvement in predicting pollutant concentrations, which is critical for on-field applications such as air quality monitoring and environmental management strategy development. In both LEED and non-LEED environments, and across all targeted pollutants, the SVM-NMF model demonstrated a superior performance in comparison to the MLR and ANN models. Within LEED environments, the SVM-NMF model achieved a mean decrease rate in RMSE (p < 0.001) that was 21.52% greater compared to the MLR model and 11.02% greater in comparison to the ANN model. In non-LEED-certified buildings, the SVM-NMF model’s mean RMSE (p < 0.001) reduction rate was superior by 38.28% relative to MLR and 25.07% higher than ANN.
| PM2.5 | NO2 | O3 | |||||||
|---|---|---|---|---|---|---|---|---|---|
| R2 | RMSE | CR | R2 | RMSE | CR | R2 | RMSE | CR | |
| MLR (LD) | 0.61 | 1.06 | 0.98 | 1.94 | 0.95 | 1.82 | |||
| ANN (LD) | 0.77 | 0.96 | 9.73% | 0.99 | 1.57 | 18.92% | 0.96 | 1.74 | 4.42% |
| SVM + NMF (LD) | 0.83 | 0.90 | 15.99% | 0.99 | 1.39 | 28.14% | 0.98 | 1.45 | 20.43% |
| MLR (NLD) | 0.78 | 1.13 | 0.92 | 3.02 | 0.55 | 2.86 | |||
| ANN (NLD) | 0.89 | 1.02 | 9.83% | 0.96 | 1.94 | 35.70% | 0.80 | 2.01 | 29.68% |
| SVM + NMF (NLD) | 0.94 | 0.86 | 24.24% | 0.97 | 1.24 | 58.92% | 0.86 | 1.96 | 31.69% |
- Note: CR = decrease rate in RMSE based on the MLR values; p < 0.001.
- Abbreviations: LD = LEED; NLD = non-LEED.
4. Conclusions
The study implemented an advanced approach comprising a SVM and NMF algorithm to evaluate characteristics of multiple air pollutants, as well as environmental factors influencing these pollutants, within both LEED-certified and non-LEED educational buildings. Indoor and outdoor air pollutants data were collected from an integrated air quality sensor system operating continuously for a week, while building-related data were derived from walk-through audits, construction drawings, and BACnet monitoring systems. The findings indicated that, on average, pollutant concentrations were lower in LEED-certified buildings compared to non-LEED buildings. In the 10 targeted buildings, indoor PM2.5 concentrations in non-LEED buildings were higher by an average of 0.52 μg/m3, NO2 concentrations were greater by an average of 14.75 ppb, and O3 concentrations were larger by an average of 0.94 ppb. The study also uncovered that, under the same microclimate, the factors influencing air pollutants were generally similar across LEED and non-LEED educational buildings. However, there was a significant discrepancy in the contribution ratios of these factors, especially for indoor NO2 and O3 levels. Furthermore, the SVM-NMF model displayed high efficiency in analyzing multidimensional IAQ data, effectively managing nonlinear relationships and multicollinearity, thereby significantly enhancing the robustness of the computational process. In both LEED and non-LEED building environments, the SVM-NMF model significantly outperformed both the MLR model (by an average of 26.9%, p < 0.001) and the ANN model (by an average of 18%, p < 0.001). The findings and tools from this study may provide a data foundation for air quality management in LEED-certified buildings. They can enhance the quantification of the IEQ category within LEED assessment criteria and contribute to more targeted environmental management of green and healthy buildings.
The limitations of this study stem from its reliance on data specific to the climatic conditions of the Florida region, which may affect the generalizability of the model performance to other geographic locations with different environmental variables. Therefore, the applicability of the proposed model in regions with varying climates remains uncertain. Additionally, the analysis was based on a limited sample size, which may restrict the robustness of the findings. Future work should consider expanding the sample size and broadening the scope of monitoring to encompass a wider range of environmental and building conditions, thereby improving generalizability and predictive accuracy. Another limitation is the absence of detailed consideration of human occupancy behaviors, which are known to significantly influence IAQ and pollutant concentrations. Future models should integrate a more comprehensive set of human behavioral factors, such as occupancy patterns, activities, and ventilation preferences, to enhance the accuracy of IAQ predictions. The findings of this study provide a valuable data-driven foundation for future research on indoor air pollution, specifically in relation to green-certified buildings. The methodologies developed in this study can be leveraged for the analysis of multidimensional IAQ data in similar environmental contexts, contributing to the development of effective indoor pollution control strategies. Future research should also explore the potential for adapting and refining these methodologies to account for a broader array of factors, including evolving building standards and emerging pollutants. Furthermore, as LEED certification programs and other green building standards continue to evolve, it is critical to evaluate how these changes impact IAQ modeling and management practices.
Conflicts of Interest
The authors declare no conflicts of interest.
Author Contributions
He Zhang: conceptualization, funding acquisition, data curation, investigation, software, methodology, visualization, and writing—original draft. Ravi Srinivasan: conceptualization, writing—review and editing, methodology, supervision, and project administration. Xu Yang: methodology, software, validation, and writing—original draft. Junxue Zhang: resources, validation, and writing—review and editing. Vikram Ganesan: methodology, software, and writing—original draft. Han Zhang: visualization and writing—review and editing.
Funding
This work was supported by the Fundamental Research Funds for the Central Universities (Grant No. 20720241019) and the Institution of Innovation and Creativity of Xiamen University (Grant Nos. 1920230301 and 1920231001).
Acknowledgments
The authors thank Dr. Chen Chen for her valuable suggestions and comments, which largely improved the quality of the paper.
Open Research
Data Availability Statement
The data that support the findings of this study are available from the corresponding author upon reasonable request.


