Ventilation and Air Quality of a Densely Occupied Multipurpose Room in an Elderly Care Center
Abstract
Older people are more susceptible to health risks from indoor air pollution, even at low pollution levels. This study aimed to improve ventilation and air quality of densely occupied multipurpose rooms in elderly care centers (ECCs). The specific objectives were to investigate the impact of different ventilation types on ventilation performance and air quality in the ECC’s multipurpose room, including mixing (MV), displacement (DV), zone (ZV), stratum (SV), and underfloor ventilation (UV); analyze the influence of ventilation on CO2 concentration; and discuss appropriate ventilation design comprehensively considering air velocity, CO2 level, air change efficiency (ACE), mean age of air (MAA), contaminant removal effectiveness (CRE), and predicted mean vote (PMV). First, an experimental study was conducted, and then 11 potential optimization models were proposed based on the experiment’s results. Finally, quantitative results were obtained through computational fluid dynamics (CFD) analysis. Analysis revealed that model ZV2 with wall outlets at 1.1 m and ceiling inlets proved to be the optimal ventilation type. It had fewer air circulation and stagnation areas, and it maintained its effectiveness regardless of furniture configurations or occupant positioning (caregivers and elderly people), factors that could potentially compromise airflow in other models. Compared to model ZV2, CO2 concentrations in the sitting breathing zone of other models increased from a minimal increase of 0.2% to a substantial increase of 38.9%. Analysis also showed that the seats in the first row consistently maintained low pollutant concentration environments. These new results offer valuable insights for ECC stakeholders by assessing ventilation and air quality in crowded spaces for older people at two different breathing heights (sitting and standing).
Summary
- •
Air quality and ventilation are essential for the ECC multipurpose room.
- •
Prioritize on air quality at sitting height while also considering standing height.
- •
Considering airflow, CO2, CRE, ACE, MAA, and PMV, model ZV2 is suggested.
- •
Pollutant concentration in ZV2 was low, with small fluctuations between rows.
- •
The pollution concentration of the seats in the first row is lower.
1. Introduction
Older people usually spend around 22 h per day indoors, emphasizing the importance of evaluating indoor air quality (IAQ) in the places where they commonly stay [1]. Compared to people of other ages, prolonged exposure to high levels of indoor air pollution may have more adverse effects on the health of elderly individuals, such as increased respiratory rate, increased brain blood flow, metabolic stress, headache, dizziness, confusion, dyspnea, sweating, hypertension, and loss of consciousness [2]. Elderly care centers (ECCs) always accommodate a substantial population of elderly residents. During daytime hours, elderly people often congregate in multipurpose rooms for various activities, such as reading, lectures, and group activities. Due to the higher occupancy levels of ECCs’ multipurpose rooms, these rooms experience greater air quality challenges than other rooms in ECCs. Ventilation is a widely recognized technique for improving IAQ and can help enhance the health of occupants. Some studies have found that inadequate ventilation is a common and significant issue in many ECCs [3–7]. Hence, it is essential to prioritize the research on the ventilation and air quality of the multipurpose room in the ECC.
Differences in ventilation design between the multipurpose room in ECCs and other buildings include the following: (1) ECC multipurpose rooms require higher ventilation standards to meet high-level air quality requirements, and (2) the placement of air inlets and outlets in ECCs should not disrupt the daily activities of elderly residents. The ECC multipurpose rooms have several distinctive characteristics: (1) Various events are regularly organized that attract many elderly residents, potentially increasing air pollution in this area. (2) Professional caregivers often stand in close proximity to older people requiring assistance, potentially affecting local air quality. (3) Safety features such as barrier-free entrances may influence the distribution of airflow. Ensuring a high-quality, healthy, and safe indoor environment is a common goal for multipurpose rooms in ECCs worldwide, regardless of their architectural design. Besides ECCs, many other places such as schools, libraries, and residential areas also offer multipurpose rooms. Still, the design and features of these rooms vary depending on their intended use.
Previous ventilation research in densely occupied areas has commonly focused on public spaces such as offices, schools, hospitals, and aircraft cabins (Table 1) [6–28]. Studies have shown that improving ventilation system design can enhance the air quality in densely occupied rooms and breathing zones significantly. Research has demonstrated the potential of ventilation systems such as displacement ventilation (DV), stratum ventilation (SV), underfloor ventilation (UV), and zone ventilation (ZV). The strategic placement of return and supply air outlets, along with their relationship to pollution sources, plays a crucial role in optimizing airflow distribution, pollutant removal, and thermal comfort. Additionally, restricting the number of people in the room and adopting staggered seating arrangements have improved the overall air quality. Research has also shown that monitoring indoor carbon dioxide (CO2) levels can be a proxy for ensuring adequate ventilation and air quality and assessing the risk of respiratory infections. While research on IAQ in crowded spaces such as classrooms continues to advance, there have not yet been quantitative studies examining how human behaviour factors influence the environment. About ECC studies, it has been observed that numerous ECCs across the globe have high levels of indoor air pollution [3–7]. This includes pollutants such as CO2, particulate matter (PM), carbon monoxide (CO), and volatile organic compounds (VOCs). These high pollution levels can be attributed to factors such as high population density, inadequate ventilation systems, and lack of policies regarding the building environment design of ECCs [2, 7]. Furthermore, research conducted in ECCs during the COVID-19 pandemic emphasizes the urgent need for effective ventilation strategies [6].
| Study focus | Key findings | Reference |
|---|---|---|
| Investigating office occupant arrangements by analyzing the nonuniformity of CO2 concentration |
|
[8] |
| Ventilation strategies for reducing disease transmission in an office |
|
[9] |
| Different ventilation types and their impacts on air quality in an office |
|
[10] |
| Optimizing air outlet height for air distribution system in a small office to ensure air quality and thermal comfort |
|
[11] |
| Assessing the impact of different ventilation types on office air quality |
|
[12] |
| SARS-CoV-2 airborne transmission patterns in an office under different ventilation systems |
|
[13] |
| Classroom airflow patterns and air quality |
|
[14] |
| Ventilation impact on air quality and comfort in classrooms |
|
[15] |
| Key factors influencing air quality, comfort, and ventilation in classrooms |
|
[16] |
| Optimizing ventilation systems in a classroom to reduce respiratory pathogen transmission |
|
[17] |
| The distribution of airflow and the movement of coronavirus particles during breathing and sneezing in a classroom |
|
[18] |
| Local exhaust system effectiveness in removing contaminants in meeting rooms |
|
[19] |
| Ventilation and infection control in a crowded conference room |
|
[20] |
| Ventilation strategies for high-occupancy rooms |
|
[21] |
| Evaluating stratum ventilation performance in a crowded indoor space |
|
[22] |
| Impact of air inlet spacing on stratum ventilation performance in a multirow occupied room |
|
[23] |
| Air pollutant prevention and thermal comfort in various ventilation types in a research institute lab |
|
[24] |
| The influence of air inlet height in underfloor ventilation on indoor thermal comfort and indoor air quality |
|
[25] |
| Airflow and pollutant transport in aircraft cabin ventilation systems |
|
[26] |
| Effect of mechanical and natural ventilation on indoor airborne contaminants spread |
|
[27] |
| Assessment of airborne transmission in an ECC using CO2 tracer gas |
|
[7] |
| Infection risks in UK ECCs |
|
[6] |
| Indoor ventilation and its effects on mental health among Chinese older people |
|
[28] |
An important relationship needs to be addressed between the global issue of population ageing, indoor air pollution exposure, and the health of older people. However, after examining the characteristics of ECC multipurpose rooms and reviewing relevant ventilation literature, a lack of quantitative research was found on reducing exposure of ECCs to air pollution by improving ventilation systems. The ECC multipurpose room is distinct from classrooms, offices, or regular lounges due to the presence of two different breathing heights and a higher population density—the seated elderly and the standing healthcare staff beside them. As a result, the distribution of air pollutants and the ventilation system design may vary significantly from previous studies. This study addresses the knowledge gap by developing potentially effective ventilation modes, including mixing ventilation (MV), DV, ZV, SV, and UV, as shown in Figure 1.
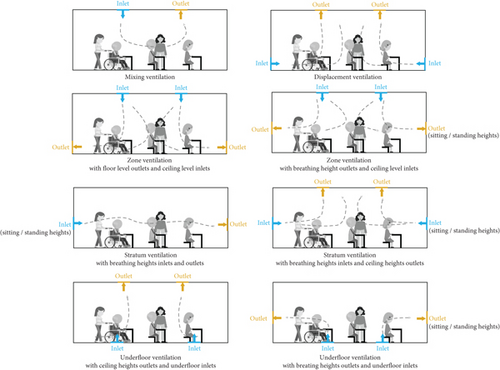
The innovations of this study lie in the following: (1) This is the first quantitative study using CFD to optimize ventilation for crowded multipurpose rooms in ECCs by evaluating various ventilation designs, and (2) it provides a comprehensive analysis of air quality at both sitting and standing breathing heights in densely occupied ECC multipurpose rooms, offering valuable insights for elderly building environmental design. In contrast to classrooms and offices, ECC multipurpose rooms feature a distinctive occupancy pattern, with both seated elderly residents and standing staff members providing care, creating distinctly airflow patterns.
The main aim of this work is to enhance the ventilation and air quality of densely occupied multipurpose rooms in ECCs. The specific objectives are to investigate the influence of different ventilation types on airflow distribution in the multipurpose room in the ECC in 11 proposed ventilation models based on five ventilation types: MV, DV, ZV, SV, and UV; analyze the influence of different ventilation types on CO2 concentration distribution in the breathing zone; and finally discuss efficient ventilation system design comprehensively with air velocity, CO2 level, air change efficiency (ACE), mean age of air (MAA), predicted mean vote (PMV), and contaminant removal effectiveness (CRE). Our findings would provide valuable insights for the global community, ECC managers, designers, elderly people, and other stakeholders.
2. Methodology
2.1. Experimental Study
This study was conducted in a multipurpose room at Xiangshan ECC in Nanjing, China. The multipurpose room in this ECC was selected for our experimental research because it is a representative ECC multipurpose room. The room has a regular shape and can accommodate a variety of daily activities for older people. The dimensions of the room were 14.40 m (length) × 8.40 m (width) × 2.60 m (height), with a volume of 314.5 m3 (Figure 2a). The desk dimensions were assumed to be 1.40 m (length) × 0.76 m (width) × 0.75 m (height) with a total of five rows of desks. The room currently has four ceiling-mounted air supply inlets and one ceiling-mounted return outlet (Figure 2b). The air inlet size is 0.5 m × 0.5 m, while the air outlet size is 0.2 m × 0.2 m. This room does not have any windows, but it is equipped with two doors. All the walls are interior walls.
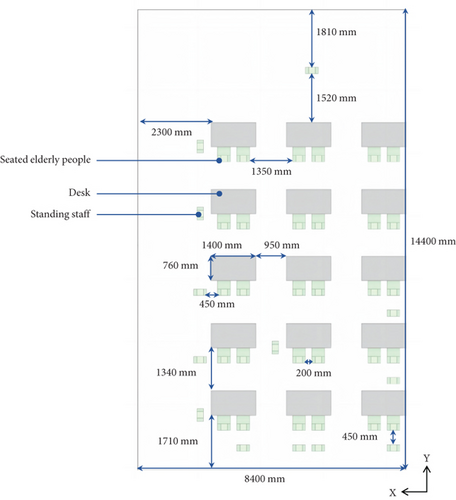
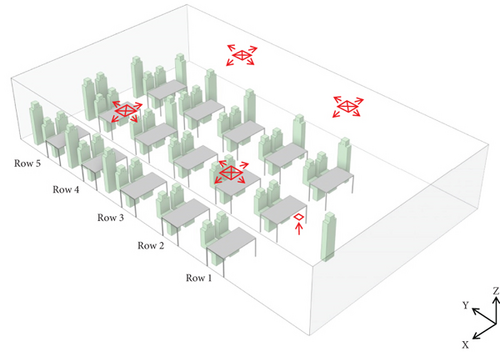
During the process of conducting environmental monitoring, all the doors were closed. The supply airflow rate was adjusted to 0.3 m/s, according to the minimum supply airflow rate of 0.45 m3/s [30]. The supply air temperature was also set to a constant value of 26°C in winter. During monitoring, eight older people were seated in the room. They were engaged in various activities such as watching TV, reading books, or using their phones. To minimize airflow interference, all irrelevant items were removed from the site before conducting the experiment. The experiment had 20 monitoring points. The coordinate points for this experiment are defined as (x, y), at four distinct vertical heights: 0.5, 1.0, 1.5, and 2.0 m. (x, y) = (1.8 m, 12.7 m), (1.8 m, 10.0 m), (1.8 m, 4.2 m), (6.4 m, 4.2 m), and (6.4 m, 10.0 m). For each measurement point, data for velocity, temperature, and CO2 concentration were collected at intervals of 1 min. The measurement period was 1 h, and 60 groups of measurement samples were obtained.
Two types of measurement devices were used in this experiment: testo 405i hot wire anemometer for measuring air velocity and temperature [31] and HOBO MX CO2 data logger for measuring CO2 concentration [32]. Both devices have been utilized in some related research studies [33–36]. The data transmitted wirelessly via Bluetooth directly to the testo and HOBO Smart Apps on the smartphone. The testo 405i hot wire anemometer measures 200 × 30 × 41 mm and weighs 119.6 g, while the HOBO MX CO2 data logger has dimensions of 76.2 × 129.5 × 47.8 mm and weighs 267.4 g. Therefore, these devices are convenient to carry, enable easy data recording, and their compact size does not interfere with regular activities in the multi-purpose room. They provide precise measurement capabilities: temperature measurements range from –20°C to +60°C (accuracy of ±0.5°C, resolution: 0.1°C), air-velocity measurements span 0 to 30 m/s (accuracy: ±0.1 m/s, resolution: 0.01 m/s), and CO2 monitoring extends from 0 to 5000 ppm (accuracy: ±50 ppm, resolution: 1 ppm). The comparison between experimental results and simulation results will be described in section 3.1.
2.2. Proposed Ventilation Models
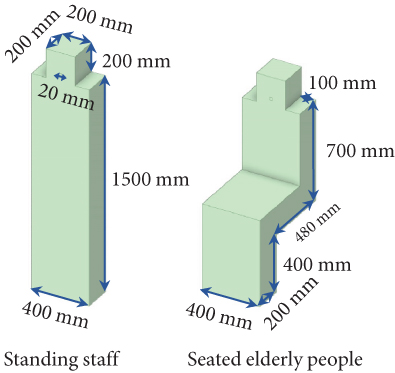
To enhance the IAQ and ventilation performance of the multipurpose room for elderly people, a full-scale model was implemented. This study presents 11 potential ventilation models (Figure 3), which are based on five ventilation types: MV, DV, ZV, SV, and UV. Assuming there were 30 elderly individuals seated and 13 staff members standing, these staff were assigned a distance of 450 mm from the elderly individuals they provide care for. In addition, the seating arrangement was considered to ensure an optimal viewing experience because the standing staff members may obstruct the view of elderly participants in the back row. Therefore, elderly individuals who require staff assistance should sit in places that do not hinder the view of others during activities. Some staff members were designed to stand facing older people, while others were designed to stand next to or behind them. The dimensions of the human model were referenced from an ergonomics guide [29] (Figure 2c).
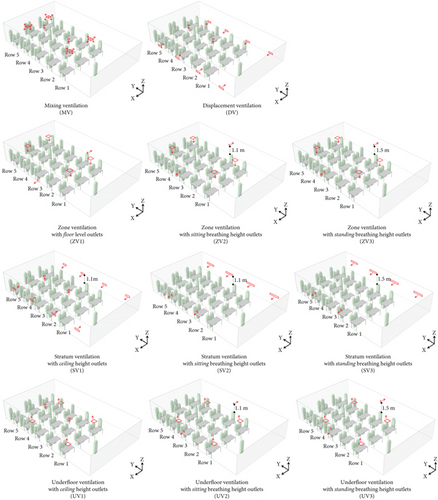
Table 2 displays the quantity and size of the air inlets and outlets for the proposed ventilation models (models MV, DV, ZV1-3, SV1-3, and UV1-3). All proposed ventilation models have an additional outlet compared to the current ventilation. Models DV and SV1 have four additional air inlets compared to other proposed models, but the total area of all proposed models’ air inlets is equal (0.25 m2). The design of each ventilation model is intended to improve ventilation for the entire room, especially for the breathing zone.
| Proposed ventilation models | Air inlet number | Air inlet size | Air outlet number | Air outlet size | Air inlet velocity |
|---|---|---|---|---|---|
| Model MV | 4 | 0.5 × 0.5 m | 2 | 0.2 × 0.2 m | 1.73 m/s |
| Model DV | 8 | 0.625 × 0.2 m | 2 | 0.2 × 0.2 m | 1.73 m/s |
| Models ZV1, 2, and 3 | 4 | 0.5 × 0.5 m | 2 | 0.2 × 0.2 m | 1.73 m/s |
| Model SV1 | 8 | 0.625 × 0.2 m | 2 | 0.2 × 0.2 m | 1.73 m/s |
| Models SV2 and 3 | 4 | 1.25 × 0.2 m | 2 | 0.2 × 0.2 m | 1.73 m/s |
| Models UV1, 2, and 3 | 4 | 0.5 × 0.5 m | 2 | 0.2 × 0.2 m | 1.73 m/s |
2.3. Numerical Model
Computational fluid dynamics (CFD) has been used in many studies to simulate airflow, temperature, and pollutant concentration (e.g., CO2) [9, 37–39]. Ansys Fluent 2021R2 software was used for the numerical studies. This work’s numerical simulations were conducted under incompressible and steady-state conditions. To decrease the computational intensity of CFD simulations, the Reynolds-averaged Navier–Stokes (RANS) method is employed [9]. Among the RANS models, the renormalization group (RNG) k-ε model has been found to show improved performance for simulating indoor environments [9, 40].
2.4. Boundary Conditions and Grid Independence Analysis
Table 3 presents the specific boundary conditions for the numerical study. The supply airflow rate was adjusted to 1.73 m/s, aiming to deliver sufficient ventilation air to all people in the room [41, 42]. The supply air temperature of the air-conditioning system was set to a constant value of 26°C in winter. The outlets were configured as outflow. The human body temperature was 24°C, while the head and mouth temperatures were 34°C and 36°C, respectively [9]. The airflow temperature for breathing was assumed to be 36°C, and the breathing rate was 0.7 m/s [9]. Additionally, the wall temperature was set to be 15°C. All walls of the studied multipurpose room were internal walls.
| Air inlet | Velocity-inlet; 1.73 m/s; 26°C; 400 ppm |
|---|---|
| Air outlet | Outflow |
| Human body | 24°C |
| Human head | 34°C |
| Human mouth | 36°C; 20 mm × 20 mm |
| Human breathing | 0.7 m/s; 45,000 ppm; 36°C |
| Internal wall | 15°C |
Grid independence analysis is an essential analysis in studies involving simulation scenarios. It identifies the appropriate grid conditions with the fewest grids based on the results of various grid conditions, without producing numerical differences [5]. In this study, coarse, medium, and fine grids were set up to analyze grid independence for both the current and proposed ventilation models (Figure 4). The critical areas were refined, including the air inlets, air outlets, and standing and sitting human body models. For example, in terms of the current ventilation type in the experimental room, the three grid cases are as follows: 14,454,018 (coarse), 9,395,826 (medium), and 3,719,330 (fine).
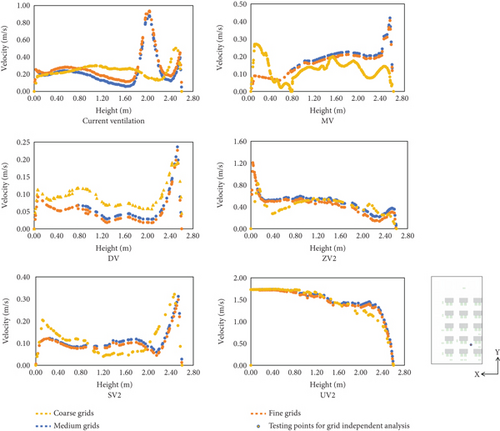
Regarding the proposed ventilation models, models MV, DV, ZV2, SV2, and UV2 were selected for the independent analysis. Grid tests were not conducted for all proposed models because the number and area of the air inlets and outlets for ZV1, 2, and 3 were equal. Similarly, the number and area for DV and SV1 were equal; UV1, 2, and 3 were equal; and SV2 and 3 were equal. As illustrated in Figure 4, the medium and fine grids across all simulation results show strong consistency, with deviations of less than 10%. Therefore, this ECC study adopted medium mesh grids to simulate airflow and pollutant distribution.
2.5. IAQ
In addition to the MAA and ACE, this study assessed the CO2 levels in each row of the breathing zone, including sitting and standing breathing zones (1.1 and 1.5 m). Long-term exposure to high levels of CO2 can lead to health issues (e.g., headaches, dizziness, elevated blood pressure, and difficulty breathing) [36]. According to the ASHRAE standard [46], the maximum allowable concentration in indoor spaces is usually set at 1000 ppm. However, previous studies have indicated that indoor CO2 levels below 800 ppm can alleviate stress on the respiratory and cardiovascular systems, reduce the risk of chronic diseases, and enhance cognitive function and overall physical health [47–49].
2.6. CRE
2.7. PMV
Neutral and warm environments provide thermal comfort for elderly occupants [54]. A PMV range of −0.5 to +0.5 is recommended for new buildings and renovation projects, and existing buildings have a wider recommended range of −0.7 to +0.7 [55]. A trade-off exists between improving air quality and maintaining thermal comfort [2]. This study aims to enhance the IAQ of the ECC while concurrently aiming to keep a low PMV value, thus optimizing both aspects for elderly occupants’ well-being.
3. Results and Discussion
3.1. Validation
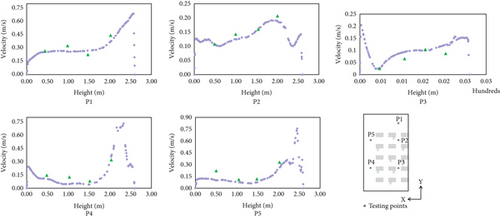
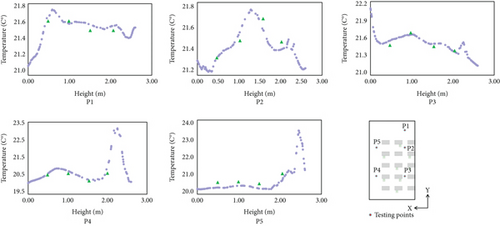
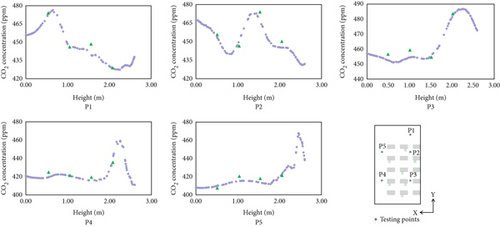
The experimental results were obtained in an ECC in China, as described in Section 2.1. These results were compared with the simulated data in Microsoft Excel 2023. Figure 5 illustrates the comparison of P1–P5 at four vertical heights in the ECC multipurpose room. The selected points are evenly distributed at the experimental room’s front, middle, and back. The measured and simulated velocity, temperature, and CO2 results indicated a strong consistency level. The existing errors may be due to the equipment’s resolution, where the wind speed resolution is 0.01 m/s for the equipment, while the simulated data has a resolution of 0.00000001 m/s. The temperature resolution for the equipment is 0.1°C, whereas the simulated data has a resolution of 0.000001°C. Additionally, the CO2 measurement equipment has a resolution of 1 ppm, whereas the simulated model provides higher with a resolution of 0.00001 ppm.
3.2. Influence of Different Ventilation Types on Ventilation Performance in the Multipurpose Room
The ventilation performance of proposed ventilation models was analyzed by examining the spatial distribution of indoor airflow. These included model MV, model DV, three ZV models (models ZV1, 2, and 3), three SV models (models SV1, 2, and 3), and three UV models (models UV1, 2, and 3), which had been described in Section 2.2. As older people are seated, it is also important to analyze not only the airflow in the entire room but also the condition of the sitting breathing zone. This study named Plane 1 to observe the airflow at a breathing height of 1.1 m.
All the proposed ventilation models were found to adhere to a principle: fresh air was injected into the room through air inlets and mixed with the exhaled air of the occupants in various flow patterns. After circulating within the indoor space, the air was then expelled from the room through various pathways. And the airflow distribution in different models was greatly influenced by the positioning of the air inlet and outlet.
Compared to the other 10 ventilation models, model MV showed the lowest air velocity in most areas of the sitting breathing zone. Fresh air was introduced from the outlets on the ceiling, with part of it flowing downward and some of it potentially being exhausted directly from the ceiling outlets (Figure 6). Table 4 shows that compared to model MV, models DV, ZV1, ZV2, ZV3, SV1, SV2, SV3, UV1, UV2, and UV3 increased the average air velocity of the breathing zone by 23%, 31%, 46%, 38%, 138%, 231%, 46%, 62%, 77%, and 69%, respectively. This indicated that other ventilation models are more effective than model MV in increasing the airflow velocity in the sitting breathing zone and have more potential to improve IAQ.

| Average of the room | Average of the sitting breathing zone | |
|---|---|---|
| Model MV | 0.13 m/s | 0.11 m/s |
| Model DV | 0.20 m/s | 0.15 m/s |
| Model ZV1 | 0.18 m/s | 0.15 m/s |
| Model ZV2 | 0.18 m/s | 0.17 m/s |
| Model ZV3 | 0.18 m/s | 0.15 m/s |
| Model SV1 | 0.21 m/s | 0.33 m/s |
| Model SV2 | 0.22 m/s | 0.42 m/s |
| Model SV3 | 0.23 m/s | 0.17 m/s |
| Model UV1 | 0.22 m/s | 0.18 m/s |
| Model UV2 | 0.21 m/s | 0.20 m/s |
| Model UV3 | 0.21 m/s | 0.19 m/s |
Displacement and MV systems have been widely used in relevant studies [9, 10]. Regarding model DV, higher air velocity was observed in the middle of each row, which might be due to the air outlets being located in the same place as the ceiling. This increased air velocity could indicate improved IAQ in that area, but air stagnation or air recirculation areas might be present on both sides of each row. Therefore, this suggested that DV may not be effective in improving air quality in the densely occupied ECC room.
SV has also been discussed in many recent studies [9, 10, 12, 56]. Regarding model SV1, many areas with high air velocity were found in the breathing zone. This is because the air supply outlets on both sides were set at breathing height, allowing fresh air to be delivered to the breathing zone quickly. However, since the air outlet was located on the ceiling, pollutants circulated multiple times before being exhausted. This could affect air quality and created strong air drafts that could cause discomfort for sensitive elderly people. Regarding model SV2, it also demonstrated high air velocity in various areas of the breathing zone, with fresh air supplied at a sitting breathing height (1.1 m) from one side of the wall, and then expelled through the outlets at the same height on the opposite wall. This indicated that model SV2 may help dilute pollutants in the sitting breathing zone quickly, and it has been recommended by some previous studies [10], but it also has its disadvantages. For instance, people seated far from the air inlets might not receive sufficient fresh air, and the air pollution at the standing heights may not be able to be diluted quickly. In addition, similar to model SV1, model SV2 could also create a strong draft, potentially causing thermal discomfort. Regarding model SV3, the main difference from model SV2 was that both the air outlets and inlets are positioned at standing breathing height (1.5 m). This could result in lower airflow velocity at sitting level compared to SV2, potentially causing pollutant accumulation. Consequently, each of these three SV models has its own advantages and disadvantages.
UV is designed to deliver fresh air from the ground level to the room. Research indicates that this type of ventilation can enhance air quality in the lower part of the room and offers personalized control [56]. However, people sitting near the air inlets may experience thermal discomfort [10]. By comparing models UV1, UV2, and UV3, we found that model UV2 had the best airflow distribution in the sitting breathing zone. Its air outlets were closest to the breathing zone of those seated, facilitating the timely removal of pollutants. This finding aligns with some previous studies. For instance, Fan et al. [10] recommended that the optimal height for UV air outlets is between 1.05 and 1.25 m to achieve a high level of IAQ. However, model UV2 was also found to have some disadvantages. Unlike offices and classrooms, the ECC multipurpose room is often overcrowded, with many seated elderly people and standing staff taking care of them. The room’s tables, chairs, wheelchairs, and people obstruct fresh air from the air inlets on the floor, making it challenging to bring sufficient fresh air to the breathing zone. Therefore, UV can improve IAQ but may not be the most suitable type for the densely occupied ECC multipurpose rooms.
Furthermore, some recent studies have begun to discuss ZV [9, 13, 20, 27]. For example, a study focused on reducing the possibility of virus transmission in densely occupied spaces suggested using model ZV1 to divide indoor space into multiple airflow regions [9]. In terms of model ZV1, the supply airflow travelled vertically to the lower part of the room with a large air velocity from four air inlets evenly distributed on the ceiling. After hitting the tables, the air dispersed horizontally through the breathing zone of the seated elderly residents and then exhausted through floor-level wall outlets. It brought fresh air into multiple areas in the breathing zone quickly without being obstructed by furniture or people. However, due to the lower position of the air outlets, the pollutant dilution efficiency might be affected. In model ZV2, the air outlets were at sitting breathing height, while in model ZV1, they were near the floor height. This difference allowed model ZV2 to dilute pollutants more effectively in the ECC multipurpose room, where many elderly residents were seated. Additionally, comparing model ZV2 to model ZV3, the main difference was that the air outlet of model ZV3 was set at standing breathing height (1.5 m), while the air outlet of model ZV2 was set at sitting breathing height (1.1 m). This indicated that the air velocity in the sitting breathing zone in model ZV3 might be reduced, potentially affecting air quality negatively. Therefore, model ZV2 might be a suitable ventilation type that benefits the air distribution in the sitting breathing zone occupied by many older people.
In summary, model ZV2 showed the greatest potential to improve airflow distribution in the sitting breathing zone and may facilitate rapid dilution of pollutants in the densely occupied ECC multipurpose room. Furthermore, models UV2 and SV2 also provided appropriate airflow distribution and can be considered alternatives.
3.3. Influence of Ventilation Types on CO2 Concentration in the Multipurpose Room
The population density in many ECCs may be higher than in offices and classrooms because, in addition to the seated elderly, many professional caregivers are standing beside them. Therefore, the air quality here may be worse than typical office spaces and classrooms. CO2 concentration is an important factor used to analyze IAQ. The mean values of the breathing zones for each row were compared specifically (Plane 1). Planes 2–4 were also selected to analyze CO2 distribution in the room (Figure 7).
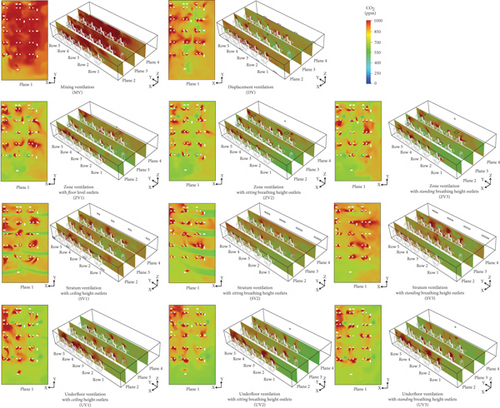
All proposed ventilation models (except model MV) could effectively decrease the average concentration in the room and the concentration in the sitting breathing zone to below 690 ppm, which is below the reference standard (800 ppm) (Table 5). Figure 7 shows that pollutant concentration in the sitting breathing area of older people was highest in Planes 1–4 under model MV (860 ppm). At the same time, it was lowest under model ZV2 (619 ppm). This is because, in model MV, the pollutant was accumulated in the breathing zone due to air recirculation. In contrast, model ZV2 could rapidly remove the pollutants from the room through a short path. Models ZV3, SV2, UV2, and UV3 were also found to have relatively low pollution concentrations in the breathing zone (below 630 ppm). Compared to model ZV2, the CO2 concentrations in the sitting breathing zone of MV, DV, ZV1, ZV3, SV1, SV2, SV3, UV1, UV2, and UV3 increased by 38.9%, 11.3%, 4.8%, 1.1%, 7.6%, 1.5%, 9.2%, 2.6%, 0.2%, and 1.1%, respectively (Figure 8a).
| Average of the room | Average of the sitting breathing zone | Average of the standing breathing zone | Row 1 | Row 2 | Row 3 | Row 4 | Row 5 | |
|---|---|---|---|---|---|---|---|---|
| Model MV | 816 | 860 | 834 | 871 | 931 | 922 | 936 | 881 |
| Model DV | 648 | 689 | 658 | 682 | 736 | 724 | 737 | 668 |
| Model ZV1 | 616 | 649 | 632 | 600 | 757 | 651 | 684 | 674 |
| Model ZV2 | 591 | 619 | 620 | 590 | 647 | 654 | 664 | 660 |
| Model ZV3 | 594 | 626 | 620 | 611 | 671 | 644 | 666 | 647 |
| Model SV1 | 642 | 666 | 669 | 660 | 706 | 668 | 735 | 664 |
| Model SV2 | 626 | 628 | 648 | 610 | 661 | 638 | 700 | 642 |
| Model SV3 | 638 | 676 | 629 | 644 | 701 | 701 | 798 | 696 |
| Model UV1 | 592 | 635 | 620 | 656 | 651 | 678 | 686 | 646 |
| Model UV2 | 587 | 620 | 612 | 623 | 668 | 640 | 669 | 683 |
| Model UV3 | 589 | 626 | 616 | 643 | 648 | 637 | 673 | 661 |
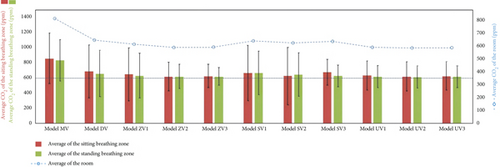
Different from previous studies, this study examines CO2 exhalation at two distinct heights (1.1 and 1.5 m). The CO2 dispersion at the standing breathing level (1.5 m) potentially plays a crucial role in influencing the air quality experienced by seated elderly people. The lowest concentrations at standing breathing height were observed in models UV2 (612 ppm) and UV3 (616 ppm), followed by models ZV2 (620 ppm), ZV3 (620 ppm), and UV1 (620 ppm) (Figure 8a). Thus, these models are effective in dispersing pollutants in both the seated and standing breathing zones.
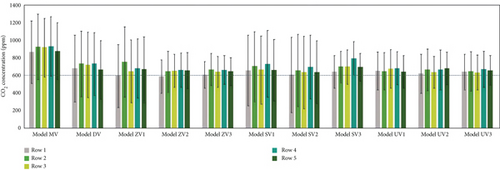
To conduct a more in-depth analysis of the sitting breathing zone, the concentration at each row (from Row 1 to Row 5) was calculated. The diverse locations of these rows and the varying number of staff members at each row led to distinct airflow patterns and distributions of pollutants. The highest concentration of rows was found in model MV (936 ppm), while the lowest concentration of rows was found in model ZV2 (590 ppm) (Figure 8b). Comparing the concentration of each row, the lowest CO2 concentration values were found as follows: model ZV2 (590 ppm) in Row 1, model ZV2 (647 ppm) in Row 2, model UV3 (637 ppm) in Row 3, model ZV2 (664 ppm) in Row 4, and model SV2 (642 ppm) in Row 5. Combined with the previous assessment of all models, model ZV2 presented the best potential to reduce the average pollutant concentration in the sitting breathing zone and the potential to reduce most rows. In addition, models ZV3, SV2, UV2, and UV3 can also be considered alternatives and need to be further compared with other factors comprehensively in Section 3.4. Also, most models showed their lowest concentration in Row 1 (except models DV, UV1 and UV3), and their highest concentration in Row 4 (except model ZV1, ZV3 and UV2). Therefore, it is recommended that people choose to sit in Row 1 and avoid sitting in Row 4.
Based on the above findings, model ZV2 was the most effective ventilation type in removing CO2 in the sitting breathing zone. This is mainly because the airflow path of model ZV2 was more direct to simultaneously exhaust air pollution at sitting and breathing heights quickly, thereby ensuring low pollutant concentrations in elderly residents’ breathing zones without disrupting elderly residents’ activities and caregivers’ work. In addition to model ZV2, models SV2 and UV2 can be used as alternatives to help achieve relatively low pollution concentrations in the sitting breathing zone. Furthermore, it is recommended for people to sit in the first row. The open area in front of the first row can help dilute pollutants.
3.4. Discussion
This paper is the first simulation study on optimizing the ventilation design of the densely occupied ECC multipurpose room, and it is also the first paper to focus on a crowded, densely occupied space with both sitting and standing people. This section discusses the most suitable ventilation mode for the ECC multipurpose room and compares the findings with similar studies.
The airflow and CO2 distribution results from Sections 3.2 and 3.3 were integrated with the CRE, ACE, MAA, and PMV to find the most suitable ventilation model for the ECC multipurpose room. Figure 9 summarizes these values in the same schematic diagram at the breathing zones. Among these six elements, model ZV2 was found to have the best performance. This was the ZV mode with air outlets at sitting breathing height (1.1 m) and air inlets on the ceiling. It demonstrated enhanced performance in ventilation and air quality, with a high CRE value (0.96), high ACE value (1.00), lowest CO2 concentration (619 ppm), and youngest MAA (45 s), along with lower air velocity (0.19 m/s) and suitable |PMV| value (0.34).
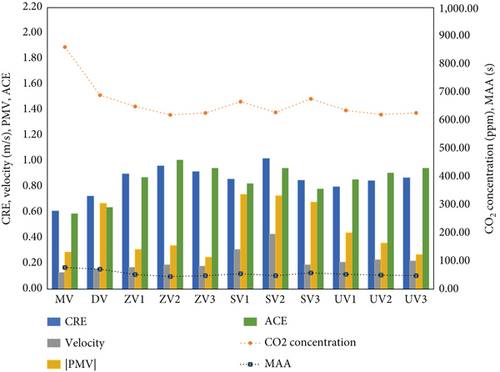
On the contrary, other ventilation models had issues such as high CO2 concentration, inappropriate |PMV| values, low CRE and ACE, or old MAA. For example, some studies have recommended model SV2 in recent years [9, 10, 56], but it has some disadvantages (e.g., thermal discomfort). In this study, model SV2 presented the highest CRE value (1.02), a high ACE value (0.95), a low CO2 concentration (628 ppm), the highest air velocity (0.43 m/s), an unsuitable |PMV| value (0.73), and a relatively young MAA value (48 s). As older people are an extremely vulnerable group, therefore, they need low |PMV| values [2, 5]. −0.5 < PMV < +0.5 is recommended to be applied to new buildings and renovation projects, and −0.7 < PMV < +0.7 is only recommended to be applied to existing buildings [55]. Therefore, by comprehensively comparing CRE, velocity, PMV, CO2 concentrations, ACE, and MAA, model ZV2 showed the best ventilation performance.
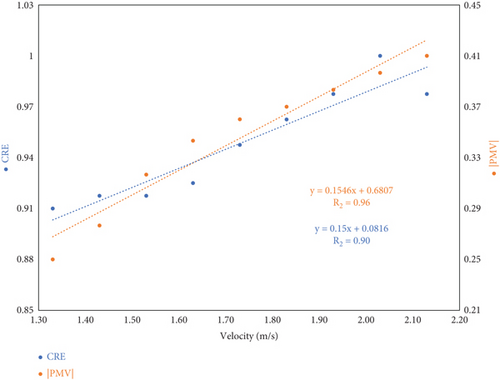
Furthermore, a schematic diagram was created based on model ZV2, adjusting the air velocity at the air inlets to monitor changes in CRE and |PMV| in the sitting breathing zone (Figure 10). The equation relating air inlet velocity to CRE was derived as y = 0.15x + 0.0816 (R2 = 0.90), and the equation relating air inlet velocity to |PMV| as y = 0.1546x + 0.6807 (R2 = 0.96). Under the condition in the experimental room in this paper, the inlet air velocity of approximately 1.53–1.73 m/s will achieve a high CRE (0.93–0.96) in the sitting breathing zone while also providing a comfortable |PMV| (0.30–0.34). It has also been found that comfortable low |PMV| and high CRE are contradictory, and a trade-off exists according to the personalized thermal comfort of older people in different ECCs.
Reviewing past studies conducted in similar indoor environments such as classrooms and offices with seated people, some of our research findings were found to align with these previous studies. However, previous studies did not examine ventilation scenarios for model ZV2 with wall outlets at 1.1 m and ceiling inlets, and they usually only consider one breathing height. Previous studies have shown the effectiveness of ventilation systems such as ZV, UV, and SV, when compared to MV. Research shows that the strategic placement of air inlets, outlets, and their relationship to pollution sources is crucial for optimizing airflow distribution, pollutant removal, and thermal comfort. For instance, Li et al. [20] demonstrated that particle removal efficiency decreases as the distance between source and air outlet increases. ZV effectively reduces cross-infection risk in crowded spaces. Al-Rikabi et al. [27] showed that UV outlets positioned 1.05–1.3 m above the floor can effectively remove indoor air pollutants. Furthermore, Ren et al. [9] found that compared to MV, the average indoor air velocity increased by 12.5% with ZV, 31.3% with DV, and a significant 43.8% with SV. In addition, compared to MV, the average pollutant concentrations in the breathing zone were reduced by approximately 59.3% for ZV, 56.1% for SV, and 10.3% for DV, respectively.
Additionally, the previous studies also found some useful results that are not suitable for ECC multipurpose rooms. For example, Arjmandi et al. [17] found that placing the inlets and outlets on the floor and ceiling of each student and teacher area in a classroom can effectively improve the air quality in each occupied area. However, this approach is not suitable for multipurpose rooms in ECCs requiring flexible space usage and is also expensive. Apart from classrooms and offices, aircraft are also crowded locations [26]. Personalized ventilation design can be implemented in aircraft seating areas, but this is also expensive and not feasible for widespread use in ECCs targeting diverse income populations globally.
Hence, considering the factors of airflow, CO2 concentration, CRE, ACE, MAA, and PMV, model ZV2 was the most suitable ventilation type for the densely occupied ECC multipurpose room. This type of ventilation is worth considering in ECCs in countries with varying income levels globally. It is easy to install, cost-effective, and applicable to various small to medium-sized multipurpose rooms.
4. Conclusions and Future Outlook
- •
Considering the airflow, CO2 concentration, CRE, ACE, MAA, and PMV, model ZV2 with wall outlets at sitting height and ceiling inlets was suggested to be the most suitable ventilation type for ECC multipurpose rooms. This ventilation design maintained a high level of air quality for seated elderly residents without disrupting residents’ activities or the caregivers’ work.
- •
Model ZV2 presented the lowest pollutant concentrations in the breathing zone and showed a smaller fluctuation in pollutant levels across different rows. In comparison to model ZV2, the CO2 concentrations in the breathing zone of models MV, DV, ZV1, ZV3, SV1, SV2, SV3, UV1, UV2, and UV3 increased by 38.9%, 11.3%, 4.8%, 1.1%, 7.6%, 1.5%, 9.2%, 2.6%, 0.2%, and 1.1%, respectively.
- •
Models UV2 and SV2 are potential alternatives to model ZV2. However, their ventilation effectiveness is more easily affected by furniture placement and occupant positions compared to model ZV2, which could negatively impact IAQ.
- •
A trade-off exists between CRE and thermal comfort. The air inlet velocity should be adjusted according to the personalized thermal comfort of older people in different ECCs.
- •
The first-row seats consistently showed low pollution concentrations across all studied ventilation models. Thus, occupants should prioritize using first-row seats when they are available.
This is the first study to investigate ventilation and air quality of ECC crowded spaces, considering both the sitting and standing heights. The findings provide valuable insights for the global community, designers, older people, and other stakeholders. The results are applicable to small and medium-sized ECC multipurpose rooms across countries with varying economic contexts. Moreover, the findings can benefit spaces requiring ventilation optimization at both standing and sitting heights (e.g., restaurants, classrooms, conference rooms, public transportation, and hospital waiting areas). Future research can be included: (1) Building design: Examine various room heights and shapes beyond the single-room scope. (2) Climate conditions: Evaluate ventilation performance across different climate zones. This study was limited to a subtropical monsoon climate zone. In cases of extreme climate conditions or poor outdoor air quality, additional measures may need to be taken (e.g., air purification systems). (3) Usage patterns: Investigate ventilation solutions for various activities (e.g., lectures, rehabilitation training, and extremely crowded events), and quantify occupancy limits for the corresponding standing and seated participants.
Conflicts of Interest
The authors declare no conflicts of interest.
Author Contributions
Huai-Wen Wu: conceptualization, resources, methodology, writing–original draft, writing–review and editing. Prashant Kumar: conceptualization, funding acquisition, resources, methodology, supervision, project administration, writing–original draft, writing–review and editing. Chang Xi: writing–review and editing. Junwei Ding: writing–review and editing. Shi-Jie Cao: conceptualization, funding acquisition, resources, methodology, supervision, project administration, writing–original draft, writing–review and editing.
Funding
PK acknowledges the support from the EPSRC-funded CO-TRACE project (COVID-19 Transmission Risk Assessment Case Studies–Education Establishments; EP/W001411/1), which later transitioned into the SAMHE program (Schools’ Air Quality Monitoring for Health and Education), as well as from the INHALE (EP/T003189/1), RECLAIM Network Plus (EP/W034034/1), and NERC-funded GreenCities (NE/P016510/1) projects.
Acknowledgments
The authors thank Nanjing Xiangshan elderly care center for their help during the measurement period.
Open Research
Data Availability Statement
The data used in this manuscript will be made available on request.


