Study on the Sterilization Performance of Photocatalysts Used in Indoor Air Purification
Abstract
In the past decade, the application of photocatalytic sterilization technology for indoor air disinfection has been extensively investigated. However, selecting suitable photocatalysts with high sterilization efficiency remains a challenge. By doping and incorporating metals, the bandgap can be narrowed, thereby avoiding the recombination of photogenerated charges. This study compares the photocatalytic sterilization performances of three commonly used photocatalysts (TiO2–Ag, MnO2–TiO2, and MnO2–CeO2) in a controlled laboratory setting. The results demonstrated that TiO2–Ag exhibited the best sterilization performance. Within 20 min, the concentration of Serratia marcescens (the test bacterium) decreased logarithmically with respect to ln3.78 under a light intensity of 640 W/m2. During the bacterial inactivation process, Serratia marcescens is inactivated by the destruction of its cell membrane, which decreases its enzyme activity and releases its cell contents. This can be attributed to the efficient generation of reactive oxygen species (O2•– and •OH) and the thermal effect. Spectral regulation has the most significant impact on the sterilization efficiency of MnO2–TiO2, reducing the probability of photocatalytic materials being excited. A significance analysis indicated that light intensity, exposure duration, photocatalyst type, dilution of used photocatalysts, and spectral regulation substantially impact photocatalytic sterilization outcomes. Density functional theory (DFT) was used to elucidate the mechanism for the adsorption and catalysis of bacterial cell membranes at the atomic scale.
1. Introduction
Indoor air pollution is a critical hazard that threatens public health worldwide. Residents are at increased risk of infections, respiratory allergies, and cancers due to airborne microorganisms [1–3]. According to statistical data from the World Health Organization, microbiological infections cause approximately one-third of all global deaths [4]. In the recent COVID-19 outbreak, bioaerosols have severely impacted public health, particularly in enclosed indoor environments [5, 6]. Traditional disinfection techniques, such as ozonation, chlorination, and ultraviolet irradiation, are limited by recolonization and secondary pollution [7, 8]. Photocatalysis is an emerging pathogen disinfection and sterilization method [9, 10] with excellent bactericidal effects and the ability to decompose endotoxins produced by bacteria. It exhibits few side effects and has significant potential for bactericidal and antibacterial activities [11–14]. Matsunaga first introduced TiO2 [15]. However, TiO2, a wide bandgap semiconductor with an estimated energy gap of 3.2 eV, can only be excited by ultraviolet light with a wavelength of ≤ 387.5 nm [16]. Additionally, during the sterilization process, TiO2 tends to cause recombination of photogenerated electron–hole pairs, resulting in relatively low sterilization efficiency. These limitations can be addressed by doping with and incorporating other materials. Such modifications broaden the absorbed wavelength range by narrowing the bandgap and inhibiting charge recombination, leading to enhanced catalytic activity [17–20].
Visible light and near-infrared light constitute the most significant proportion of the solar spectrum; thus, utilizing visible and infrared light to improve TiO2 photocatalytic sterilization is of great significance [21, 22]. A series of studies have been conducted, and the literature provides valuable references for research in this field. For instance, oxygen vacancies induce local surface plasmon resonance effects, and the formation of impurity energy levels reduces the bandgap, resulting in a favorable IR response and acting as a reaction center [23, 24]. Since Ag exhibits good absorption in the infrared spectrum, it is frequently doped with photocatalytic materials. Photocatalytic disinfection using Ag-modified TiO2 has exhibited higher activity than that of pure TiO2 [25]. Kang found that TiO2 doped with Ag demonstrates good photocatalytic activity under infrared light irradiation and can release Ag+ to damage bacterial cell membranes [26]. In conjunction with photocatalysts, silver nanoparticles enhance the photocatalytic efficacy by approximately 100% after 2 h of xenon light exposure by promoting hole–electron pair separation [27]. Activated carbon, with its rich porous structure and high specific surface area, is often used as a doping material for TiO2. Anatase TiO2 (T-WOAC), synthesized using activated carbon templates, exhibited nanoscale crystallite size, small pore diameter, and high specific surface area, achieving exceptional performance in crystal violet degradation (degradation rate of 99.01% and a rate constant of 0.03914 min−1), significantly outperforming pristine TiO2 [28]. Additionally, Ni-doped TiO2 composites anchored on magnetic activated carbon (MAC) achieved rapid degradation of triphenylmethane dyes (90% removal within 10 min) and exhibited excellent recyclability [29]. For TiO2 doped with activated carbon, enhanced photocatalytic performance was driven by nanoscale structural control, optimization of active sites, and improved radical generation efficiency. Metallic oxide, a common dopant, has also attracted researchers’ attention. Metallic oxide provides a thermodynamic basis for TiO2 degradation of pollutants. Photogenerated electrons can be generated by photoexcitation of metallic oxides and transferred to the conduction band (CB) of TiO2 nanotubes. Similarly, photogenerated holes can be transferred from the valence band (VB) of TiO2 nanotubes to metallic oxides. This leads to an improvement in the separation efficiency of photogenerated electrons and holes [30]. Zeng combined TiO2 nanoparticles with mesoporous CeO2, resulting in a 36.4-fold greater efficiency of photocatalytic benzene degradation under argon light than that of pure photocatalytic degradation at room temperature. This was explained by the synergistic mechanism of the photocatalytic reaction on TiO2 and the solar-driven thermal catalytic reaction on CeO2, which increases the catalytic degradation of benzene by CeO2–TiO2 nanocomposites [31]. As a common catalyst, ZnO is a low-cost and environmentally friendly material with inherent antibacterial property. It has a large exciton binding energy of 60 meV, allowing for efficient exciton emission at room temperature. According to construct ZnO/ZnSe/MoSe2 heterojunctions, it has superior utilization efficiency of visible light and higher separation efficiency of photo-induced electron–hole pairs in degrading methyl orange and inactivating bacteria, attributed to enhanced light absorption and improved separation of photogenerated electron–hole pairs [32]. These findings indicate that doping with appropriate metals or metal oxides can effectively overcome the narrow light absorption range of the catalyst and the propensity for hole–electron pair compounding.
The literature has explored the applications of combining photocatalytic materials with building materials in buildings [33–35]. Organic building materials themselves tend to decompose via photocatalytic reactions; however, this combination reduces photocatalytic activity and decreases structural strength [36]. Yu and his team [37–39] innovatively used Trombe walls by implementing photocatalysis to improve the indoor air quality. They constructed a Trombe wall to study the photocatalytic degradation efficiency of formaldehyde, demonstrating that coating the Trombe wall with photocatalytic materials has significant potential for indoor air purification. However, the efficiency of traditional TiO2 photocatalytic purification is not high [40]. Moreover, few studies have focused on controlling airborne microorganism concentrations via photocatalysis. Nitrogen oxides (NOx) and volatile organic compounds (VOCs) have been frequently investigated as representative air pollutants in recent studies [41–43]. As microorganisms and bioaerosols can negatively impact indoor air quality, there is an urgent need to explore the use of photocatalysis for purifying microorganisms and improving the effectiveness of photocatalytic sterilization. However, the factors and optimization methods that influence the efficiency of photocatalytic sterilization and their interactions are unclear.
The study reported in this paper was aimed at optimizing TiO2 photocatalytic sterilization. Three catalytic materials, TiO2–Ag, MnO2–TiO2, and MnO2–CeO2, were used to investigate the improvement of photocatalytic sterilization efficiency by doping different metals. Potential photocatalytic sterilization mechanisms were analyzed and discussed based on the experimental results. This work sheds light on the use of metal incorporation in biohybrid photocatalysis for efficient antibacterial reactions. The results of this study will contribute to improving the efficiency of photocatalytic sterilization in indoor air quality control and provide a foundation for research using Serratia marcescens as a tracer microorganism.
2. Experimental Methods
2.1. Preparation of the Catalytic Material
2.1.1. TiO2–MnO2
Several preparation steps were conducted to synthesize TiO2 and MnO2 nanocomposites. First, TiO2 was added to a solution of NaOH, and then, the mixture was stirred for an hour. Second, the mixture obtained from the first step was transferred to a hydrothermal reactor, which was heated to 180°C for 72 h. The third step involved cooling the sample to room temperature, after which it was filtered and washed thoroughly. For the final step, the processed sample was dried at 60°C for 12 h and calcined at 600°C for 4 h to produce the desired TiO2 nanoribbons. These nanoribbons were then dissolved in deionized water along with Mn(NO3)2·6H2O, maintaining a 9:1 mole ratio. After continuous stirring for 12 h, the samples were dried at 120°C for 10 h. The dried samples were ground into powder and calcined in air at 550°C for 3 h before cooling to room temperature, ultimately producing TiO2 and MnO2 nanocomposites.
2.1.2. MnO2–CeO2
The initial step in the synthesis process involved preparing a mixed solution containing Mn(NO3)2·6H2O, KMnO4, and (NH4)2Ce(NO3)6. This mixture was stirred to achieve a uniform suspension solution before being sealed. The specific molar ratio of these three chemical reagents was maintained at 3:2:5. Subsequently, a 2 M KOH solution was added dropwise to the mixed solution at 50°C until the resulting mixture reached a pH of 10.5 under vigorous stirring. The precipitate was further aged at 50°C for 2 h, followed by filtration and washing. Finally, the obtained materials were heated at 110°C for 12 h and calcined at 500°C for 6 h in air, yielding the desired catalysts.
2.1.3. TiO2–Ag
TiO2 was added to deionized water and stirred until completely dissolved. Dilute nitric acid was then added, and the mixture was magnetically stirred at 60°C for 30 min to obtain a TiO2 solution. A silver nitrate solution with a molar ratio of 3:7 was added to the TiO2 solution. After stirring for another 30 min, the ammonia solution was slowly added until the precipitate disappeared. Subsequently, an ethanol solution was added, and stirring continued at 65°C for 3 h to produce a TiO2–Ag solution mixture. The resulting solution mixture was vacuum-dried and ground into the desired catalysts.
2.2. Reagents and Instruments
The reagents used in this study were provided by Nanjing Xianfeng Nano Technology Co. Ltd. The equipment utilized included a full temperature shaker (HZQ-F110, Harbin Donglian Electronic Technology Development Co. Ltd.), an SW-CJ-2FD ultraclean workbench (Jiangsu Sujing Antai Co. Ltd.), an SHP-250Y biochemical constant temperature incubator (Shanghai Jinghong Laboratory Equipment Co. Ltd), a 300 W xenon light source (CME-Sol 8050-3A, Microenerg Beijing Technology Co. Ltd.), a DHG-9070A blast drying oven (Shanghai Jinghong Laboratory Equipment Co. Ltd.), and a vertical high-pressure steam sterilizer (LDZX-50KBS, Shanghai Shen’an Medical Equipment Factory). X-ray diffraction (XRD) was performed on an Ultima IV instrument (Japanese Science) at 25°C with a 2θ rate of 2° min−1. Scanning electron microscopy (SEM) images were obtained using a JSM-7500F emission scanning electron microscope (Japan Electronics). Distilled water was used in all experiments. S. marcescens was chosen as the target microorganism for sterilization. A six-stage Andersen bioaerosol sampler (Beijing Huayitongtai Environmental Technology Co. Ltd., China) was employed to collect airborne bacterial samples from the outlet of the experimental chamber. The sampler operated at a calibrated flow rate of 28.3 L/min and was equipped with nutrient agar plates at each stage to capture bioaerosols by size fraction. Sampling was conducted at regular time intervals to evaluate bacterial concentration decay over time.
2.3. Spectral Control
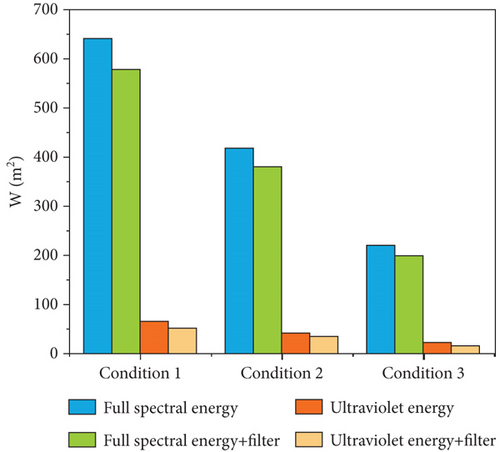
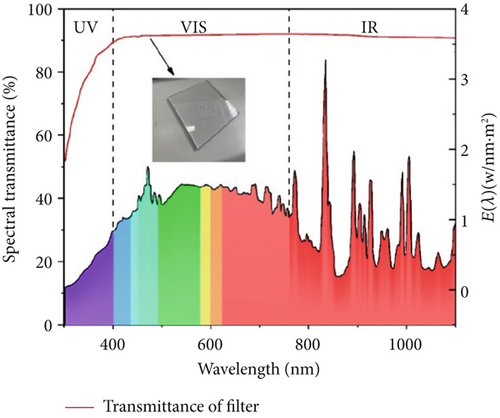
To test the sterilization efficiency of the catalytic materials under different spectral conditions, a high borosilicate glass (k = 1.005 W/m∙k) was used to control the spectrum. The light intensity settings for this experiment are shown in Figure 1a. The setting values of the light intensity are 640, 420, and 220 W/m2, and after using the filter, they are 580, 380, and 200 W/m2, respectively. Figure 1b shows the xenon light’s energy and the filter’s spectral transmittance within the spectral range. The ultraviolet energy constitutes 10% of the total spectral energy. The spectral transmittance of the filter is 74.8% in the ultraviolet range and 92.6% in the visible and infrared ranges.
2.4. Sterilization Experiment
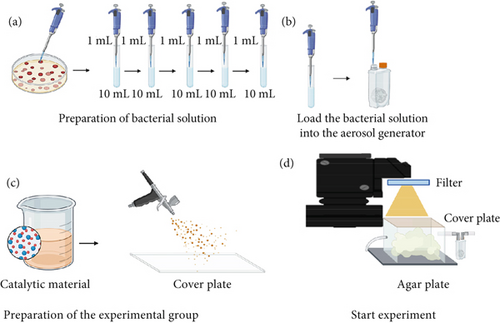
To maintain consistent experimental conditions, an air conditioning system was used to maintain the temperature at 25 ± 1°C and the humidity at 60% ± 10% RH, which guaranteed that the experimental results were not affected by any fluctuations in temperature or humidity [44]. The experimental setup comprised a transparent chamber with dimensions of 30 × 10 × 10 cm. The chamber’s cover plate could be replaced to investigate the influence of catalysts on sterilization efficiency. Different concentrations of catalytic materials were applied to the cover plate to examine their effects on sterilization efficiency. Three catalysts (TiO2–Ag, MnO2–TiO2, and MnO2–CeO2) were diluted to 1000, 200, and 100 ppm, respectively. The original bacterial solution was diluted with physiological saline five times until the bacterial solution reached a 10−5 gradient concentration of the original bacterial solution. The bacterial solution was then loaded into the aerosol generator. A xenon light served as the light source. For cases requiring filters to investigate the effect of spectral screening on sterilization, high borosilicate glass, as mentioned earlier, was used as a filter. The light intensity was set at 640, 420, and 220 W/m2, and after using the filter, it was set at 580, 380, and 200 W/m2, respectively. Figure 2 shows the steps of the experiment and the experimental facility. Similar to some researchers [45, 46], S. marcescens was selected as the preliminary strain for the experiment. This Gram-negative, rod-shaped, facultatively anaerobic bacterium is widely found in aquatic environments, soil, and indoor air. Notably, it is capable of producing distinctive red, dendritic colonies within 24–36 h of incubation at temperatures between 20°C and 35°C, making it a commonly used model organism in indoor air quality research. To further evaluate the broader applicability and robustness of the catalytic materials, supplementary experiments were conducted to assess their disinfection performance against additional common indoor pathogens, including Staphylococcus aureus, Escherichia coli, and Bacillus pumilus. It is important to note that this supplementary evaluation was carried out under a single representative condition, aimed at validating the general effectiveness of the catalytic material across diverse microbial species.
For the control group, the test process needs to be carried out in the dark to eliminate the effects of photocatalysis on the control group. The other conditions were the same as those in the experimental group. All the experimental group and control group tests were conducted in triplicate. All the data reported in this study are the mean values of three replicates.
3. Results
3.1. Material Characterization
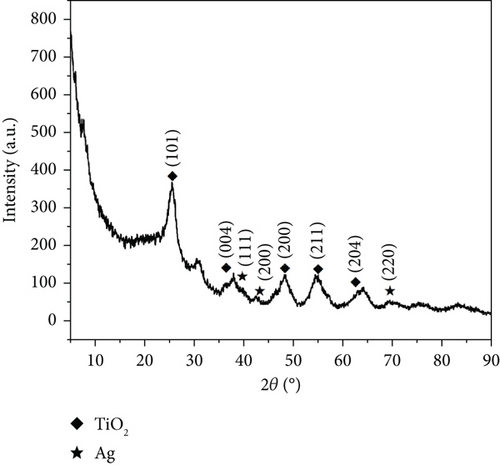
Figure 3a displays the XRD pattern of TiO2–Ag. After analyzing the XRD pattern, TiO2 (anatase) and Ag were found to match well, confirming the existence of TiO2 (anatase) and Ag. In Figure 3a, the TiO2 (atase) characteristic diffraction peak appeared relatively broad and less defined with more burrs, indicating poor crystallinity. Moreover, the characteristic peak of Ag was relatively small, suggesting a low abundance.
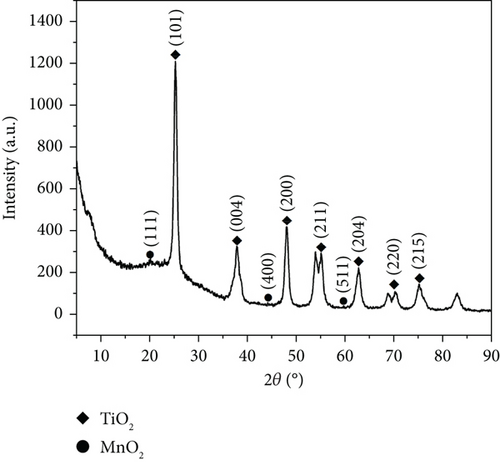
As depicted in Figure 3b, the two substances, TiO2 (anatase) and MnO2, matched well after examining the XRD pattern. The TiO2 (anatase) characteristic diffraction peak was sharper and displayed a better peak shape than that in Figure 3b, suggesting that the anatase lattice was complete and possessed higher crystallinity and fewer defects. Additionally, the central peak of MnO2 was broader and less defined than that of MnO2, as shown in Figure 3a, indicating a lower content and poorer crystallinity.
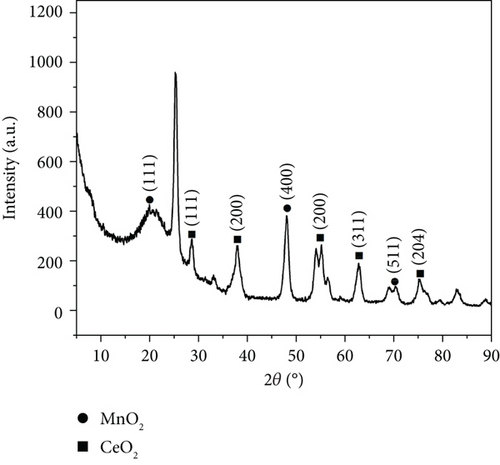
Figure 3c shows the XRD pattern of MnO2–CeO2. After searching the XRD pattern, MnO2 and CeO2 were found to match well. The plots show that for the CeO2 material with a face-centered cubic structure, the characteristic peaks of CeO2 were sharper, and the lattice was complete with high crystallinity. The main peak of MnO2 was significantly more abundant than that in Figure 3b.
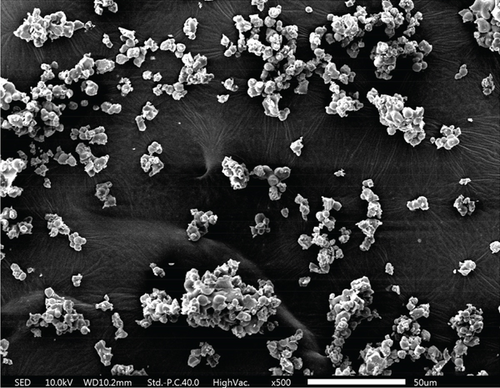
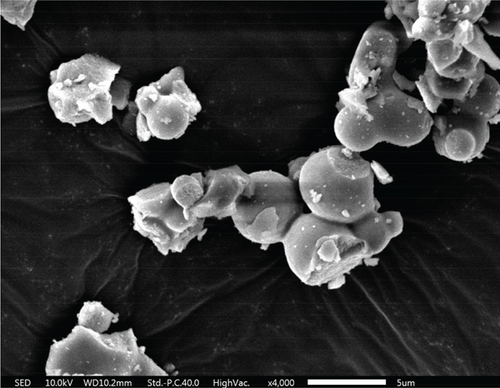
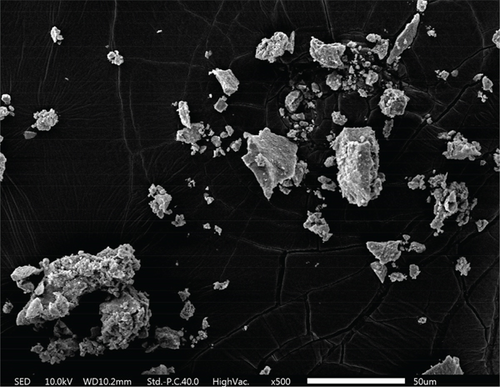
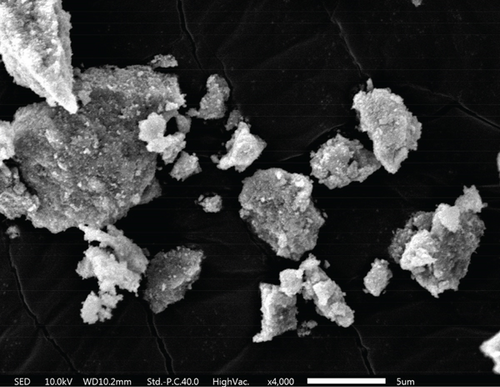
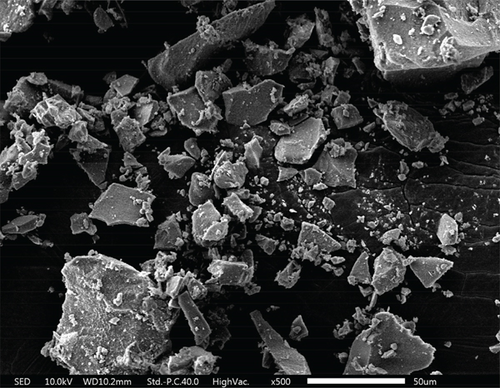
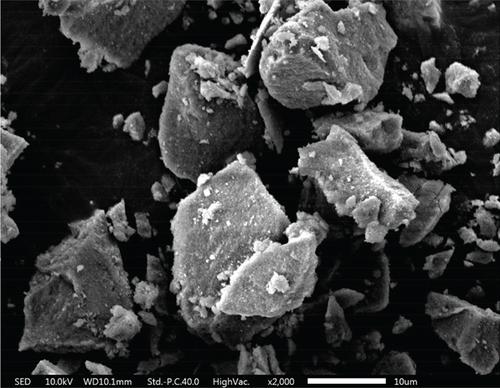
As shown in the SEM images in Figure 4, all three materials possess a mesoporous structure. Each composite is formed by the accumulation of nanoparticles. Among these composites, TiO2–Ag particles are agglomerated into irregular spheres with diameters ranging between 2 and 5 μm. The surface of these spheres is relatively smooth, and scattered Ag particles can be seen from the cross-sectional part of the spheres. The MnO2–CeO2 composites are composed of stacked nanoparticles, and the samples are uniformly distributed with disordered interparticle pores.
3.2. Control Group Results
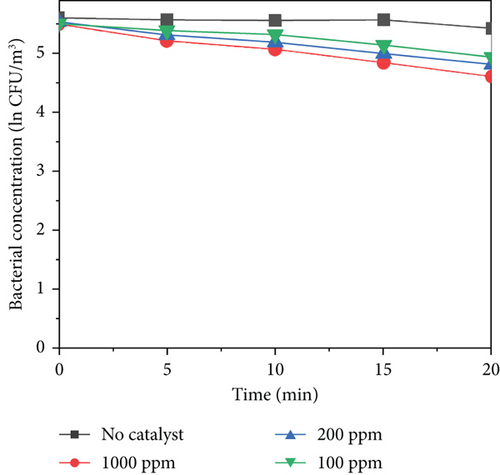
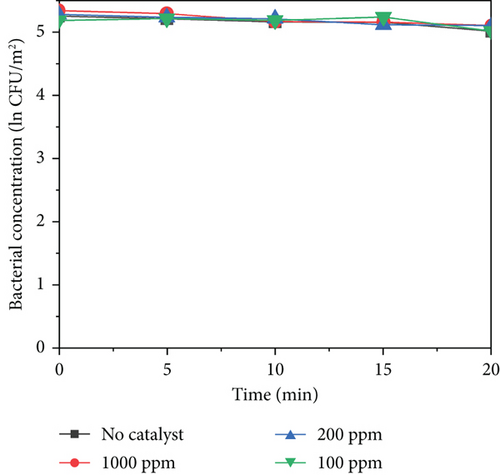
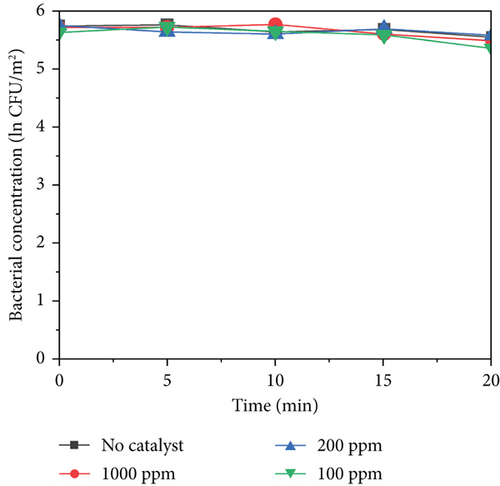
All the experimental group and control group tests were conducted in triplicate. All the data reported in this study are the mean values of three replicates. As shown in Figure 5b,c, MnO2–TiO2 and MnO2–CeO2 at different concentrations do not exhibit significant bacterial inactivation because the bacterial concentration remains almost constant for 20 min. This indicates that MnO2–TiO2 and MnO2–CeO2 have no harmful effects on bacteria. In contrast, Figure 5a shows that TiO2–Ag caused a reduction in the bacterial concentration within 20 min, with 1000 ppm TiO2–Ag reducing ln0.88 CFU/m2, 200 ppm reducing ln0.61 CFU/m2, and 100 ppm reducing ln0.56 CFU/m2. This is likely due to the adsorption of the protease of the bacterial body and rapid binding to it, destroying the protease of the bacterial body, making it unable to breathe and becoming inactive, leading to bacterial death. When silver ions (Ag+) inactivate bacteria, silver ions are released from the bacterial body and then come into contact with other colonies. This process is repeated, accounting for the persistence of silver sterilization.
3.3. Photocatalysis Bacterial Inactivation Efficiency
3.3.1. TiO2–Ag Bacterial Inactivation Efficiency
Figure 6 shows the results of sterilization at different concentrations of TiO2–Ag under light intensities of 640, 420, and 220 W/m2. As shown in Figures 6a, 6b, and 6c, when no catalyst was added, there was no significant decrease in the concentration of bacteria within 20 min, indicating that light alone cannot inactivate S. marcescens. However, when a catalyst is added, the concentration of bacteria continuously decreases at a light intensity of 640 W/m2. After 20 min, the concentration of bacteria decreased by ln3.78 at 1000 ppm, ln3.53 at 200 ppm, and ln3.29 at 100 ppm. This indicates that higher catalyst concentrations lead to better sterilization effects under the same light intensity conditions. Compared with that of the control group, the sterilization efficiency of TiO2–Ag significantly improved after illumination. In addition to being able to sterilize the material, it is also undergoing photocatalytic sterilization. The reduction in the bacterial concentration was slower for light intensities of 420 and 220 W/m2. At 420 w/m2, the bacterial concentration decreased ln3.08 at 1000 ppm, ln2.75 at 200 ppm, and ln2.49 at 100 ppm. At 220 W/m2, the bacterial concentration decreased ln1.54 at 1000 ppm, ln1.38 at 200 ppm, and ln1.32 at 100 ppm, respectively. This indicates that sterilization efficiency is influenced by light intensity. There is a positive correlation between the concentration of catalytic materials and the effect of light intensity on sterilization efficiency. This is because the probability of excited photocatalytic materials is reduced under low light intensity. As shown in Figure 6a, the sterilization efficiency under different light intensities decreased after the addition of a filter. The sterilization efficiency reduction is most evident at high light intensity (640 W/m2) under different catalyst concentrations, with bacterial reduction values of ln3.31 at 1000 ppm, ln2.94 at 200 ppm, and ln2.41 at 100 ppm. After Ag doping, the reduction in sterilization efficiency was far less than that after UV irradiation, demonstrating that TiO2–Ag can also undergo photocatalytic reactions in the visible light range. After the addition of a filter, the intensity of ultraviolet light decreased. Although doping with Ag reduces the bandgap and increases the spectral response range, the spectral selection of the filter in the ultraviolet range still affects the sterilization efficiency. Therefore, improving the spectral response of photocatalytic materials will remain a priority in subsequent work.
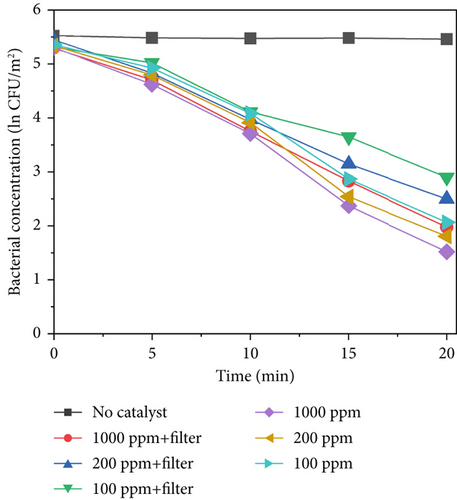

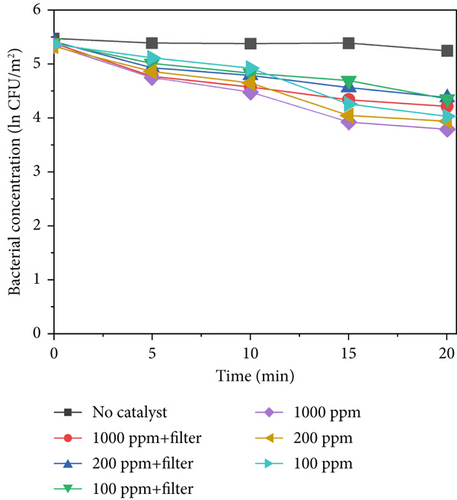
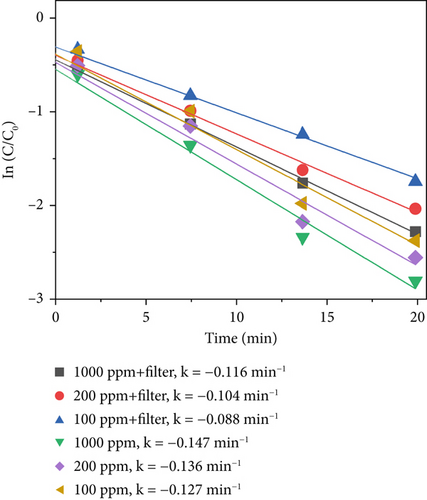
The average value was used to plot the sterilization efficiency curve under different light intensities. The slope of the curve corresponds to the apparent kinetic rate constant k, given by Equation (1), which can be considered a standard for the sterilization rate under different conditions. Here, C0 and C represent the S. marcescens concentrations at the initial time and at time point t, respectively. Figure 6d displays the sterilization efficiency of different material concentrations with and without filters. The sterilization efficiency of 1000 ppm TiO2–Ag without a filter was the highest at a 640 W/m2 light intensity (k = −0.147 min−1). The sterilization efficiency of TiO2–Ag at 1000 ppm with a filter was worse than that at 100 ppm without a filter. For TiO2–Ag, controlling the spectrum had a more significant impact on the sterilization efficiency than controlling the material concentration. Therefore, when using TiO2–Ag for sterilization, it is more important to focus on the intensity of the light and the spectral range. At the same time, the material concentration can be moderately reduced. These results suggest that TiO2–Ag is an excellent photocatalyst for bacterial inactivation.
3.3.2. TiO2–MnO2 Bacterial Inactivation Efficiency
Figure 7 shows the sterilization results for different TiO2–MnO2 concentrations at 640, 420, and 220 W/m2 light intensities. Compared with that in the control group, the concentration of bacteria decreased significantly, indicating that TiO2–MnO2 can undergo a catalytic reaction. As shown in Figures 7a, 7b, and 7c, at 640 W/m2, after 20 min, the bacterial concentration decreased to ln3.38 at 1000 ppm, 2.40 at 200 ppm, and ln1.99 at 100 ppm when the light intensity was 640 W/m2 without a filter. At 420 W/m2, the bacterial concentration decreased ln2.70 at 1000 ppm, ln2.36 at 200 ppm, and ln1.96 at 100 ppm. At 220 W/m2, the bacterial concentration decreased ln1.10 at 1000 ppm, ln0.93 at 200 ppm, and ln0.91 at 100 ppm. Compared with that of TiO2–Ag, the sterilization efficiency of TiO2–MnO2 is lower because TiO2–Ag has sterilization characteristics. Before 10 min, the bacterial concentration did not decrease significantly. This is because the type of dopant, concentration, and morphological/microstructural features of the modified TiO2 photocatalysts significantly affect sterilization efficiency. Dopants with MnO2 replace Ti4+ ions in the TiO2 lattice, leading to structural defects, including vacancies, on the surface of photocatalysts. Consequently, it takes some time to initiate the photocatalytic sterilization reaction. The experimental results revealed that the photocatalytic reaction of the TiO2–MnO2 material occurred after 10 min of irradiation. Doping with MnO2 may cause more oxygen atoms (under UV irradiation) to escape from the lattice structure, preventing electron–hole recombination, increasing the number of photogenerated holes, and producing more hydroxyl radicals [20, 47]. This demonstrates the photocatalytic inactivation pathway of S. marcescens by TiO2–MnO2. TiO2–MnO2 generated abundant and effective electron–hole pairs and induced reactive oxygen species (ROS), such as •O2– and •OH. Although S. marcescens could defend against a minor amount of ROS through its antioxidant system at the early inactivation stage, a series of nonselective attacks caused by ROS occurred after the cell’s self-protection system was destroyed. The membrane integrity and functions (e.g., cell respiration and metabolism) are gradually lost, which results in the oxidation and leakage of cytoplasmic substances (e.g., K+, lipids, proteins, and DNA/RNA), ultimately resulting in cell death [9, 11, 48].
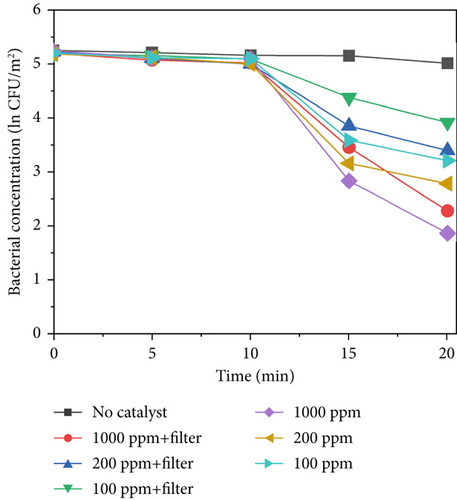
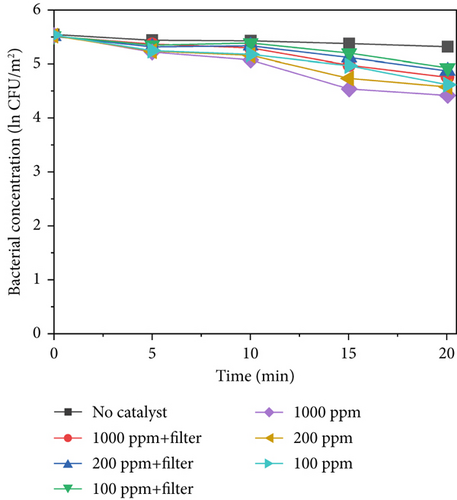
After adding the filter, the bacterial concentration decreased to ln2.92 at 1000 ppm, ln1.82 at 200 ppm, and ln1.27 at 100 ppm under 640 W/m2 light intensity. Compared with TiO2–Ag, TiO2–MnO2 is more sensitive to concentration and has more differences. As shown in Figures 7a, 7b, and 7c, the difference between the different concentrations of TiO2–MnO2 at 20 min was significant. This suggests that the modification enhances the absorption of visible light and promotes the transfer of photogenerated carriers. When the TiO2–MnO2 composite is exposed to full-spectrum light, even slight changes in overall illumination intensity can produce differences in photocatalytic activity because the system has more room to respond to varying intensities across a broader spectral range.
Under low light intensity, the generation of electron–hole pairs within TiO2–MnO2 is limited by the insufficient photon flux, meaning there are fewer excited charge carriers available to form ROS responsible for microbial inactivation; as a result, the addition of more catalyst material beyond a certain minimal amount cannot significantly increase sterilization efficiency since the process is already constrained by the low number of photons rather than the number of active sites. In contrast, at high light intensity, a larger photon flux creates a surplus of electron–hole pairs that can be efficiently converted into reactive species only if there are enough active sites available; under these conditions, increasing the catalyst concentration directly boosts the production of these species, thereby enhancing sterilization efficiency and making the system much more sensitive to changes in material concentration.
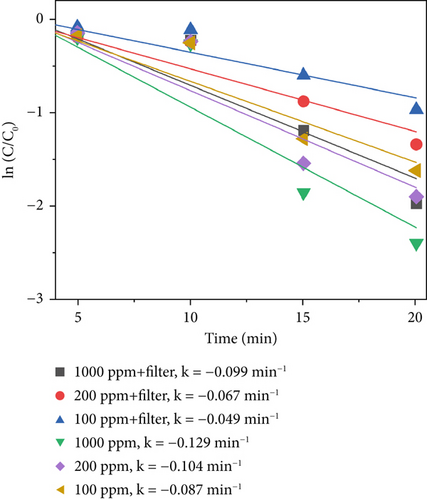
Figure 7d presents the sterilization efficiency of different material concentrations with and without filters. The sterilization efficiency of 1000 ppm TiO2–MnO2 without a filter was the highest (k = −0.129 min−1). At concentrations of 200 and 100 ppm without a filter, the sterilization efficiencies are k = −0.104 min−1 and k = −0.087 min−1, respectively. After adding the filter, the sterilization efficiency decreased to k = −0.099 min−1, k = −0.067 min−1, and k = −0.049 min−1 at 1000, 200, and 100 ppm, respectively.
3.3.3. MnO2–CeO2 Bacterial Inactivation Efficiency
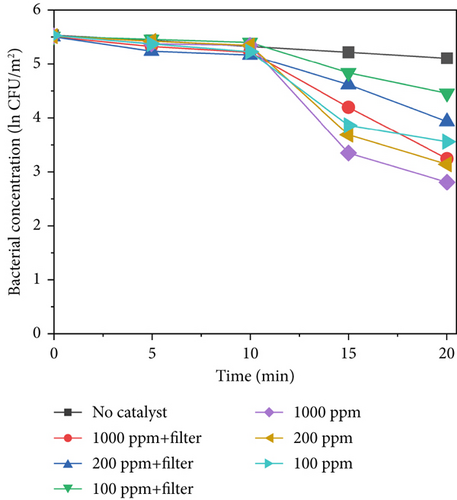
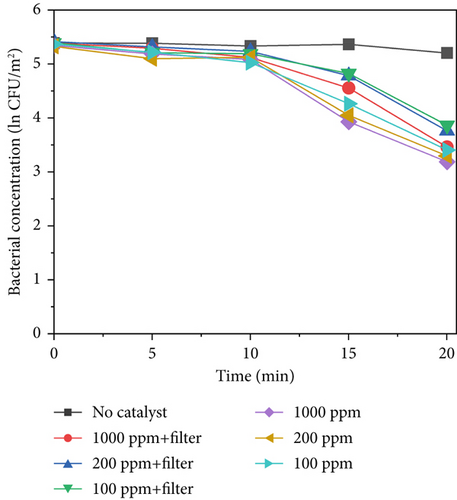
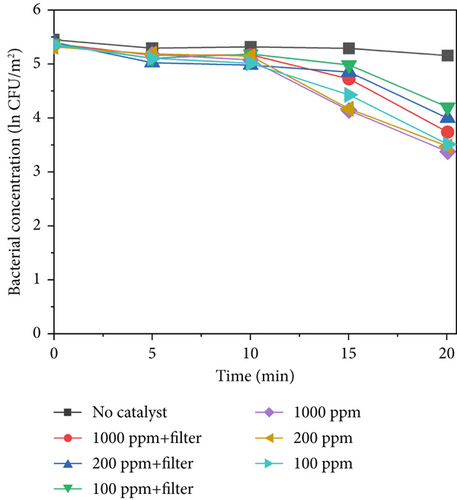
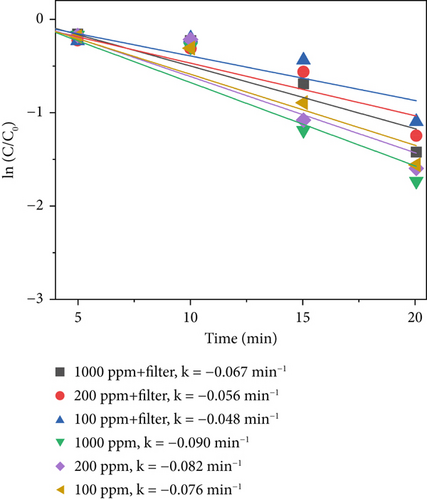
MnO2–CeO2 is considered a thermal catalytic material and does not undergo a photocatalytic reaction. When combined with bacteria, thermocatalytic materials can effectively destroy the integrity of bacterial cell membranes through infrared-triggered heat therapy, converting infrared radiation into heat and achieving photothermal conversion, using high temperatures to purify microorganisms [9, 49]. Figure 8 shows the sterilization results of MnO2 and CeO2 at different concentrations of 640, 420, and 220 W/m2 light intensity. At a concentration of 640 W/m2, at 20 min, the bacterial concentration decreased ln2.14 at 1000 ppm, ln2.02 at 200 ppm, and ln1.95 at 100 ppm. At concentrations of 420 and 220 W/m2, the reduction in the bacterial concentration decreased. At a concentration of 420 W/m2, the bacterial concentration decreased to ln1.95 at 1000 ppm, ln1.84 at 200 ppm, and ln1.73 at 100 ppm. At 220 W/m2, the bacterial concentration decreased to ln 1.09 at 1000 ppm, ln0.93 at 200 ppm, and ln0.88 at 100 ppm. After adding the filter, the sterilization efficiency does not decrease as much as that for TiO2–Ag and TiO2–MnO2. The modulation of the spectra for the filter does not significantly reduce the total radiation intensity. Thus, thermocatalytic materials can still inactivate bacteria.
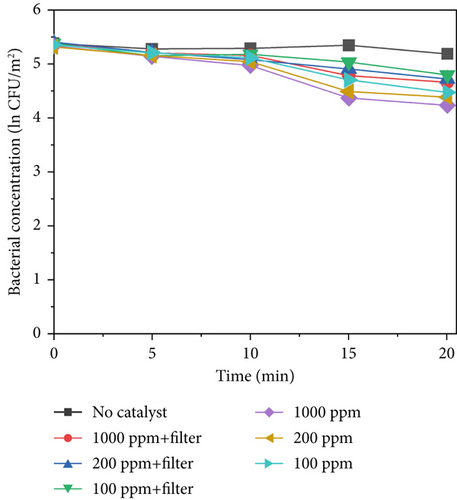
The size and surface roughness of the material can impact the sterilization effect. The wrinkling of the material facilitates the capture of bacteria with a matching diameter [50]. As depicted in Figure 4e,f, it can be speculated that adsorption occurs between the catalyst and the cells, which enhances the sterilization performance of the catalyst.
Figure 8d displays the sterilization efficiency of different material concentrations with and without filters. The sterilization efficiency of 1000 ppm MnO2–CeO2 without a filter was the highest (k = −0.090 min−1). At concentrations of 200 and 100 ppm without a filter, the sterilization efficiencies are k = −0.082 min−1 and k = −0.076 min−1, respectively. After adding the filter, the sterilization efficiency decreased to k = −0.067 min−1, k = −0.056 min−1, and k = −0.048 min−1 at 1000, 200, and 100 ppm, respectively.
Figure 9 shows the temperature of the three materials after being illuminated for 5 min. As previously mentioned, the temperature of the thermocatalytic MnO2–CeO2 catalyst was the highest. The increase in temperature is due to the higher absorption of the spectra by MnO2–CeO2. When heat is absorbed, heat increases, causing bacterial death. As a composite catalytic material, MnO2–CeO2 typically exhibits lower quantum efficiency (i.e., the conversion efficiency of photogenerated carriers into chemical energy) compared to conventional photocatalytic materials. This is primarily due to the band alignment between MnO2 and CeO2 within MnO2–CeO2, which often fails to form an optimal step-like structure (such as a Z-scheme or heterojunction), resulting in an inadequate driving force for photogenerated electron transfer. Additionally, the limited ability to tune the bandgap of MnO2–CeO2 hinders significant improvement in visible light absorption. Moreover, its surface contains relatively few active sites, rendering it less suitable for complex photocatalytic reactions. While the combination of MnO2 and CeO2 does capitalize on the redox properties of MnO2 and the oxygen vacancy regulation capacity of CeO2 to some extent, challenges such as a wide bandgap, low surface reaction activity, and poor quantum efficiency restrict its potential in photocatalytic applications. Consequently, MnO2–CeO2 is primarily employed in thermocatalysis or other catalytic processes rather than in advanced photocatalytic applications.

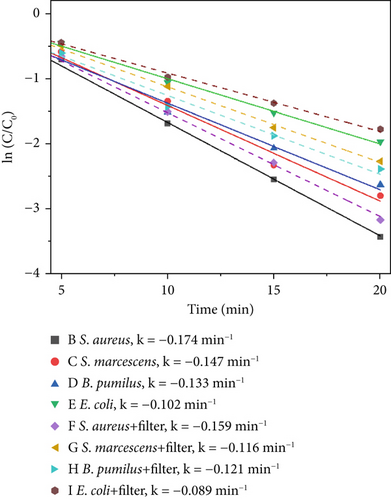
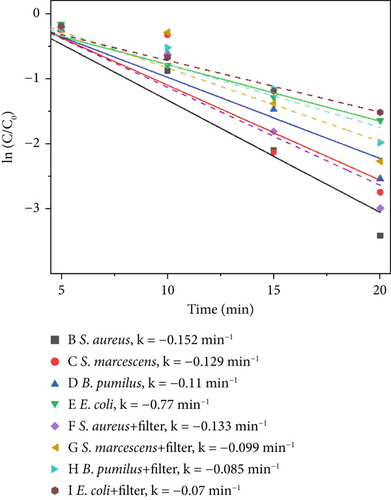
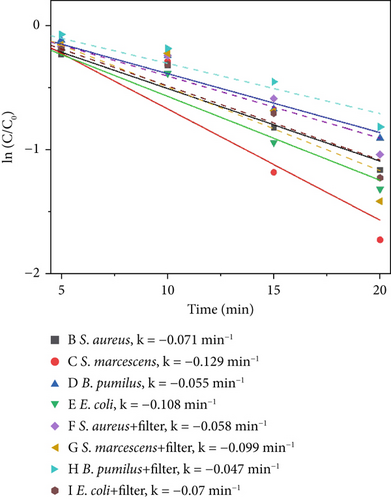
To evaluate the broader applicability of the proposed catalytic material beyond the primary indicator microorganism (S. marcescens), supplementary experiments were conducted under 640 W/m2 light intensity, 1000 ppm catalyst concentration, which represents the optimal catalytic conditions. Evaluating the antimicrobial efficacy at this high-performance condition provides a clear and practical benchmark to assess whether the catalytic material demonstrates consistent broad-spectrum effectiveness across different microbial species. Three additional microorganisms commonly found in indoor environments were selected: S. aureus, B. pumilus, and E. coli. These supplementary tests were aimed at verifying whether the catalytic material maintains effective antimicrobial activity across diverse microbial species. Results under these consistent experimental conditions are intended to reinforce the generalizability of the primary findings obtained from extensive tests with S. marcescens. Figure 10 illustrates the disinfection efficiencies of the three materials against S. aureus, S. marcescens, B. pumilus, and E. coli. As shown in Figure 10a,b, S. aureus exhibits the highest sensitivity to the photocatalytic materials, while E. coli demonstrates the lowest inactivation rate within the first 20 min among the four tested microorganisms. The comparatively lower photocatalytic disinfection efficiency observed for E. coli during the initial 20-min period can be attributed to several factors. Most notably, the bacterium’s outer membrane, which is rich in lipopolysaccharides (LPS), acts as a protective barrier against oxidative stress. In addition, the presence of extracellular polymeric substances (EPSs) may further shield the bacterial cells from immediate catalytic oxidation. Together, these structural defenses contribute to E. coli’s relatively reduced short-term susceptibility to photocatalytic disinfection. In contrast, S. aureus lacks an outer lipid membrane and contains abundant negatively charged teichoic acids in its cell wall, rendering it more vulnerable to rapid ROS attack and resulting in the highest short-term inactivation efficiency. S. marcescens displays intermediate sensitivity due to its thinner outer membrane compared to E. coli, offering only partial initial protection. Likewise, B. pumilus demonstrates moderate resistance, attributed to its robust peptidoglycan structure and intrinsic cellular defense mechanisms. As to thermal–catalytic conditions, S. marcescens, due to its relatively heat-sensitive membrane structure and limited oxidative stress defenses, exhibits the highest susceptibility to thermal–catalytic inactivation. Similarly, E. coli, despite its initial robustness to oxidative stress in photocatalysis, experiences significant disruption of its outer membrane at elevated temperatures, resulting in relatively high thermal–catalytic sensitivity. Conversely, S. aureus, characterized by a thick peptidoglycan cell wall and robust membrane composition, shows higher resistance to short-term thermal–catalytic stress. B. pumilus possesses heat and oxidative stress resistance due to protective proteins, resulting in the lowest susceptibility to thermal–catalytic disinfection.
4. Discussion
4.1. Quantitative Analysis of the Factors Influencing Photocatalysis
Statistical analysis was performed using analysis of variance (ANOVA) and a probability defined with least significant differences at p < 0.05. The experimental results were first tested for differences in the five factors, and the results are shown in Table 1 and Figure 11. From this result, it is clear that the filter, dilution, light intensity, and duration significantly affect the experimental results. The type of catalytic material had a substantial effect.
| Factors | df | F | Sig. |
|---|---|---|---|
| Filter | 1 | 13.91 | 0.028 |
| Light intensity | 2 | 1.282 | 0.019 |
| Materials | 2 | 13.324 | < 0.001 |
| Dilution | 2 | 5.474 | 0.048 |
| Duration | 1 | 0.082 | 0.02 |
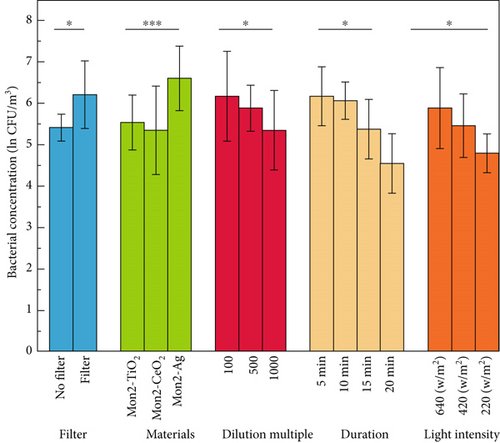
To further clarify the experimental results, a two-factor variance analysis was carried out on five factors in two-pair permutations, yielding 10 sets of results, as shown in Table 2. The results showed no interactions between light intensity and dilution, between material and duration, or between dilution and duration. In contrast, significant interactions were observed for the other seven combinations.
| Group | Factors | df | F | Sig. |
|---|---|---|---|---|
| Filter ∗ light intensity | Filter | 1 | 10.339 | 0.002 |
| Light intensity | 3 | 5.672 | 0.047 | |
| Filter ∗ light intensity | 3 | 3.21 | 0.038 | |
| Filter ∗ materials | Filter | 1 | 19.762 | < 0.001 |
| Materials | 2 | 18.929 | < 0.001 | |
| Filter ∗ materials | 2 | 32.088 | < 0.001 | |
| Filter ∗ dilution | Filter | 1 | 12.174 | 0.001 |
| Dilution | 2 | 4.79 | 0.01 | |
| Filter ∗ dilution | 2 | 3.596 | 0.03 | |
| Filter ∗ duration | Filter | 1 | 9.051 | 0.003 |
| Duration | 2 | 4.048 | 0.039 | |
| Filter ∗ duration | 2 | 8.414 | 0.006 | |
| Light intensity ∗ materials | Light intensity | 3 | 5.749 | 0.025 |
| Materials | 2 | 9.812 | < 0.001 | |
| Light intensity ∗ materials | 6 | 1.259 | 0.028 | |
| Light intensity ∗ dilution | Light intensity | 3 | 0.637 | 0.298 |
| Dilution | 2 | 3.553 | 0.032 | |
| Light intensity ∗ dilution | 6 | 0.138 | 0.099 | |
| Light intensity ∗ duration | Light intensity | 2 | 8.911 | 0.040 |
| Duration | 1 | 6.059 | 0.025 | |
| Light intensity ∗ duration | 2 | 0.013 | 0.049 | |
| Materials ∗ dilution | Materials | 2 | 13.056 | < 0.001 |
| Dilution | 2 | 5.364 | 0.006 | |
| Materials ∗ dilution | 4 | 3.235 | 0.015 | |
| Materials ∗ duration | Materials | 2 | 7.554 | 0.001 |
| Duration | 2 | 0.051 | 0.95 | |
| Materials ∗ duration | 4 | 0.357 | 0.839 | |
| Dilution ∗ duration | Dilution | 2 | 2.936 | 0.057 |
| Duration | 2 | 0.046 | 0.955 | |
| Dilution ∗ duration | 4 | 0.025 | 0.999 | |
4.2. Mechanism of Photocatalytic Sterilization
According to these reactions, TiO2 inactivates bacteria by converting photoenergy into chemical energy.
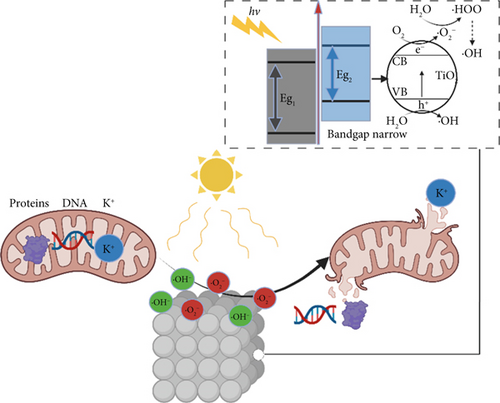
In this study, as illustrated in Figure 12, doping TiO2 with MnO2 results in a narrowed bandgap, enabling the generation of ROS under visible light. ROS are prone to combine with protons and electrons from hydrogen atoms in lipids, transforming nonradical lipids into lipid peroxides (LPOs). This process converts other nonradical molecules into radical molecules and triggers chain reactions. These chain reactions alter the fluidity and permeability of the cell membrane, ultimately leading to membrane dysfunction and disintegration. The damaged membrane cannot maintain its potential and exhibits an increase in nonspecific permeability, causing the leakage of proteins, K+, and DNA from bacteria.
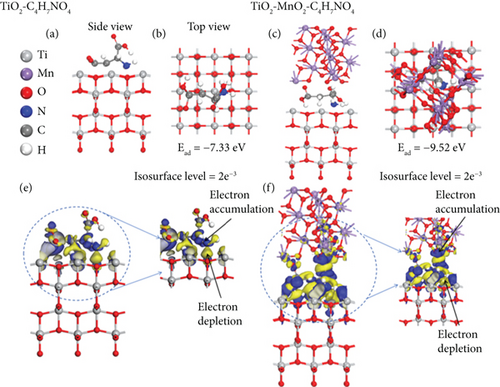
To elucidate the underlying mechanism for the adsorption and catalysis of bacterial cell membranes at the atomic scale, first-principle calculations were performed based on density functional theory (DFT). The calculation used one of the amino acids, C4H7NO4, in the cell membranes as the decomposition substance. The modified catalytic material TiO2–MnO2 was compared with ordinary TiO2. The optimized adsorption conformations (top view and side view) of C4H7NO4 on TiO2 and TiO2–MnO2 surfaces are shown in Figures 13a, 13b, 13c, and 13d. To better illustrate the catalytic behavior of TiO2–MnO2 surfaces for C4H7NO4 molecules, the adsorption energies (Ea) of both surfaces were calculated. The adsorption energy of TiO2–MnO2 for C4H7NO4 (−9.52 eV) is greater than that of TiO2 (−7.33 eV). A relatively negative Ea indicates an energetically favorable system. As depicted in Figure 13e,f, the charge density difference diagrams provide more intuitive bonding and charge transfer conditions between TiO2, TiO2–MnO2, and C4H7NO4. The blue and yellow regions correspond to electron accumulation and depletion, respectively. Electrons mainly accumulated along the Ti–O, Mn–O, and Ti–N bonds, indicating that the interactions between the TiO2–MnO2 composites and C4H7NO4 molecules were more vital than those between the TiO2 and C4H7NO4 molecules. This observation is in profound agreement with the XPS results.
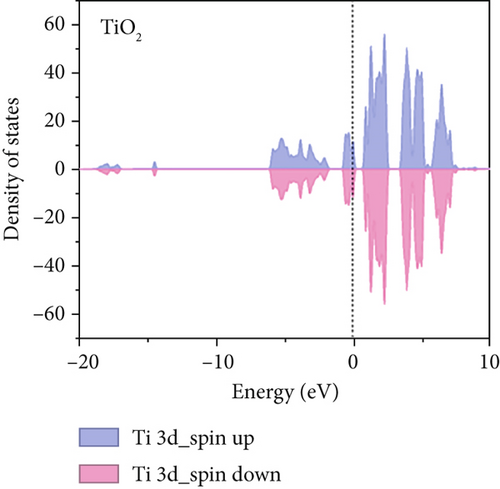
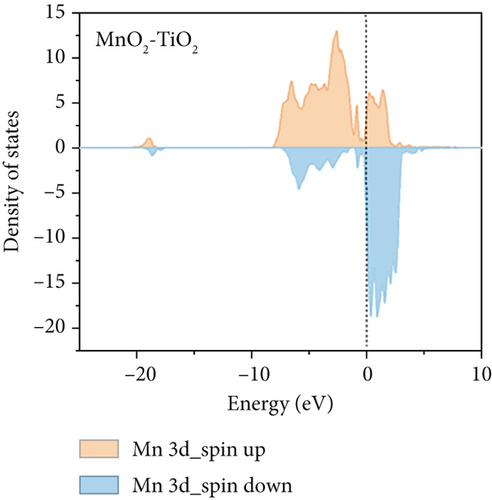
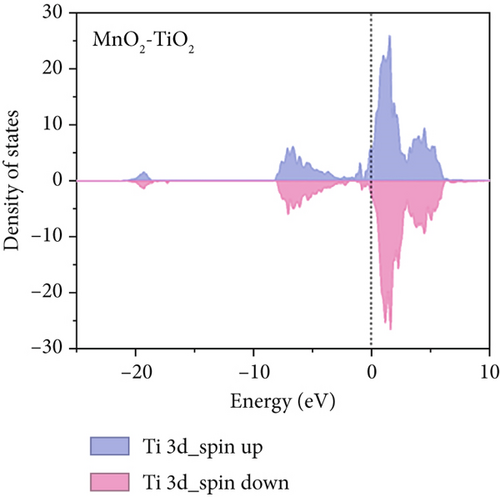
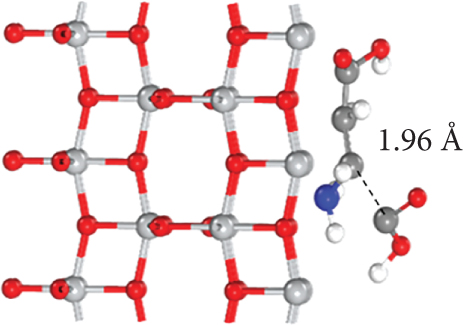
To further understand the differences in electronic structure, the projected density of states (PDOS) for the Ti 3d states of TiO2 and the Mn 3d states of TiO2–MnO2 were calculated (Figures 14a, 14b, and 14c). The PDOS distribution of the Ti 3d states (spin up and down) of TiO2 is almost zero, exhibiting the poor metal conductivity of TiO2. In contrast, the PDOS contribution at the Fermi level primarily comes from the spin-down electrons of Mn in TiO2–MnO2 composites, indicating the induction of MnO2 with good electron transport efficiency and increased activity, which is crucial for catalysis. To better understand the effective catalysis at the TiO2 and TiO2–MnO2 surfaces, the bond length variation of C4H7NO4 molecules was further probed. The calculated bond length of C–C was 1.96 Å for TiO2 (Figure 14d). Interestingly, the C–C bond length increased to 2.83 Å on the surface of TiO2–MnO2 (Figure 14e), indicating the enhanced catalytic efficiency of TiO2–MnO2 toward C4H7NO4 molecules. This enhancement can effectively elongate and activate the C–C bond. It was found that the C–C bond of C4H7NO4 molecules was more easily broken during the interaction between C4H7NO4 and TiO2–MnO2.
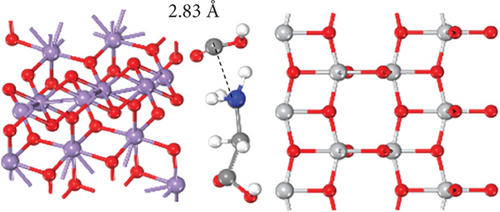
In summary, the DFT calculation results illustrate that MnO2 introduces more active sites and that TiO2–MnO2 improves the adsorption of C4H7NO4 molecules, increasing the activation of C4H7NO4 molecules, thus achieving better catalytic efficiency for TiO2–MnO2 than for TiO2.
To explore the adsorption behavior and electronic characteristics, DFT simulations were carried out using the CASTEP engine integrated into the Materials Studio 2020 platform [51]. The treatment of electron exchange and correlation followed the generalized gradient approximation (GGA), applying the well-established PBE functional as formulated by Perdew et al. [52].
In these calculations, a kinetic energy cutoff of 480 eV was set for the plane-wave expansion. Structural relaxation proceeded under stringent convergence thresholds: atomic displacements below 0.005 Å, total energy variation limited to under 1 × 10⁻⁵ Ha, and interatomic forces constrained below 0.01 eV·Å−1. To eliminate spurious periodic interactions, the simulation cell was designed to span over 12 Å in both lateral directions and included a vertical vacuum slab of 15 Å.
Brillouin zone sampling was performed using gamma-centered k-point meshes of 2 × 2 × 1 for geometry convergence and 3 × 3 × 1 for subsequent electronic property analyses. In modeling the adsorption of C4H7NO4 on the TiO2–MnO2 hybrid system, a 3 × 3 × 1 supercell was constructed to accommodate the molecule–surface interaction adequately.
4.3. The Concept of Novel Photocatalysts Used in Indoor Air Purification
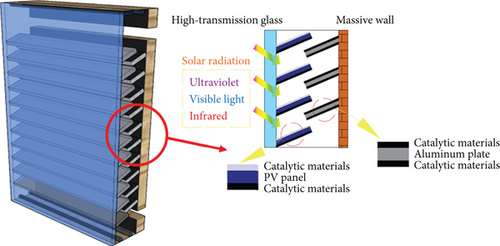
As a common passive solar architectural element, the Trombe wall has increasingly attracted scholarly attention due to its straightforward implementation, durability, economical nature, and uncomplicated geometric design. Generally, it is constructed from a glazed external layer, an internal air gap, a thermally dense wall with an absorbing finish, and upper and lower ventilation openings arranged strategically. When exposed to sunlight during the day, solar rays pass through the glazing layer and are absorbed by the thermal storage wall, subsequently transferring heat to the air trapped within the intermediate channel. Driven by buoyancy-induced convection, this warm air ascends and exits through an upper vent, while cooler room air simultaneously flows into the wall’s channel from a lower opening, establishing a continuous circulation pattern. A substantial proportion of absorbed solar energy is concurrently stored within the thick wall, gradually dispersing into the indoor environment overnight, thus providing effective supplemental heating.
Nonetheless, traditional Trombe wall designs suffer from inherent shortcomings, notably a limited range of functionalities and suboptimal solar energy conversion rates. To address these constraints, researchers have explored advanced modifications, including the incorporation of novel photocatalytic materials, thus broadening the system’s capabilities. Through the introduction of these catalytic enhancements, Trombe walls become capable of purifying indoor air contaminants while simultaneously improving overall energy efficiency. In selecting suitable photocatalysts for practical use, TiO2–MnO2 emerges as more advantageous due to its balanced performance in microbial sterilization and cost-effectiveness compared to TiO2–Ag, despite the latter’s superior sterilizing capability.
Figure 15 depicts a novel Trombe wall variant optimized for practical installations, integrating strategically placed photovoltaic (PV) modules and aluminum surfaces coated with photocatalytic substances within its internal airflow passage. This enhanced design achieves multiple functionalities concurrently—delivering indoor heating, air purification, and renewable electricity generation. Moreover, a crucial practical issue, the insufficient interaction duration between indoor air and catalytic surfaces under standard indoor airflow scenarios, has been specifically addressed by refining the internal arrangement. The inclusion of these PV components and catalytically active aluminum sheets not only extends the air circulation path but also substantially increases available catalytic reaction areas. These additional structures inherently introduce flow resistance, thereby decelerating airflow velocity. Such reduced velocities effectively prolong the interaction time between circulating indoor air and catalytic coatings, significantly elevating microbial sterilization efficiency under realistic operational conditions.
4.4. Limitations
Despite the promising findings presented in this research, several limitations should be explicitly acknowledged to provide a balanced view of the results and their applicability in practical scenarios. Firstly, while our experimental investigations primarily focused on the bacterial indicator, a comprehensive assessment across various microbial types, especially fungi and viruses, was beyond the scope of this study. Future studies incorporating a broader spectrum of pathogens would be required to more robustly verify the broad-spectrum applicability of the photocatalytic materials. Secondly, the durability and stability of the photocatalytic materials under long-term operation and varying real-world environmental conditions (such as temperature fluctuations, humidity variations, dust accumulation, and repeated microbial exposures) were not assessed in this study. Further experimental investigations into material degradation, reusability, and long-term operational stability under practical usage conditions would be highly valuable. Finally, the current photocatalytic materials used in this study could be further optimized. Improvements in expanding the active spectral range (e.g., extending photocatalytic response to visible light or near-infrared wavelengths) and enhancing catalytic efficiency through material engineering or doping strategies represent promising directions for future research.
5. Conclusions
- •
Among TiO2–MnO2, MnO2–CeO2, and TiO2–Ag, TiO2–Ag exhibited the best sterilization effect. The addition of xenon enhances the sterilization effect. The sterilization efficiency of 1000 ppm TiO2–Ag without a filter was the highest at a light intensity of 640 W/m2 (k = −0.147 min−1).
- •
Doping with MnO2 may lead to more oxygen atoms escaping from the lattice structure under UV irradiation. Compared with TiO2, doped MnO2 prevents electron–hole complexation and increases the number of photogenerated holes, which produce more hydroxyl radicals. TiO2–MnO2 also demonstrates sterilization performance.
- •
MnO2–CeO2 is considered a thermal catalytic material and does not undergo a photocatalytic reaction. After 20 min of illumination, the temperature of the thermally catalyzed MnO2–CeO2 catalyst was the highest. MnO2–CeO2 destroys the integrity of bacterial cell membranes through infrared-triggered heat therapy, which converts infrared radiation into heat, achieving photothermal conversion and using high temperatures to purify microorganisms.
- •
Significant interactions existed for the other seven combinations, except between light intensity and dilution, between material and duration, and between dilution and duration.
Recent studies have conducted comprehensive performance investigations on photocatalysts, which have provided a strategy for indoor air quality control. The overall demonstration procedure and findings were conducted in an experimental chamber. With different climatic features and ambient conditions, the effectiveness of the designed system has not yet been tested. This can be evaluated further in the future.
Conflicts of Interest
The authors declare no conflicts of interest.
Author Contributions
Xiaojian Duan: writing, investigation, data analysis. Yuqi Huang: investigation. Chao Shen: supervision, investigation, resources. Xi Deng: writing. Phil Jones: supervision, proofreading, methodology.
Funding
The research is supported by the National Natural Science Foundation of China (10.13039/501100001809) (52178071).
Acknowledgments
The authors disclosed receipt of the following financial support for the research, authorship, and/or publication of this article: The authors gratefully acknowledge the funding supports from the National Natural Science Foundation of China (Grant number 52178071).
Open Research
Data Availability Statement
The data that support the findings of this study are available from the corresponding authors upon reasonable request.


