Cavitation Dynamics and Vorticity Analysis of a Clark-Y Hydrofoil and a Venturi Geometry Based on the DCM
Abstract
Literature research has shown that the high turbulent viscosity of original Reynolds-averaged Navier–Stokes (RANS) models in the wake reduces the cavitation instability, resulting in an unreasonable performance prediction of the cavity generation, shedding, and collapse. Hence, a density-corrected model (DCM) is utilized to improve the prediction capacity of the RNG k–ε model in the two-phase flow simulation. Selected results are provided for two cases, namely, a two-dimensional Clark-Y hydrofoil and a Venturi geometry associated with the unsteady cavitating flows. We compare hydrodynamic coefficients, cavity characteristics, and time-averaged velocity with available experimental results. This work is aimed at providing a better physical insight to describe the vortex dynamics and structures during the cavity evolution, explaining the mechanism of the transient cavitating flows by quantifying the force coefficients of the cavity and its surrounding turbulent structures, and revealing the promoting effect of the re-entrant jet on the cavitation transition. In addition, vorticity transport equations are conducted to analyze the interaction of vortex and cavitation. The results demonstrate that the DCM has sufficient robustness to predict the periodic cavity evolution of generation, breakup, shedding, and collapse. An unsteady cavitation process contains the development of complex vortex structures. Re-entrant jet near trailing of the attached cavity leads to distinct changes of velocity gradient, which has great influence on production and dissipation of vorticity. Intensive mass transfer between liquid and vapor phases may introduce the volume expansion or contraction as well as the baroclinic torque, which leads to unsteady distribution of vorticity.
1. Introduction
For a long time, cavitation has been one of the research hotspots in the hydrodynamic field due to its frequent and serious damage to the availability, reliability, and durability of various mechanical equipment operating in a liquid environment [1]. The appearance, development, and collapse of the cavity are often associated with pressure pulsation, vibration, noise, surface erosion, and other negative factors, which affect the safe operation of hydraulic machinery [2, 3].
Experimental means can directly show partial details of cavitation structures, providing convenience for scholars to study relevant flow mechanisms. Kubota et al. [4] successfully captured the turbulent cloud cavitating flow structures around a stationary hydrofoil by utilizing laser Doppler anemometry. They observed a vorticity extremum in the center of the cloud bubble cluster, which contained many small cavitation bubbles. Iyer and Ceccio [5] used planar particle imaging velocimetry (PIV) to obtain the fluctuating velocities, vorticity, and mean Reynolds stresses dropping across the shear layer cavitation. The visualization results of the shear layer illustrated that the generation, development, and collapse of primary and secondary vortices were not obviously influenced by the existence of cavitating structures. Li et al. [6] used PIV to measure the instantaneous and average velocity and vorticity distributions around the hydrofoil under different cavitation numbers. The results showed considerable instability at the interface of the vapor and water–vapor mixture, indicating frequent mass transfer within the cavity. Foeth, van Terwisga, and van Doone [7] used a high-speed camera to investigate the shedding mechanism of an attached sheet cavity around a three-dimensional (3D) twisted hydrofoil. The side-entrant jet pointing to the central area impacted the closed cavity, which caused the periodic shedding behaviors.
Nowadays, the rapid advance of computer performance enables the application of the computational fluid dynamics (CFD) technology in cavitating flow more and more mature, which has become an important means for scholars to investigate cavitation [8]. Iannetti, Stickland, and Dempster [9] estimated the model of Singhal et al. [10] in incipient, partial, and full cavitating conditions of a positive displacement pump, which showed that the noncondensable gas expansion affected the calculation accuracy. Liu et al. [11] used a 3D numerical model to investigate the cavitating flow inside a regulating valve and found that the area and intensity of the cavity increased with the growing inlet pressure. Chen et al. [12] applied the Euler–Lagrange model to solve the cavitation characteristics in a hydraulic shock absorber. The cavitation control method was proposed on the basis of the simulating specific position and distribution of the cavity.
The cavitating flow simulation is a challenging issue because it is a highly developed turbulence that includes complicated interactions of mass, energy, and momentum between vapor and water [13]. Ji et al. [14] and Huang, Zhao, and Wang [15] applied a large eddy simulation (LES) to observe the vortex structures around a 3D hydrofoil. Various types of RANS/LES hybrid models were also used for the cavitating flow simulations and comparison with the traditional RANS model. Kinzel et al. [16] analyzed the cavitating flow over a blunt ogive with a detached eddy simulation (DES) model. Huang et al. [17] used the DES models to quantitatively reproduce the time-averaged velocity and shedding frequency of the cavitating flow around the hydrofoil. They concluded that the DES model could better deal with large-scale closure dynamics compared to traditional RANS equations. Sedlar et al. [18] and Hidalgo et al. [19] performed the cyclic process of cavity shedding and rupture around a 3D hydrofoil using a scale adaptive simulation (SAS) model and an LES model.
Although the advantages of scale-resolving methods (i.e., LES, DES, and SAS) have already been proven, it must be pointed out that these methods are difficult to popularize in fast-paced engineering practice due to the high demands for computing power. RANS methods are still commonly used in modern industrial CFD for hydraulic machinery due to certain advantages, such as strong robustness and low grid requirements. However, they cannot accurately obtain much unsteady turbulent information because of their overestimation of the turbulent eddy viscosity [20, 21]. In view of the previous efforts, the present study pays close attention to the improvement of the predictive capability of the RNG k–ε model through a density-corrected model (DCM) [22]. In this model, the mixed density of the cavitation region in the leading edge of the hydrofoil is modified to reflect the compressibility of the attached cavity [23]. Therefore, the density correction has a significant impact on the liquid–vapor mixing zone, which corrects the overestimation of the turbulent viscosity [24]. Malekshah et al. [25] reported that the RNG k–ε model modified by the DCM shows a better ability to predict the cavity structures.
However, there is still a lack of researches analyzing the unsteady characteristics of typical cavitation flows from the perspective of vortex dynamics. Further study should be performed to investigate the vorticity–cavitation interaction. In addition, more application objects should be added to prove the validity and robustness of this method. This study is aimed at strengthening the cognition of unsteady cavitating flow structures by the numerical simulations of a two-dimensional (2D) Clark-Y hydrofoil and a Venturi geometry. The cavitating flow field is investigated by means of turbulent viscosity correction through the user-defined functions in ANSYS Fluent on the basis of fully considering the compressibility of a vapor–liquid mixture. In addition, the relationship between the vorticity with cavitation dynamics is investigated, and the transport equations are conducted to analyze the influence of cavitation on vorticity transport process.
2. Numerical Models and Simulation Settings
2.1. Multiphase Flow Modeling
2.2. Description of the DCM
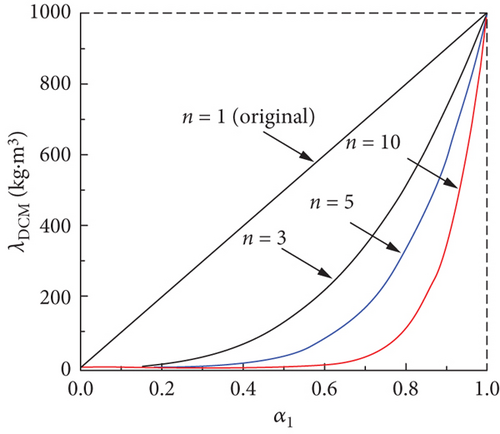
Figure 1 plots the distribution of the modified mixture density λDCM varying with the water density ρl under the specific correction index n. Ducoin, Huang, and Young [27] and Seo and Lele [28] pointed out that the experimentally cavitating flow features were well reproduced using the density correction index n = 3; hence, this value was also used herein.
2.3. Simulation Settings
The ANSYS Fluent 16.1 solver adopts a finite volume discretization method. The transient simulation of the cavitating flow takes the steady-state calculation results as the initial value to avoid the adverse effect of the existing bubbles in the initial flow field. The SIMPLEC algorithm suitable for the unsteady fluid analysis is employed to improve the convergence and computation speed. The gradients and the Laplacian of all physical fields are calculated by a least-squares cell-based scheme. The PRESTO! scheme is used for the pressure field, while the second-order upwind scheme is implemented for the other remaining terms. The time-derivative term follows the first-order implicit transient scheme until the iterative process is stable and then switches to the second-order implicit scheme to obtain a relatively desirable solution of the cavitation evolution.
3. Test Cases and Results
3.1. Cavitating Flow Around Clark-Y Foil
3.1.1. Computational Details
The Clark-Y hydrofoil flow simulation was the fundamental test case to evaluate the DCM and described the structures and dynamics of the transient cavitation. The calculation domain and the boundary setup were derived from the experimental conditions in [15, 29] (Figure 2(a)). The chord length of the Clark-Y hydrofoil was c = 0.07 m, which was placed in the water tunnel at a specific attack angle of 8°. The total length used in the computational section was 10c. The distance from the leading edge to the inlet was 3c, while that to the outlet was 7c. The hydrofoil was symmetrically arranged from the upper and lower walls with a total height of 2.7c. According to the experimental measurements, the inlet velocity was 10 m/s, and the turbulence intensity at the entrance boundary was I = 2%. Hence, the corresponding Reynolds number was Re = 6.14 × 10⁵. The outlet pressure was set to vary by the cavitation number. A C–H-type topology was generated around the hydrofoil to better adapt to the shape of the leading edge of the hydrofoil (Figure 2(b)). Prior to the calculation, the grid dependency was evaluated (Figure 3) and selected by calculating the variations of the lift coefficient (Cl) and drag coefficient (Cd) with different combinations of grids marked in the “refined zone” under the no-cavitating flow condition (σ = 2.5). The differences of the lift and drag coefficients between two largest meshes were both less than 0.3%; hence, the grid containing “60 × 240” nodes was sufficient for conducting the calculation. In this case, the final number of grid nodes was 100,282.


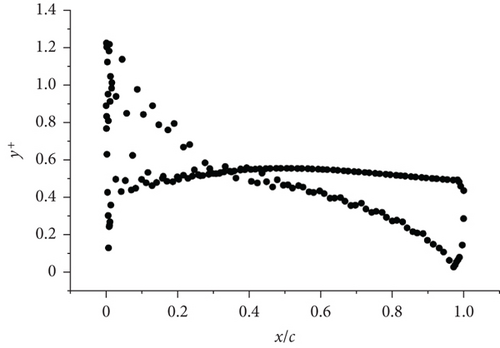
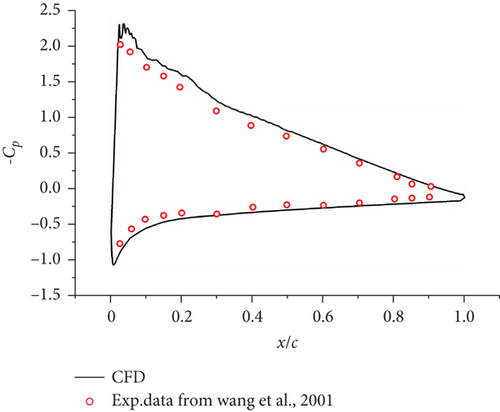
The first near-wall node of the hydrofoil was placed at y+ ≈ 1 (Figure 4(a)) to satisfy the requirements of the enhanced wall function. Figure 4(b) illustrates that the pressure coefficient (−Cp) distribution at the hydrofoil surface was consistent with the test data [29]. In the transient simulation, the time step Δt = 1 × 10⁻⁵ s was calculated according to the convergence requirements to provide an average Courant number of CFL = 10.
3.1.2. Unsteady Cloud Cavity and Its Time-Averaged Velocity Characteristics
- i.
Development stage of the attached sheet cavity: from 5%T to 20%T, the large-scale bubble clusters shedding off in the last cycle gradually separated from the trailing edge, and the sheet cavity on the leading edge continuously developed to cover almost the entire suction surface at the same time. The DCM could exhibit this phenomenon very well, but its capturing effect of the length of the attached sheet cavity was not as good as the original model.
- ii.
Advancement stage of the re-entrant jet: from 60%T to 70%T, the attached sheet cavity of the leading edge reached its maximum length, and the large-scale bubble clusters shedding off the tailing edge disappeared. During this process, the re-entrant jet was generated and impacted with the sheet cavity as it moved upstream, breaking the obvious interface between liquid and vapor under the adverse pressure gradient.
- iii.
Forming stage of large-scale bubble clusters: the cloud cavity moved and diffused downstream due to the shear action of the re-entrant jet flow and the upstream main flow. A new attached sheet cavity was immediately formed at the leading edge of the following cloud cavitation cycle.
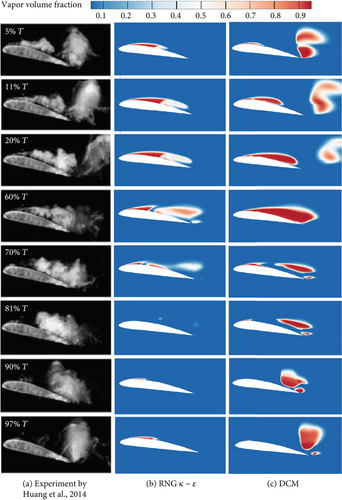
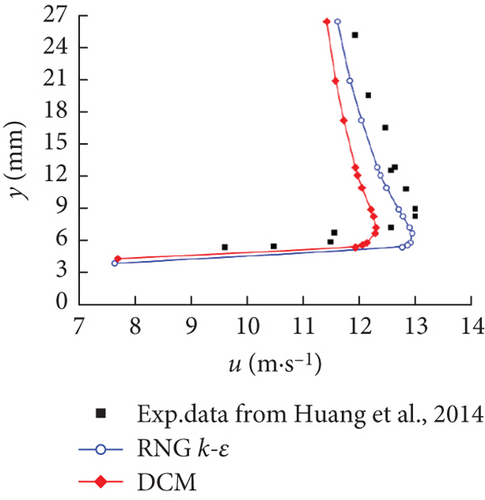
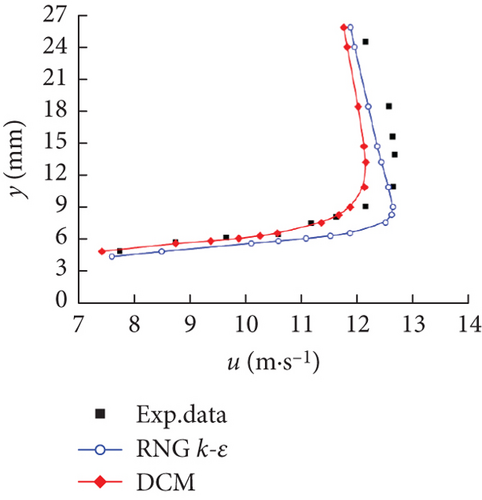
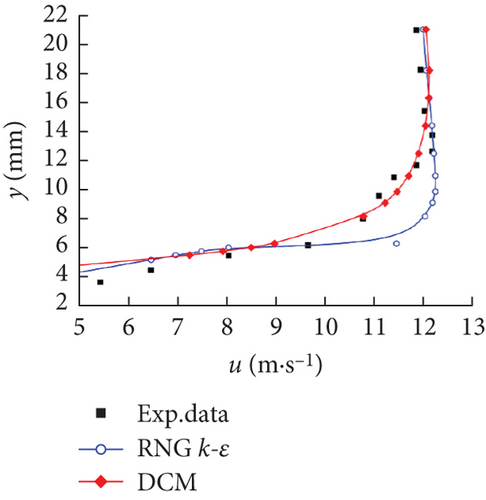
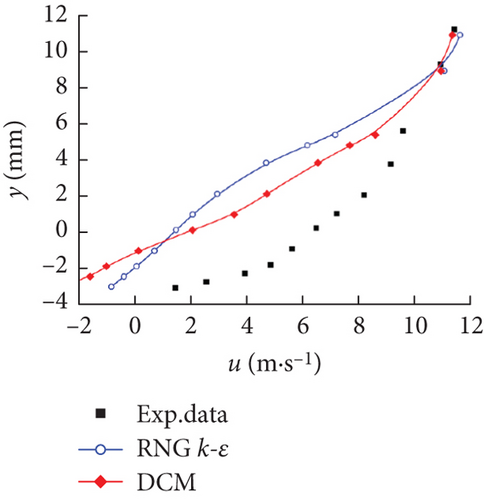
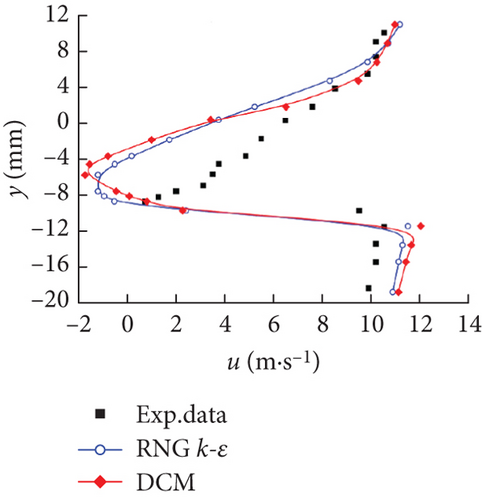
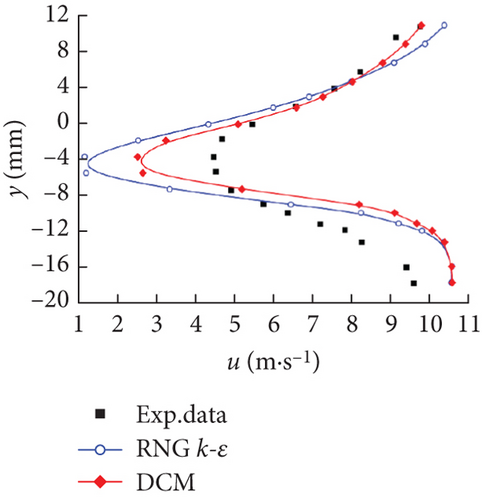
Figure 6 illustrates the time-averaged normalized x-velocity (u) in the different locations along the chord-wise direction, namely, x/c = 0.2, 0.4, 0.6, 0.8, 1.0, and 1.2, employed to qualitatively evaluate the capability and accuracy of capturing the cavitation structures of the two different models. The thicker the cavity along the main flow direction, the greater the velocity gradient in the vertical direction. At the chord-wise locations of x/c = 0.2, 0.4, and 0.6, a large velocity gradient was found near the suction surface, and the magnitude of the velocity far away from the hydrofoil wall was consistent with that of the mainstream. It was worth noting that the DCM was aimed at modifying the mixing density in the cavitation region, with the influence mainly concentrated in the cavitation core area near the wall to consider the compressibility of the gas–liquid mixture. In the far wall region, due to the lack of obvious cavitation phenomena, its effect was not satisfactory as shown in Figures 6(a) and 6(b). In Figure 6(d), the negative values of u appeared at the location of x/c = 0.8, illustrating the existence of a re-entrant jet. It gradually conformed to the mainstream velocity with the increase of the distance from the wall. Note that due to the obvious resistance action of the re-entrant jet, u significantly dropped at positions x/c = 1.0 and 1.2. The deviation between the numerical prediction results and the experimental data gradually increased with the transformation from the sheet cavity to the cloud cavity, especially after the closure region. Considering the highly unsteady flow characteristics in the closure region of the hydrofoil and the difficulties in the experimental measurement, some experimental errors were inevitably introduced. However, in the x/c = 1.2 location, the DCM obtained a relatively better result than the RNG k–ε model, which demonstrated that an effective reduction of the turbulent viscosity contributes to capturing the flow behavior in wake flows for cloud cavitation.
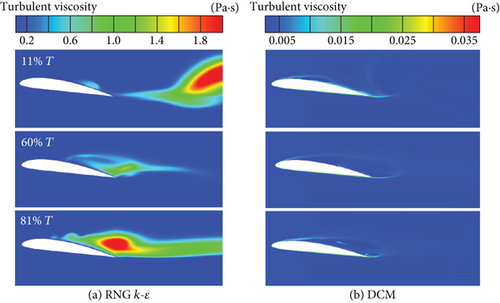
As observed in Figure 7, unrealistically high eddy viscosity areas were formed on the suction surface and the wake flow downstream by the original RNG k–ε model, thereby reducing the calculated flow field instability. It was the fundamental reason why the model could not accurately predict the vortex shedding dynamics during the cloud cavitation. On the contrary, the DCM modified the turbulent viscosity in the cavitation regions, obtaining not only a more stable growth of the sheet cavity but also a more reasonable shedding process of the cloud cavity. The proposed correction considered the compressibility and multiscale effects to increase the turbulent dissipation.
3.1.3. Distributions of the Q-Criterion and Vorticity Terms
Figure 8 reveals that the DCM captured well the development of the antirotation vortex in the wake flow, which exhibited a strong interaction between the trailing vortex structures and the cloud cavity. From 5%T to 20%T, the positive value of Q near the attached cavity at the leading edge represented that the rotation rate was larger than the strain rate in that region, demonstrating that the rotation effect played a dominant role in the flow. The variation of the Q value illustrated that the attached sheet cavity constantly changed under the influence of the re-entrant jet as it formed and moved upstream between 60%T and 70%T. During this time, the rotation and strain effects jointly dominated the flow. As the re-entrant jet reached the hydrofoil head at 81%T to 97%T, the cavity was lifted up from the suction surface and shed downstream, transforming into a new cloud cavity. Positive and negative crossdistributions of the Q value, which were significantly different from the attached sheet cavity, were found in the inner region of the shedding cloud cavity.
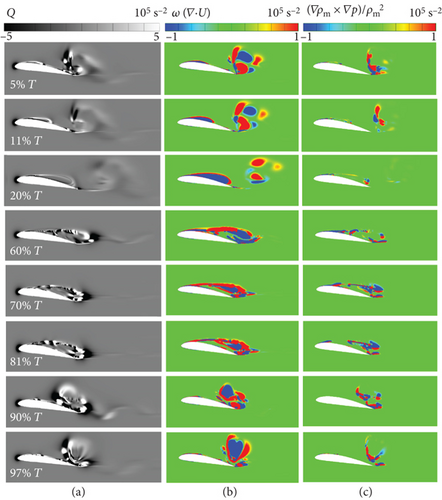
The first and fourth terms on the right side of this equation denote the vortex stretching and the viscous diffusion terms, respectively, which are considered zero in the 2D flows [14]. Hence, only the second and third terms, namely, the vortex dilatation and baroclinic torque terms, were investigated in the current study. The dilatation term meant the volume expansion or contraction of the fluid, which played a dominant role in the vorticity variation and was accompanied by the cavity evolution. Although the strength of the baroclinic torque term was lower than that of the dilatation term, its role in the shedding and collapse of the cavity could not be ignored due to the imbalance of the density and pressure gradients. It was seen that the baroclinic torque term was remarkable along the vapor–liquid interface and near the cavity gradients, but negligible inside the cavity. Due to misaligned pressure and density gradients, the vorticity structures had undergone significant changes. In addition, compared to the previous publications [14, 30], our work emphasized the influence of the baroclinic torque term. The results indicated that there was a strong correlation between the cloud cavitation and vorticity structures, which suggested that an increase in the vortex dilatation and baroclinic torque terms along the cavity surface might be an important mechanism for vorticity generation.
3.2. Cavitating Flow in a Venturi Type
3.2.1. Venturi Geometry and Numerical Parameters
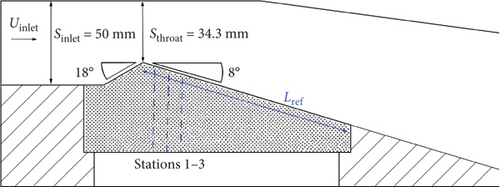
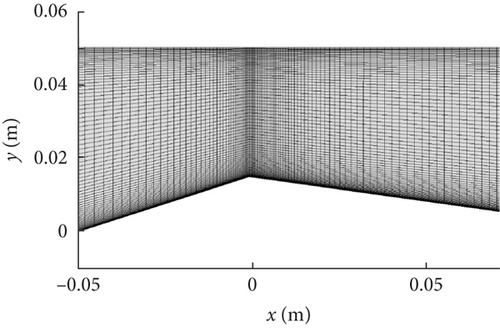
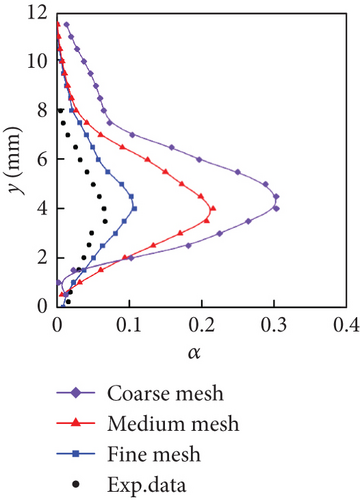
The horizontal distances between Test Stations 1, 2, and 3 and the throat were 13.7 mm, 31.5 mm, and 49.9 mm, respectively. The different grid types were obtained by adjusting the number of nodes distributed radially along the throat. Finally, a fine mesh with 75,240 nodes was selected in the next simulation. The numerical time step of the unsteady cavitation was set to Δt = 4 × 10⁻⁵ s to obtain a CFL number less than 5. The total calculation time was 0.8 s, indicating that approximately 35 shedding cycles were calculated.
3.2.2. Computational Results
Four instantaneous snapshots [31] were provided in the upper-right corner of Figure 11. The maximum length of the sheet cavity was 45 ± 5 mm. In the first stage, the sheet cavity grew at the throat, and the cloud cavity moved downstream as shown in Figure 11(a). In the second stage, the attached sheet cavity stretched to its maximum length as shown in Figure 11(b), indicating that the numerical result captured this size well. Figure 11(c) presents that the sheet cavity broke off under the action of the re-entrant jet in the third stage. Finally, a new cloud cavity periodically appeared in the next cycle, as exhibited in Figure 11(d).
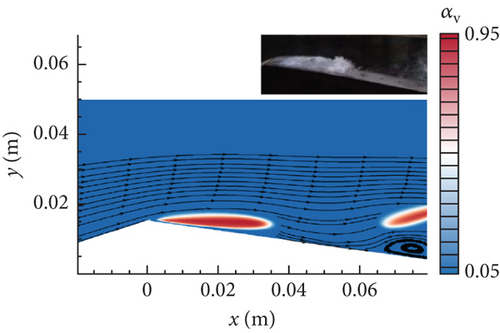

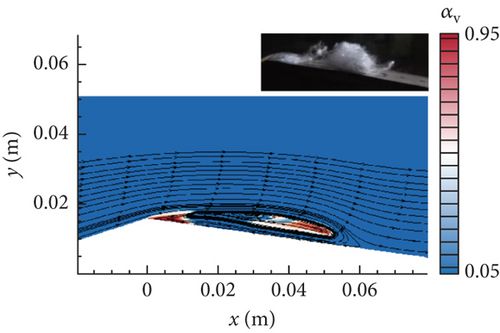
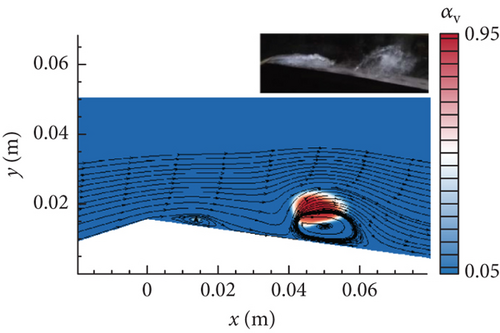
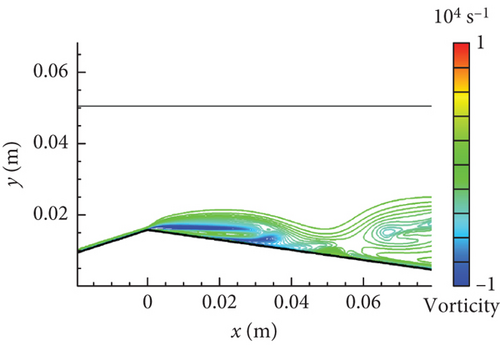
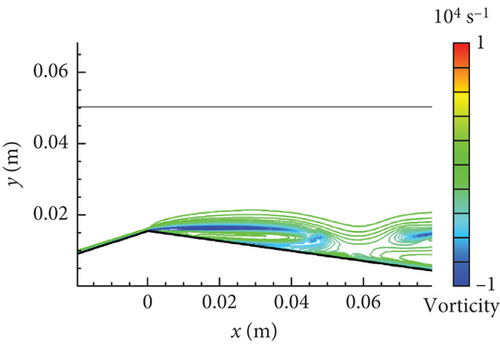
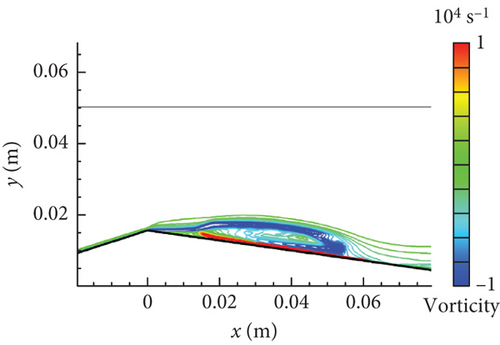
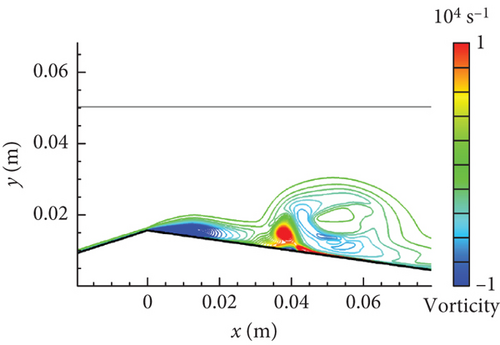
Figure 12 shows the vorticity distribution drawn by lines along the lower wall to further illustrate the influence of re-entrant jet dynamics on the cavity. From Figure 12(a) to Figure 12(b), the vorticity (“−”) part enhanced under the favorable pressure gradient at the throat. As the re-entrant jet developed in Figure 12(c), the vorticity (“+”) part was generated under the action of an adverse pressure gradient downstream. The accumulation of vorticity (“−”) part was then gradually broken by the serve impact of the separation flow that suddenly appeared at the throat rear. The cavity was eventually lifted up from the lower wall in Figure 12(d). The interesting flow dynamics behavior was vividly reproduced.
4. Conclusions
- 1.
The DCM promotes vortex generation and flow instability due to adjustable capacity of turbulent viscosity in the cavitation regions comparing with that by the traditional RNG k–ε model. The re-entrant jet flow produces significant changes of velocity gradient, which has a great influence on the generation and dissipation of vorticity.
- 2.
Unsteady cavitation process involves the development of complex vortex structures. The change of Q illustrates that the rotation effect is greater than the strain effect in the attached sheet cavity, while the two effects jointly dominate the cloud cavity movement. The strong mass transfer between liquid and vapor phases may cause the volume expansion or contraction as well as the baroclinic torque. The dilatation term in the dominant role highlights a quasiperiodic behavior as the cavity change.
- 3.
It should be noted that there are some large deviations between the predicted and measured velocities, which indicate that the RANS method still has certain defects in capturing the small bubbles due to the time-averaged treatment of the cavitating flows.
Conflicts of Interest
The authors declare no conflicts of interest.
Funding
This work was supported by the Natural Science Foundation of Chongqing (No. CSTB2024NSCQ-MSX0896) and the Fundamental Research Funds for the Central Universities of Southwest University (No. SWU-KQ22062).
Acknowledgments
This work was supported by the Natural Science Foundation of Chongqing (No. CSTB2024NSCQ-MSX0896) and the Fundamental Research Funds for the Central Universities of Southwest University (No. SWU-KQ22062).
Open Research
Data Availability Statement
The data that support the findings of this study are available from the corresponding author upon reasonable request.


