A Comparative Study of Sol–Gel Synthesized ZnO/GO and ZnO/g-C3N4 Nanocomposites in the Photocatalytic Degradation of Acetaminophen
Abstract
The large surface area for pollutant adsorption and low charge recombination exhibited by carbon-based nanocomposites enhances the performance efficiency of photocatalysts. Herein, the performance of ZnO/GO and ZnO/g-C3N4 nanocomposites in the photocatalytic degradation of acetaminophen under UV irradiation was compared. The nanocomposites were synthesized by a facile sol–gel method. The structural, morphological, and optical properties were studied using XRD, SEM, TEM, FTIR, BET, UV-Vis, and PL characterization techniques. An increase in surface area was observed with the introduction of GO and g-C3N4. The ZnO/g-C3N4 nanocomposites possessed a greater surface area and photocatalytic efficiency than the ZnO/GO nanocomposites. The degradation efficiencies obtained were 84.6% and 61.2% for the best ZnO/g-C3N4 and ZnO/GO nanocomposites, respectively, in 1 μg/mL acetaminophen degradation at pH 7, hence their great potential for environmental remediation applications.
1. Introduction
The sustainable development goals established by the United Nations, to be achieved by 2030, include universal access to clean water and sanitation (SDG 6) and affordable and clean energy (SDG 7). Access to clean water and regional challenges with water scarcity and pollution exacerbate the water crisis and highlight how it remains a global challenge [1]. Furthermore, it is estimated that approximately two billion people worldwide do not have access to safe water [2]. Climatic variations and population growth have resulted in water scarcity [3]. In addition, several human activities, such as industrialization and agricultural and domestic practices, contaminate water [4] by introducing organic compounds and other pollutants into water bodies, which endangers the ecosystem and limits the availability of clean water.
While pharmaceuticals play a significant role in treating and preventing infections in humans and animals, their presence in water may have a detrimental synergistic effect on the ecosystem as a whole [5]. Due to its extensive use, acetaminophen (paracetamol), which is highly soluble in water, is frequently detected in various environmental compartments [6]. It is one of the most widely used anti-inflammatory, analgesic, and antipyretic drugs that can be obtained with or without prescription, and about 58%–68% is excreted in the urine [7]. Although it is detected at low concentrations of up to 10 μg/mL in wastewater treatment plant (WWTP) effluents and between 0.5 and 45 ng/L in drinking water [8], long-term exposure to these minimal concentrations may lead to protein denaturation, oxidation of lipids, damage to genetic material, and liver diseases in human and aquatic life [9]. The incomplete removal of this drug by conventional treatment techniques highlights the need to find more effective methods that have higher removal capacities.
The tremendous research on advanced oxidation processes (AOPs) has shown their great potential in the degradation and mineralization of pharmaceuticals through the action of highly reactive radicals [10]. These processes have been investigated for use in water treatment systems because they can effectively remove organic contaminants and deactivate pathogens that conventional techniques cannot eliminate [11]. Various AOPs include, but are not limited to, ozonation, hydrogen peroxide (H2O2), Fenton and photo-Fenton, electro-oxidation, sonolysis, and photocatalysis [12]. Photocatalysis, an acceleration of a photoreaction by a semiconductor photocatalyst, has been adopted due to its affordability, simplicity, and ability to utilize solar energy in nonselectively degrading contaminants into environmentally friendly products [13].
While TiO2, with a band gap equal to 3.2 eV, has been extensively studied for photocatalysis, zinc oxide (ZnO), a semiconductor with a similar band gap, has the added advantage of having relatively good electron mobility (115–155 cm2V−1 s−1), which boosts its quantum efficiency [14] compared to TiO2 (10−5cm2V−1 s−1), as well as a longer charge carrier lifetime than that of TiO2 [15]. Additionally, its abundance, affordability, chemical stability, nontoxicity, and photosensitivity are some other advantages that have led to the use of ZnO [16] in solar cells, electronics, surface coatings, sensors, ceramics, pharmaceutical photodegradation, and environmental remediation [17]. Its photocatalytic performance is limited by its wide band gap (3.2 eV), charge recombination, and aggregation of particles [18]. Modifications to enhance its performance include doping with metals or nonmetals, increasing the surface area, sensitizing the surface, and creating narrow band gap heterojunctions or nanocomposites [19]. The formation of nanocomposites with carbon-based materials such as graphene oxide (GO), activated carbon, carbon nanotubes, and graphitic carbon nitride (g-C3N4) has improved performance [20]. These materials not only have large surface areas and remarkable dispersion but can also regulate the surface chemistry and porosity of the semiconductor [21]. As photocatalyst support, they accept and transport photogenerated electrons, lowering charge recombination [22].
GO has garnered interest in applications, including gas sensors, electronics, biomedicine, fuel cells, and photocatalysis [23]. Its attractive properties in photocatalysis include good conductivity, high surface area, chemical and thermal stability, high electron mobility > 15 000 cm2 V−1 s−1 [24], high transparency, and optical absorptivity of visible light < 2.3% [21]. As a photocatalyst support, its sheet-like structure, great adsorption capacity, and good biocompatibility enable the anchoring of photocatalyst nanoparticles. The excited electrons in the photocatalyst move to the GO sheet, which can eventually trap and reduce charge recombination. It is regarded as an electron sink that offers the charge carriers a more convenient route [25]. Its composite with semiconductors promotes the adsorption of pollutants, charge separation, and conductivity, hence improving photocatalytic activity [26]. In ZnO, it introduces oxygen vacancies in the ZnO lattice [27]. This process narrows the band gap of ZnO and traps electrons, thereby hindering recombination [28]. GO-ZnO nanocomposites have displayed improved performance in vanillic acid photocatalytic degradation [18] and antibacterial activity [29], simazine photodegradation [30], and ion detection sensors [31].
g-C3N4, a visible light active semiconductor, has unique properties, such as a narrow band gap (2.7 eV), facile preparation, high stability, and metal-free composition [32]. It is considered ideal for applications in environmental remediation, water splitting, and CO2 photoreduction [33, 34]. Its application is, however, limited by its low surface area, high charge recombination, poor conductivity, and insufficient absorption of visible light [35]. Despite this, g-C3N4 is desirable in reducing ZnO limitations by enhancing charge separation [36]. Several studies have been conducted on g-C3N4/ZnO nanocomposites, demonstrating improved performance. This is achieved by forming a heterojunction, resulting in a reduction of its band gap and an expansion of its spectral response [37]. It also promotes effective charge separation [38]. The antibacterial activity and degradation of methyl orange, as well as the gas sensing application, have been studied for the ZnO/g-C3N4 nanocomposite. It has also been found to significantly degrade dyes such as Congo red, malachite green, red ink, and rhodamine blue [39–41].
This study compared the performance of ZnO/GO and ZnO/g-C3N4 nanocomposites prepared by the sol–gel method in the photocatalytic degradation of acetaminophen using a commercial off-the-shelf 100 W UV-A lamp. The nanocomposites were characterized by powder x-ray diffraction (XRD), Fourier transform infrared spectroscopy (FTIR), scanning electron microscopy (SEM), transmission electron microscopy (TEM), UV-Vis absorption, N2 adsorption Brunauer–Emmet–Teller (BET), and photoluminescence (PL). The photocatalytic performance was evaluated under UV-A light irradiation. Effects of parameters such as catalyst dosage, solution concentration, and pH were also studied. A scavenger test was performed to identify the active species.
2. Experimental Section
2.1. Chemicals and Reagents
Zinc acetate dihydrate (Zn(CH3COO)2·2H2O) (reagent grade, CAS No.: 5970-45-6), melamine (99% purity, CAS No.: 108-78-1), graphite (99%, CAS No.: 7782-42-5), cetyltrimethylammonium bromide (CTAB) (≥ 98%, CAS No.: 57-08-0), potassium permanganate (KMnO4) (99%, CAS No.:7722-64-7), sodium hydroxide (NaOH) (extrapure AR, CAS 1310-73-2), acetaminophen (C8H9NO2) (98%–102%, CAS No.: 103-90-2), sulphuric acid (H2SO4) (99%, CAS No.: 7664-93-9(, orthophosphoric acid (H3PO4) (85% AR), hydrochloric acid (HCl) (32%, CAS No: 7647-01-0), ethanol (C2H6O) (≥ 95%, CAS No.: 64-17-5), H2O2 (30 wt%, CAS 7722-84-1), and diethyl ether ((C2H5)2O) (anhydrous AR, CAS No.: 60-29-7) were all purchased from Merck and used without further purification.
2.2. Synthesis of g-C3N4 and GO
The g-C3N4 was prepared by placing 15 g of melamine in a ceramic crucible and treating it thermally at 550°C in the air for 5 h using a muffle furnace to obtain a yellow product. The furnace was allowed to cool to room temperature, and then the product was ground into a fine powder and labeled g-C3N4. The GO was synthesized through an improved Hummer’s method [42]. In detail, a mixture of concentrated H2SO4/H3PO4 9:1 (405 mL:45 mL) ratio was mixed with 3 g of graphite, and then while stirring the mixture, 1.76 g of KMnO4 was added slowly. After adding the KMnO4, the mixture was heated to 50°C and stirred continuously for 12 h. The product was then left to cool to room temperature, and then the mixture was slowly added to ice cubes in a large beaker. Then, 11 mL of H2O2 was added dropwise to obtain a dark yellow liquid, which was then left undisturbed for a day. The resulting product was washed in distilled water, HCl, ethanol, and (C2H5)2O. The obtained product was vacuum-dried at room temperature and labeled GO.
2.3. Synthesis of ZnO/GO and ZnO/g-C3N4 Nanocomposites
Two experimental protocols were developed to synthesize the ZnO/GO and ZnO/g-C3N4 nanocomposites. In the first, 350 mg of GO or g-C3N4 was dispersed in water, and a calculated concentration of Zn(CH3COO)2·2H2O solution (prepared in separate beakers) was added to the GO or g-C3N4 dispersions to give a mass ratio of 1:5 of ZnO:GO or ZnO:g-C3N4. Then, 0.03 mol/L CTAB was added to the solutions in the beakers, and stirring was done for 60 min. Subsequently, NaOH was added dropwise to the solutions to raise the pH to 11, and the stirring continued for another 60 min. The resulting residue was washed in distilled water and ethanol and dried in an oven at 70°C overnight. In the second protocol, a mass ratio of 5:1 was prepared, as before. Then, ZnO/g-C3N4 and ZnO/GO nanocomposites were obtained by calcination (under air in a muffle furnace) of the dried product at 400°C for 3 h. Pure ZnO was prepared following the same procedure without adding GO or g-C3N4.
2.4. Photocatalyst Characterization
The crystallite size, unit cell parameters, and crystal phases of the prepared samples were determined by collecting XRD patterns using a PANanalytical X’Pert Pro diffractometer with Cu Kα radiation (λ = 1.5406 Å), a tube current of 40 mA, and an accelerating voltage of 45 kV. The range measured was 5° < 2θ < 80° with a step size set at 0.008° for 10 s. The possible occurrence of electron transitions in the prepared samples was determined by UV-Vis spectroscopy. A mass of 1 mg of the sample was dispersed in 5 mL of distilled water through ultrasonication for 30 min. The dispersion was put in a quartz cuvette, and the absorbance was measured at a wavelength range of 300–800 nm using a Cary 100 Bio UV-Vis spectrophotometer. A Zeiss 540 Ultra SEM was used to analyze the prepared samples’ surface morphology and elemental composition. Additionally, the nanostructures were characterized using a JEOL 2100 TEM. Bruker ALPHA II FTIR set to a range of 400–4000 cm−1 was used to identify the stretching and vibrational functional groups in sample pellets prepared using potassium bromide. PL studies were performed to study the electron relaxation behavior using the Horiba Jobin Yvon Fluoromax-4 spectrofluorometer. Textural characterizations were performed by degassing all samples under vacuum at 150°C for 10 h and then obtaining nitrogen absorption–desorption isotherms at 77 K using an Autosorb-iQ gas sorption instrument (Anton Parr). The specific surface area was determined using the BET method, and the pore size and volume were calculated using the Barret–Joyner–Halenda (BJH) method from the isotherm desorption branch for all samples.
2.5. Photocatalytic Degradation of Acetaminophen Experiments
Different photocatalytic experiments were conducted to compare the performance of ZnO/GO and ZnO/g-C3N4 nanocomposites in acetaminophen photodegradation under various conditions such as varied catalyst dose, solution concentration, and pH. This was performed in a beaker containing acetaminophen solution and the prepared samples as photocatalysts under UV-A irradiation (see Figure S1). Initially, 50 mL of 10 μg/mL of acetaminophen prepared using deionized water was mixed with 30 mg of the photocatalyst and stirred in the dark for 30 min. The stirred mixture was then irradiated for 180 min, and 0.5 mL was drawn at 30-min intervals. The catalyst was filtered by a syringe filter (0.45 μm PTFE membrane). The filtrate was analyzed using a Waters Synapt G2 high-definition mass spectrometry (HDMS) system (Waters Inc., Milford, Massachusetts, United States), which comprises a Waters Acquity ultra-performance liquid chromatography (UPLC) system hyphenated to a quadrupole-time-of-flight (QTOF) instrument. The system operated with MassLynx (Version 4.1) software (Waters Inc., Milford, Massachusetts, United States) enabled data acquisition and processing. Five microliters of sample was injected using an autosampler injector into a Kinetex 1.7 μm EVO C18 100 Å (2.1 mm ID × 100 mm length) column kept at 40°C with a flow rate of 0.4 mL/min for a 20 min run time. Separation was completed using a reverse phase step gradient elution scheme from 97% H2O (0.1% formic acid) to 100% acetonitrile (0.1% formic acid). The gradient started with an isocratic flow (hold 0.1 min), followed by a linear increase to 100% ACN; subsequently, the column was washed for 1 min, followed by conditioning and re-establishing of initial conditions to allow for equilibration before the start of the next run for the complete elution scheme. The positive ion mass spectra were collected in chromatographic runs.
Mass spectrometry was performed to detect acetaminophen photodegradation. The capillary voltage for ESI was set to 2.6 kV in positive ionization mode. The source temperature was set at 120°C, and the sampling cone voltage at 30 V for positive ionization mode. The extraction cone voltage was set at 4.0 V and the cone gas (nitrogen) flow at 15.0 L/h. The desolvation temperature was set at 350°C with a gas (nitrogen) flow of 600.0 L/h. Quantitative data-independent acquisition (DIA) was done using two simultaneous acquisition functions with low and high collision energy (MSE approach) with a QTOF instrument. Fragmentation was performed using high-energy collision-induced dissociation (CID). The high-energy ramp transfer collision energy was set from 20 to 30 V. Mass spectral scans were collected every 0.3 s. The raw data was collected in the form of a continuous profile. Mass-to-charge ratios (m/z) between 50 and 1200 Da were recorded.
3. Results and Discussion
3.1. XRD Analysis
The XRD patterns of the synthesized samples are shown in Figure 1. The ZnO peaks at different 2θ angles confirmed the formation of a hexagonal wurtzite structure as they matched those reported by [43]. In Figure 1(a), the GO peak at a 2θ value of 9.8° corresponds to the (001) plane and indicates the hexagonal structure of the graphene interlayers with intercalation of oxygen-containing groups [44, 45]. This peak was not observed in the ZnO/GO (1:5) nanocomposite; however, a broad low-intensity peak at about 24° was seen and is likely due to some reduction of GO during calcination. A broad low-intensity peak corresponding to the (002) plane formed at about 24.8° of 2θ in the GO samples and is typical of reduced GO and is usually attributed to interlayer spacing reduction [44, 45]. This peak was not seen in ZnO/GO (5:1) due to low GO concentrations or relatively large dispersion of ZnO nanoparticles on GO, resulting in GO sheets exfoliation [46]. In Figure 1(b), two peaks were observed in g-C3N4. The peak at 13.1° corresponds to the (100) crystal surface and indicates periodically stacked triazine repeat units, while the peak at 2θ value 27.1° corresponds to the (002) plane and is indexed as the periodic layer stacking [47].
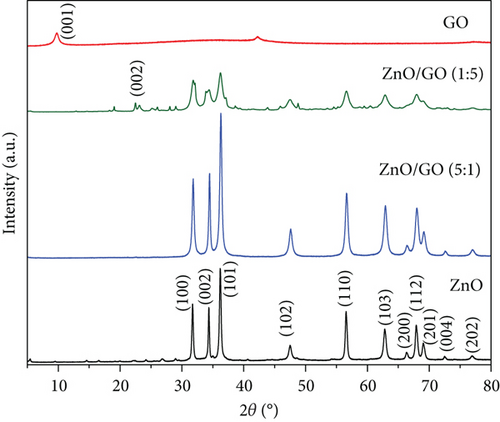
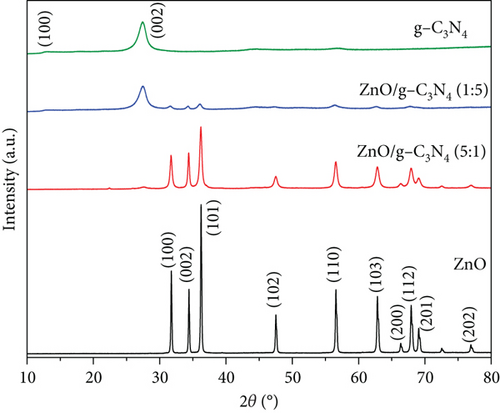
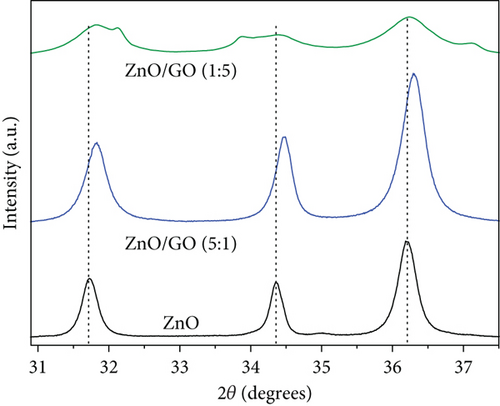
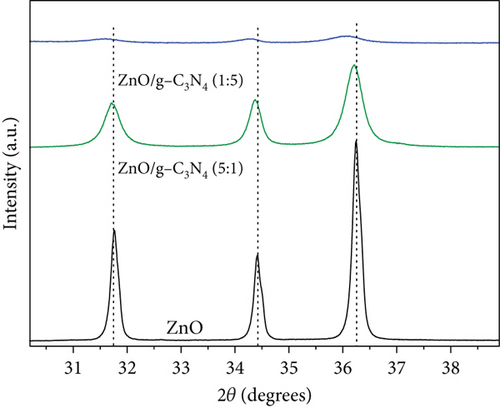
A decrease in intensity and broadening was observed in ZnO peaks with an increase in the amounts of GO and g-C3N4, and the relevant regions are expanded and presented in Figure 2. As expected, the crystallite sizes of the supported ZnO, on GO and g-C3N4, versus the unsupported ZnO were smaller (see Table 1). Our chosen method of synthesis was a modified deposition–precipitation method [48], where the precursor solution, zinc acetate, was contacted with the support, and then precipitation of precursor ZnO nanoparticles was induced with NaOH after 60 min. Graphitic nitrogen, such as that found in g-C3N4, is known to have electron donor-like properties [48–50]. Thus, when comparing the g-C3N4 and GO supports, the nitrogen-doped structure provides a favorable surface for bonding with the Zn2+ ions and likely provides a relatively larger number of nucleation sites, resulting in the growth of numerous ZnO precursor crystallites, unlike in GO, where interaction between the oxygen-containing groups and the zinc precursor results in fewer nucleation sites for ZnO, and thus relatively larger ZnO nanoparticles are favored. Prior work in the literature has noted the limitation of ZnO crystal growth [51] through the reduction of the reagglomeration and coalescing of ZnO precursor nanoparticles by g-C3N4 [37]. A decrease in the reagglomeration and coalescing of the ZnO particles corresponds to larger specific surface areas that provide more active sites for contaminant adsorption and photocatalytic reactions. The change in crystallite sizes was from 18 nm in pure ZnO to 14 nm for ZnO/GO (1:5), 16 nm for ZnO/GO (5:1), and 11 and 16 nm for ZnO/g-C3N4 (1:5) and ZnO/g-C3N4 (5:1), respectively. Typically, crystallite size reduction may also result in a wider band gap [52]; hence, higher energy is required to excite the electrons to the valence band. However, the formation of the respective composites seemed to have overcome these limitations. The peak shift in GO-based nanocomposites (Figure 2) can be attributed to defect-induced lattice strains [53], which may aid the mobility of the charge carriers for photocatalytic reactions.
| Sample | Crystallite size (nm) | dhkl (Å) (100) |
dhkl (Å) (002) |
a (Å) | c (Å) | c/a | Cell volume (Å)3 |
|---|---|---|---|---|---|---|---|
| ZnO | 18 | 2.816 | 1.142 | 3.252 | 5.214 | 1.603 | 47.76 |
| ZnO/GO (1:5) | 14 | 2.811 | 1.140 | 3.243 | 5.199 | 1.603 | 47.59 |
| ZnO/GO (5:1) | 16 | 2.804 | 1.145 | 3.237 | 5.243 | 1.620 | 47.37 |
| ZnO/g-C3N4 (1:5) | 11 | 2.817 | 1.141 | 3.253 | 5.212 | 1.602 | 48.06 |
| ZnO/g-C3N4 (5:1) | 16 | 2.821 | 1.143 | 3.257 | 5.230 | 1.606 | 47.78 |
A comparison of GO and g-C3N4 thermal stability (results shown in Figure S2 in the supporting information) indicated that g-C3N4 is more stable than GO. This was attributed to the strong covalent bonds between the g-C3N4 triazine ring, which make it thermally stable up to 600°C [54], while GO suffers disproportionation reactions in which part of the carbon atoms are oxidized into CO and CO2 and others are reduced when heated [55]. For this reason, g-C3N4 peaks were observed even after calcination, while GO peaks appeared to shift to other 2θ angles due to thermal reduction.
Equations (S1)–(S5) (in the supporting information) were used to determine the crystal size, lattice parameters, and cell volume. The values obtained are presented in Table 1. The presence of GO and g-C3N4 did not change the ZnO crystal orientation. A similar observation has been reported earlier [56]. However, there is a slight increase in the cell volume when comparing the ZnO/g-C3N4 (1:5) sample versus the ZnO/GO (1:5), associated with the slight changes in the lattice constants. Hence, the two different 2D nanosheet supports alter the resulting ZnO nanoparticles, although a similar sol–gel method was used to grow the nanoparticles.
3.2. FTIR Analysis
Figure 3 shows the FTIR spectra of the prepared samples. ZnO possessed a strong peak at 474 cm−1 caused by Zn–O bond stretching vibration [57]. The peak at 850 cm−1 was attributed to C–H bond bending vibration, while those at 1450 and 1550 cm−1 belonged to the stretching vibration of the zinc acetate COO bond arising from zinc acetate that may have remained in ZnO [58, 59]. The broad peak positioned at around 3400 cm−1 was associated with the O–H group [60]. In the g-C3N4 spectrum, the peak at 808 cm−1 was ascribed to the breathing vibration of triazine rings in its structure [61]. The broad absorption band between 1200 and 1600 cm−1 was associated with the stretching vibrations of C–N and C=N heterocyclic rings [62], while at around 3200 cm−1, it was attributed to the amine (N–H) and hydroxyl (O–H) groups on the surface [63]. In GO, the stretching vibrations of the O–H group, C=O, C=C skeletal vibration, C–OH, and C–O were identified at 3400, 1727, 1625, 1220, and 1050 cm−1, respectively [58, 64–66].
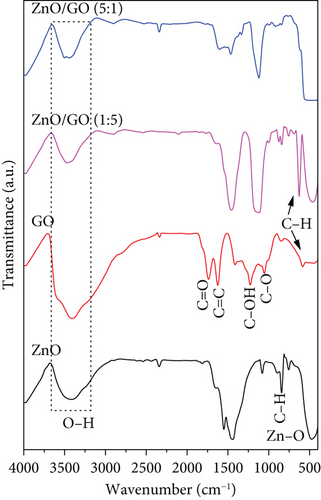
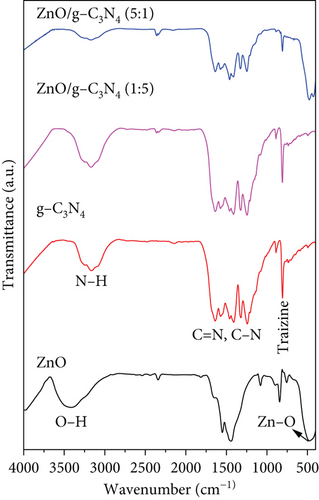
The characteristic peaks belonging to the components were displayed in the nanocomposites, although some peaks appeared to shift. A shift in peaks or reduction in peak intensities confirms nanocomposite formation [67]. The Zn–O peak was observed to shift to 464 cm−1 in ZnO/GO (1:5) and then broadened and stretched to 550 cm−1 in ZnO/GO (5:1) nanocomposite. On the contrary, the ZnO peak was not observed with the ZnO/g-C3N4 (1:5) sample, probably due to the weight ratios of ZnO to g-C3N4. In the ZnO/g-C3N4 (5:1) sample, the ZnO peak was observed at 480 cm−1, which is a slight red shift from 474 cm−1 (sol–gel ZnO), but a large blue shift when compared to the ZnO/GO (5:1) nanocomposite. This result correlates with the cell volume calculations from the XRD analysis, where the ZnO/g-C3N4 (5:1) sample had a slightly larger cell volume when compared to the ZnO/GO (5:1) nanocomposite.
A slight red shift in the triazine ring characteristic peak of g-C3N4 from 808 to 811 cm−1 was also observed. This was attributed to the weakening of C–N and C=N bond energy and bond strength, which confirmed a successful synthesis of a heterojunction rather than just a mixture [37, 68, 69]. The change in the intensity of this peak in the nanocomposites was associated with the weight of g-C3N4. In ZnO/GO nanocomposites, the peak intensities of the O–H functional group were reduced, indicating that they were affected by the increase in temperature. Also, weak shoulders appeared between 2840 and 2980 cm−1, corresponding to the stretching vibration of the C–H bond associated with the epoxide open circle [70]. The characteristic peak associated with C–O was observed to reduce in the nanocomposite, which may be a result of GO reduction [65]. The presence of C–OH and C=C peaks in the nanocomposites was an indication that they were not eliminated by the high temperatures [71]. Instead, these peaks were observed to shift to 1138 and 1464 cm−1, respectively, due to π-network restoration [72].
3.3. Morphological Studies
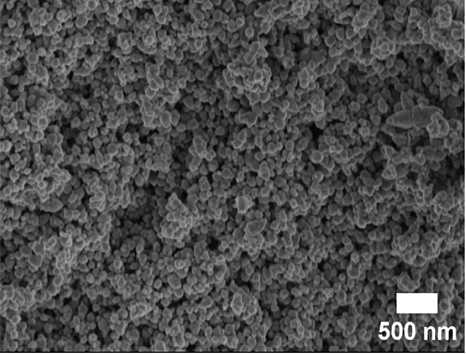
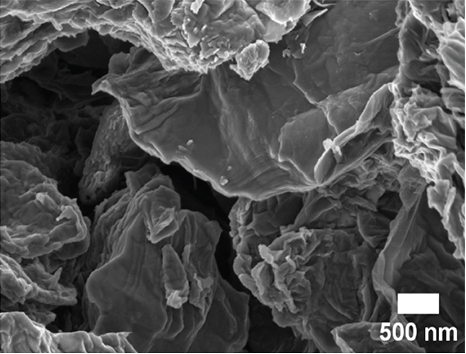
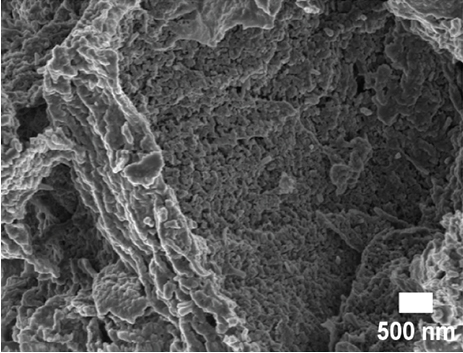
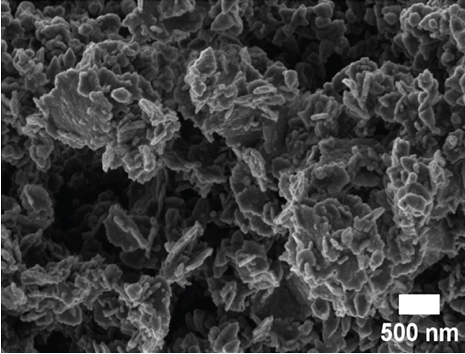
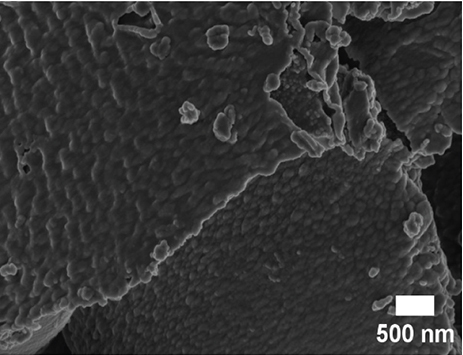
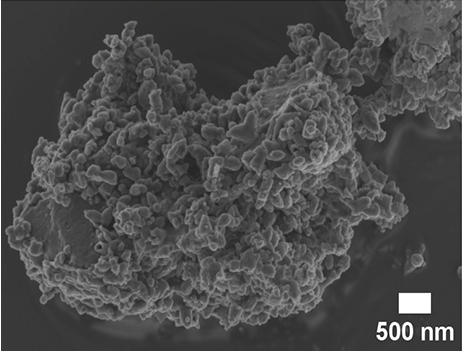
SEM and TEM analyses were performed to investigate the morphological properties of the nanocomposites. Figures 4(a), 4(b), 4(c), 4(d), 4(e), 4(f), and 4(g) show the SEM micrographs of the prepared samples. For pristine ZnO, a mixture of agglomerated spherical nanoparticles and triangular-like nanostructures with rounded corners was formed. The formation of these shapes in CTAB-assisted ZnO synthesis has been reported earlier [73]. Both GO and g-C3N4 possessed a sheet-like structure that seemed to show some minor differences in the nanocomposites, possibly due to the calcination steps. During calcination, GO may have undergone a process of the sheets separating due to the production of CO2 and CO gases generating pressure between the layers and hence exfoliation [71] and reduction (due to the heat) as observed in XRD analysis. The g-C3N4 may also have undergone exfoliation on heating [74]. The difference in their structures in the nanocomposite may not be discernible because they have a similar overall morphology (sheet-like layers) but different chemical and physical properties [75].

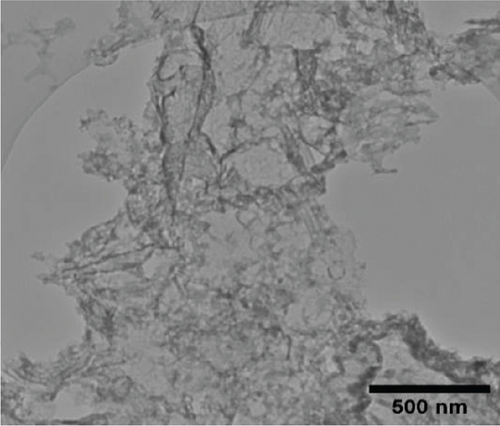
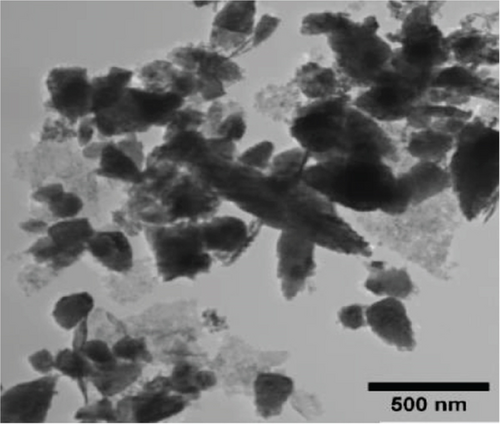
The TEM micrographs of pure ZnO displayed a mixture of different nanoparticle shapes with different sizes, as shown in Figure 5(a). Figures 5(b) and 5(e) confirmed the sheet-like structure of g-C3N4 and GO. ZnO nanoparticles were observed to adhere to the sheets in the nanocomposites with a clear interface forming between them and the GO and g-C3N4 sheets, which was presumed to be beneficial for charge carrier migration in photocatalysis, hence enhanced performance [76]. Agglomeration of ZnO nanoparticles was observed in Figures 5(d) and 5(g), where ZnO was more than GO and g-C3N4. The average ZnO particle sizes were 107, 165, 153, 171, and 307 nm for pure ZnO, ZnO/GO (5:1), ZnO/GO (1:5), ZnO/g-C3N4 (5:1), and ZnO/g-C3N4 (1:5), respectively, which is much larger than the crystallite size noted with the XRD analysis. The differences in crystallite size calculated from XRD analysis and the nanoparticle size from the TEM images emphasize that the ZnO samples are polycrystalline [77], and the various shapes observed under TEM show future work should explore morphology control. It is interesting to note some large tetrapod-shaped nanoparticles were formed in the ZnO/g-C3N4 nanocomposites, which have been shown to have some enhanced photocatalytic properties in certain systems [78, 79]. In photocatalysis, an increase in particle size limits photocatalytic performance due to surface area and density of active site reduction [80]. Other researchers have, however, reported enhanced performance ascribed to decreased charge recombination in larger particles [81].
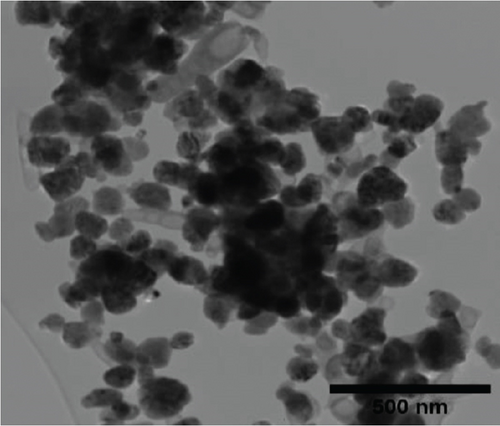
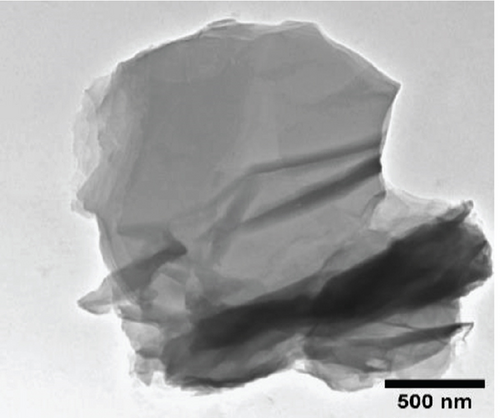
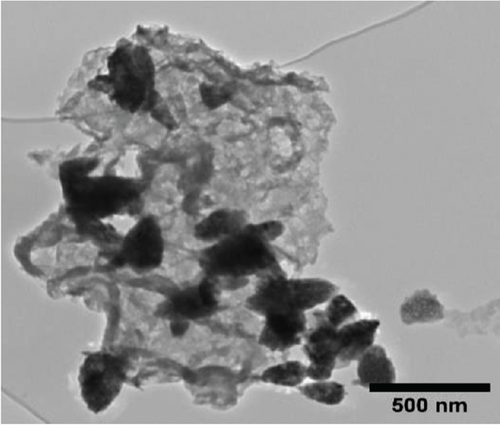
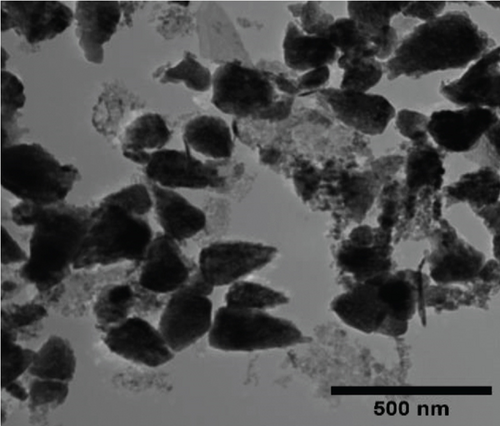
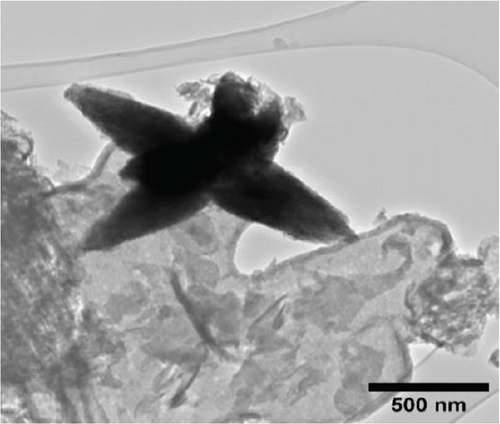
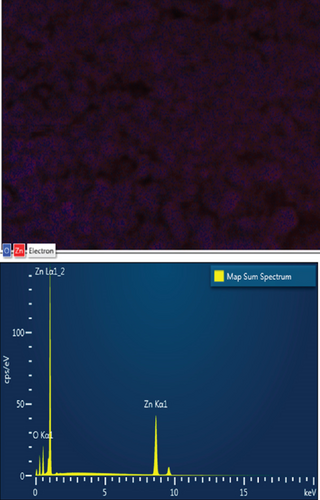
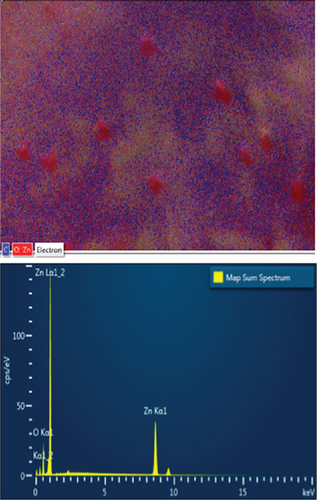
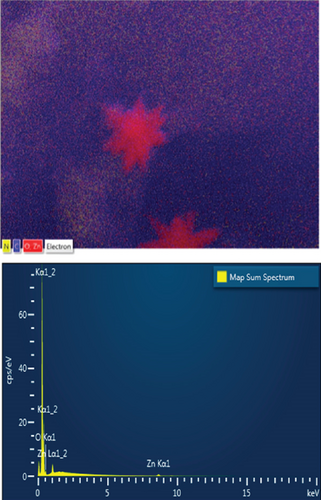
EDS elemental mapping and spectra of some samples are displayed in Figure 6, confirming the elemental composition and purity of the samples. The formation of flower-shaped ZnO in the ZnO/g-C3N4 (1:5) nanocomposite, as observed in TEM analysis, was also confirmed.
3.4. Textural Characterizations
The N2 adsorption–desorption isotherms of the prepared samples are presented in Figure 7. The unsupported ZnO nanoparticles can be classified as a Type V isotherm with Type H3 hysteresis loops as per IUPAC guidelines [82]. The isotherm does not display a knee (“Point B”), which is indicative of macroporosity likely from the ZnO nanoparticles forming loose aggregates. However, the sample shows a hysteresis loop typically attributed to adsorption–desorption from mesoporous materials. From the SEM (Figure 4(a)) and TEM (Figure 5(a)) images, the ZnO nanoparticles varied in shape and size; thus, when aggregated, the pores between the nanoparticles will likely vary between meso- and macroporous sizes. This correlates with the PSD data (see Figure S3(a)) for the ZnO nanoparticles, where the pore size distribution varied from 1 to 250 nm with a significant peak observed at 6.3 nm and a broad peak centered between 40 and 60 nm.
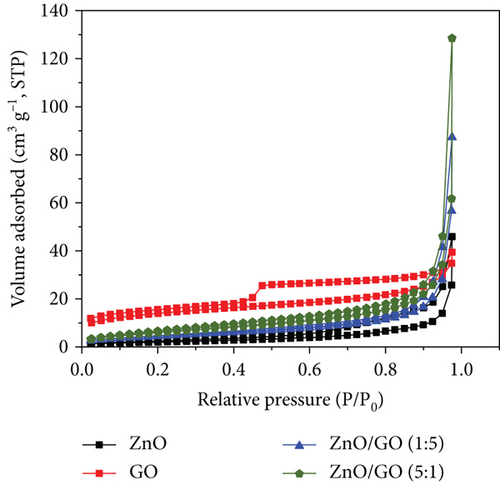
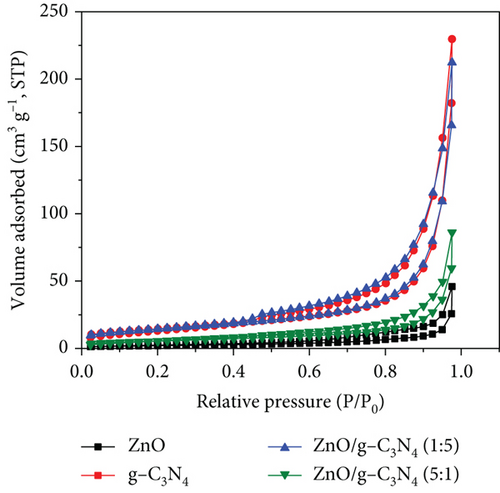
The GO sample isotherm can be classified as a Type IV with an H4 hysteresis loop associated with samples having both meso- and micropores [82]. The ZnO/GO (1:5) and ZnO/GO (5:1) samples had similarly shaped isotherms that lacked knee-like features at intermediate-low relative pressures and a narrow hysteresis loop. Using the IUPAC guidelines, the isotherms can be classified as a combination of Types III and V with relatively narrow hysteresis that can be classified as H3 hysteresis loops [82]. Similar observations were noted with the g-C3N4 samples, where the isotherms can also be classified as combinations between Types III and V, while both ZnO/g-C3N4 (1:5) and ZnO/g-C3N4 (5:1) showed a Type H3 hysteresis loop as per IUPAC guidelines [82]. The H3 hysteresis loops are attributed to loose aggregates or plate-like particles [82], and from the TEM images, the g-C3N4 supports consist of sheet-like nanostructures, which can account for the observed isotherms and hysteresis.
Table 2 shows the specific surface area and pore volumes of the samples. In photocatalytic applications, a larger surface area is considered to have enhanced performance due to more active sites for adsorption and reaction [62]. g-C3N4 and GO possessed higher surface areas characteristic of carbon-based materials. Both were observed to improve the ZnO surface area properties. In the nanocomposites, ZnO/g-C3N4 (1:5) had a relatively higher surface area and high pore volume, indicative of improved adsorption affinity and reaction sites for contaminants in photocatalysis, resulting in enhanced performance.
| Sample | S BET (m2/g) | Pore sizes (nm) | Pore volume (cm3/g) |
|---|---|---|---|
| ZnO | 7.569 | 6.281 | 0.102 |
| ZnO/GO (1:5) | 23.425 | 2.002 | 0.573 |
| ZnO/GO (5:1) | 16.641 | 3.709 | 0.383 |
| ZnO/g-C3N4 (1:5) | 51.163 | 3.725 | 1.710 |
| ZnO/g-C3N4 (5:1) | 19.919 | 3.711 | 0.410 |
| GO | 48.749 | 3.714 | 0.181 |
| g-C3N4 | 51.291 | 3.719 | 1.747 |
3.5. UV-Vis Absorption
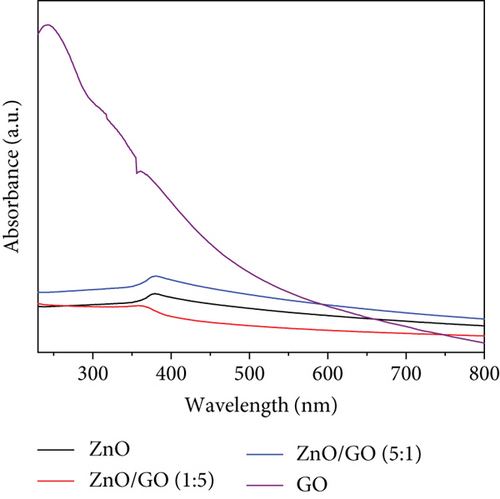
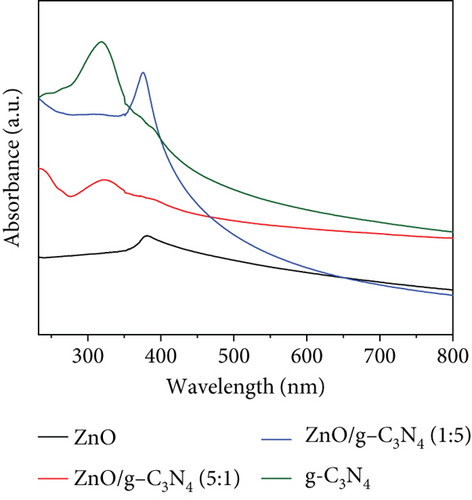
GO was observed to possess a higher absorbance compared to g-C3N4, which may be associated with its dark brown colour. The ZnO/g-C3N4 nanocomposites, however, displayed a higher absorbance than the ZnO/GO nanocomposites, which was promising in photocatalysis.
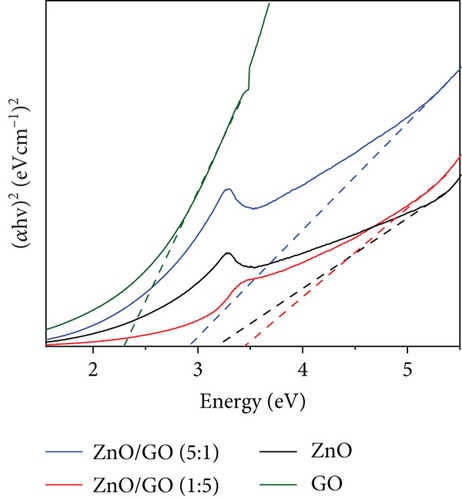
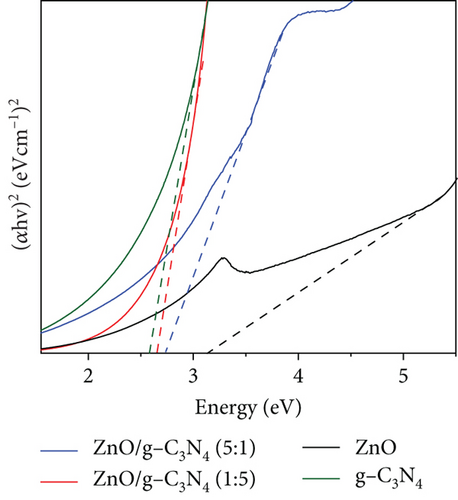
The ZnO band gap values were higher than the values measured on the GO and g-C3N4 nanocomposites, except with the ZnO/GO (1:5) sample. The values obtained from the Tauc plots in Figures 8(c) and 8(d) were 3.16 (pure ZnO), 2.29 (GO), 2.59 (g-C3N4), 3.44 (ZnO/GO (1:5)), 2.90 (ZnO/GO (5:1)), 2.74 (ZnO/g-C3N4 (1:5)), and 2.66 eV (ZnO/g-C3N4 (5:1)), respectively. The band gap of ZnO nanoparticles has been shown to vary with morphology and synthesis conditions [84, 85]. The increase in band gap value of the ZnO/GO (1:5) nanocomposite versus the pristine ZnO or GO is indicative of the formation of an active nanocomposite and can be attributed to several factors, such as an increase in the average nanoparticle size (as observed with TEM), agglomeration (as seen with SEM), and variations in nanoparticle morphology (see TEM images). The band gap reduction in the other nanocomposites was ascribed to effective chemical and electronic interaction between ZnO, GO, and g-C3N4 [39, 86]. With the ZnO/GO (5:1) sample, the reduction of the band gap, relative to pristine ZnO, can be attributed to the introduction of additional electronic states in the ZnO from the conjugated π system of the GO support, and enhanced charge transfer mechanisms within the nanocomposite [25, 87, 88]. Whereas with the ZnO/g-C3N4 (1:5) and ZnO/g-C3N4 (5:1) samples, the reduced band gap is attributed to chemical bonding between the ZnO and the g-C3N4 [89, 90]. A reduced band gap indicates a greater light-harvesting capacity, hence an improved photocatalytic performance [89–91].
3.6. PL Measurements
PL spectroscopy is essential in the determination of defect distribution in semiconductors [92]. It also gives an idea of the band edge emission of semiconductors [93]. Figure 9 shows the spectra of PL measurements done at room temperature at a 325 nm excitation wavelength [94].
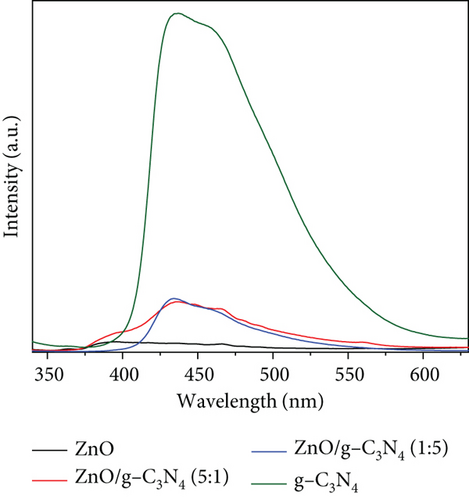
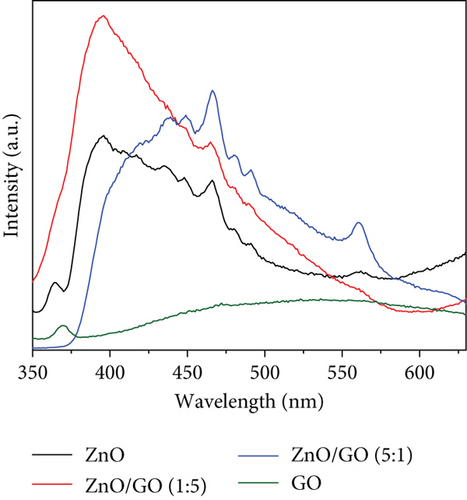
ZnO generally consists of two emission peaks: UV emission peak correlating to near band emission due to free recombination of excitons and a broad visible emission attributed to deep-level emission due to defects [95] within the ZnO band gap, such as donor zinc interstitial (Zni), donor oxygen vacancies (Vo), acceptor oxygen interstitials (Oi), and acceptor zinc vacancies (VZn). Oi and Zni are at 2.28 and 0.22 eV below the conduction band, and Vo and VZn are at 0.9 and 0.3 eV below the valence band [95]. In Figure 9, the pure ZnO spectrum displayed an emission at 365 nm, which is the near-band edge emission and indicated a direct band-to-band charge recombination [96]. The broad visible light emission showed defect states from oxygen and zinc vacancies [97]. The peak at 466 nm, a blue emission peak, was associated with electron transition from zinc interstitial defects or deep trap states on the semiconductor surface (VZn) [98]. Other reports attributed this emission to recombination from the conduction band to Oi sites [99]. The green emission peak at 560 nm was ascribed to defects close to the surface due to structural defects or impurities [100]. They indicate the transition of electrons from zinc interstitials to oxygen vacancies [101] or from VO to the photoexcited holes in the valence band [39]. Other authors associated green emission with oxygen vacancies that are singly charged () [102]. These defect-induced peaks were also observed to be pronounced in GO-based nanocomposites, indicating the presence of defect sites. While defects or trap states in photocatalysts may encourage charge recombination, their positive roles in photocatalysis include extending the absorption range [103] and acting as active sites on the semiconductor surface [104].
GO was observed to possess two PL peaks: one in the UV region and a broad band at higher wavelengths from 400 nm. The peak at 370 nm was associated with crystalline graphitic sp2 due to the graphite oxidation [105], while the broad peak originated from defect states induced by disorders in the sp2-hybridized carbon atoms π − π∗ gaps [106]. Compared with the ZnO and the ZnO/GO nanocomposites, its low peak intensity was associated with good conductivity of charges, hence less recombination. The quenched peak in the ZnO/GO (5:1) sample suggested improved charge transfer, hence reduced charge recombination compared to ZnO/GO (1:5) with high intensity. This was attributed to defects in the nanocomposite that acted as trap sites for charge recombination [107]. The g-C3N4 showed a strong emission peak at 450 nm ascribed to the high band–band direct charge recombination [108]. Similar results have been reported in the literature, where the intensity of the g-C3N4 sample is much greater than the composites or the pristine ZnO and is attributed to the high rate of electron-hole recombination [109–111]. A relative comparison between the supports and pristine ZnO clearly shows the PL intensity for GO is much lower than ZnO, and that the g-C3N4 is much greater than ZnO. These differences highlight how charge carrier generation and subsequent recombination are limited in GO when compared to g-C3N4 and can be attributed to the oxygen-containing groups on GO acting as trapping sites for nonradiative recombination of generated charge carriers [112]. When examining the ZnO/g-C3N4 samples, a significant quenching of the peaks was observed in the nanocomposites, which was associated with decreased electron-hole recombination and is beneficial in photocatalysis since the lower recombination rate should allow for greater availability of charge carriers for photocatalytic processes [109–113].
3.7. Photocatalytic Performance
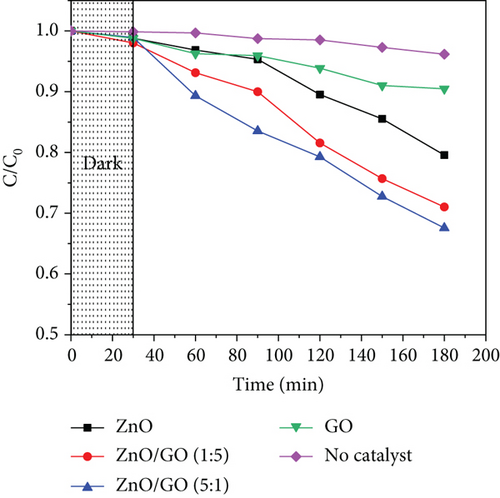
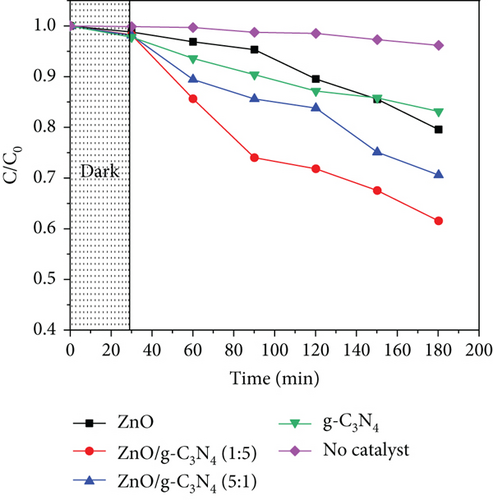
The photocatalytic performance of the samples was evaluated for 10 μg/mL acetaminophen in an aqueous solution of pH 7 using 30 mg catalyst under UV-A irradiation. Figure 10 shows their performance, where the nanocomposites possessed a higher efficiency than pristine ZnO, which was ascribed to the higher adsorption capacity of the nanocomposites due to their improved surface areas as observed in Table 3. As a result, more acetaminophen molecules were adsorbed on the surface of the nanocomposites. Additionally, enhanced charge carrier separation exhibited by the PL peak quenching may have resulted in the production of more radical species, hence greater performance. Although all nanocomposites registered a better activity than pristine ZnO, g-C3N4-based nanocomposites were observed to be more efficient than GO-based nanocomposites. This was attributed to the possibility of ZnO/g-C3N4 heterojunction formation, which further reduces the charge recombination [39]. Pure GO degradation was associated with the adsorption of acetaminophen molecules [114] through interactions between the GO and acetaminophen molecules. GO-based nanocomposites exhibited some degradation despite an increase or no change in the band gap, which may be due to defects and oxygen vacancies in its structure that acted as active sites [115]. An increase in GO content in the ZnO/GO nanocomposites, however, was observed to lower the performance, although GO was expected to increase the surface area for adsorption. A similar observation was reported earlier by [6], who ascribed this to the partial shielding of photons from reaching ZnO.
| Sample | Rate constant | R2 |
|---|---|---|
| ZnO | 0.0017 | 0.9056 |
| ZnO/GO (1:5) | 0.0022 | 0.9442 |
| ZnO/GO (5:1) | 0.0028 | 0.9722 |
| ZnO/g-C3N4 (1:5) | 0.0041 | 0.9753 |
| ZnO/g-C3N4 (5:1) | 0.0033 | 0.9711 |
| GO | 0.0014 | 0.9338 |
| g-C3N4 | 0.0031 | 0.9530 |
The logarithmic plots of concentration versus irradiation time confirm that they follow the first-order-kinetics theory with their rate constants and correlation coefficients shown in Table 3.
3.8. Effect of Photocatalytic Operation Parameters
3.8.1. Effect of Catalyst Dose
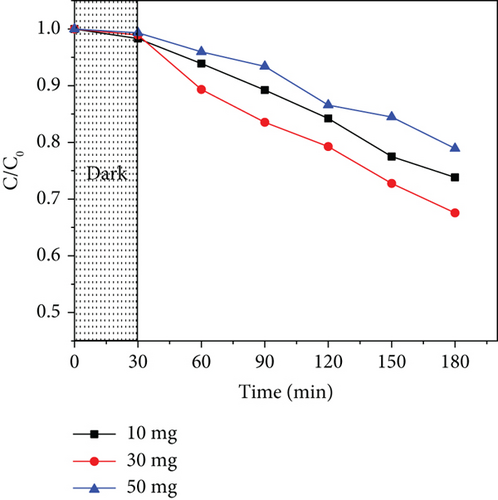
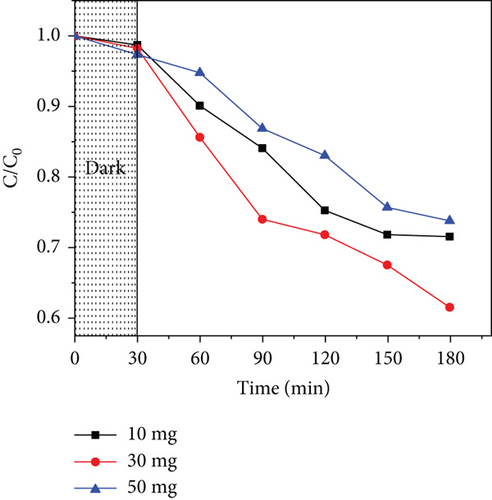
Three photocatalyst doses (10, 30, and 50 mg) were used to study the effect of catalyst dosage in acetaminophen photodegradation. Figure 11 shows the results obtained for ZnO/GO (5:1) and ZnO/g-C3N4 (1:5). In both cases, it was observed that at lower dosages of 10 mg, the photodegradation efficiency was low, which may be attributed to a few active sites. An increase in dosage to 30 mg resulted in improved activity due to an increased number of active sites. Further attempts to increase the dose to 50 mg resulted in lower activity, which was associated with increased opacity of the solution, hence reduced light penetration and absorption [116]. At high doses, the catalyst may also have aggregated, consequently reducing the surface area [117]. Additionally, acetaminophen may have interacted with the overdosed photocatalyst and formed clusters on the surface, consequently decreasing the number of active sites [118].
3.8.2. Effect of Initial Concentration of Acetaminophen
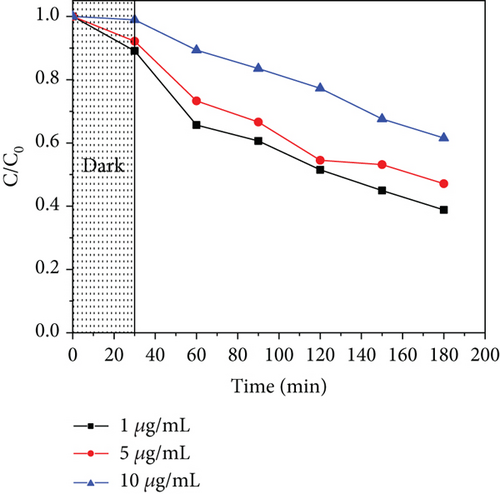
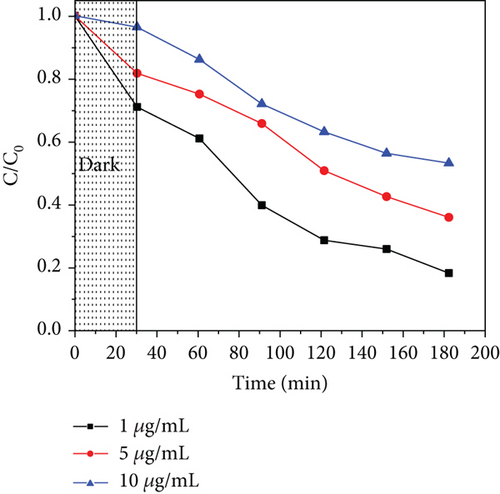
To study the effect of the initial concentration of acetaminophen, 1, 5, and 10 μg/mL were used, considering the environmental concentrations [8, 119]. Figure 12 illustrates the performance of the photocatalysts with increased concentration, where an increase in concentration lowers the photodegradation efficiency. At high concentrations, the number of active sites may be limited to the number of molecules to be adsorbed. At the same time, the intermediates produced compete with the parent molecules for active sites [120], and they also inhibit the photons from reaching the photocatalyst surface; hence, fewer radicals are produced and reduced photocatalytic activity [121].
3.8.3. Effect of Solution pH
The pH value of the solution affects the surface charge of the photocatalyst, thus affecting photodegradation. To evaluate this, different solution pH values (2, 7, and 11) were used, taking into consideration acidic, neutral, and alkaline systems. The results obtained are shown in Figure 13. Photodegradation was observed to increase as the solution pH was increased from 2 to 7. The performance was, however, observed to reduce at higher solution pH values for both ZnO/GO and ZnO/g-C3N4 nanocomposites.
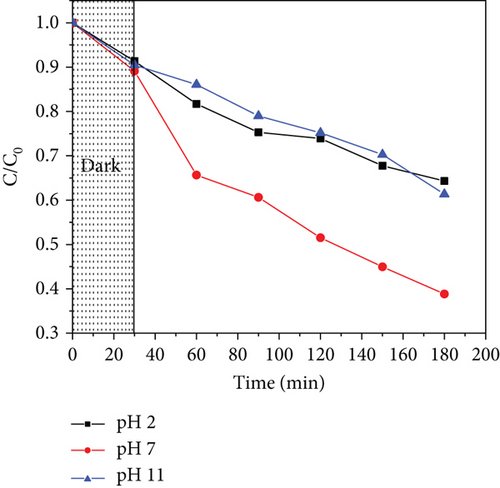
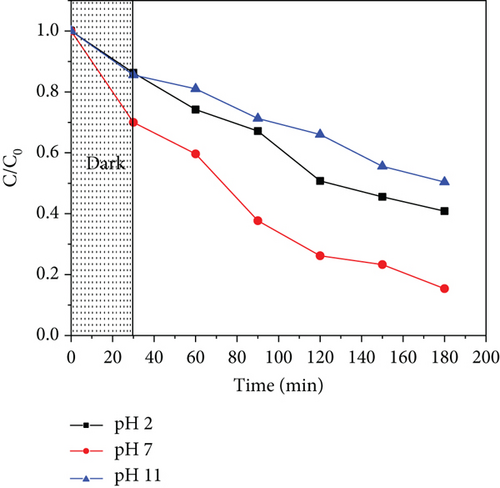
The effect of pH depends on the point of zero charge (pHpzc) of the photocatalyst, which is the point where the charge on its surface is neutral [122]. It becomes negatively charged when the solution pH is greater than its pHpzc and vice versa. The pHpzc of ZnO/GO and ZnO/g-C3N4 is about 6.9 [91, 123], indicating that their surfaces are negatively charged at high pH values and positively charged at low pH values. Acetaminophen, which exists in a nonionic form at pH values less than 7, becomes charged at pH values higher than its pKa (9.3) [124].
The photocatalyst surface charge is positive at low solution pH, while acetaminophen is neutral. The increase in photodegradation in this case is associated with the increase in OH− ions; hence, more hydroxyl radicals as the pH is increased up to 9.3 [124]. For solution pH higher than 9.3, repulsion occurs between the photocatalyst surface and acetaminophen since they are negatively charged. Consequently, adsorption and hence photodegradation are lowered. The photodegradation efficiencies of ZnO/GO (5:1) and ZnO/g-C3N4 (1:5) at pH 7 were obtained to be 61.2% and 84.6%, respectively, which revealed that ZnO/g-C3N4 nanocomposites were more superior than ZnO/GO nanocomposites, although their degradation efficiencies were relatively lower than those reported in some of the previous studies done on acetaminophen photodegradation as depicted in Table 4.
| Catalyst | Acetaminophen concentration | Catalyst dosage | Irradiation (time) | Deg% (pH) | Reference |
|---|---|---|---|---|---|
| ZnO/g-C3N4 (1:5) | 1 μg/mL | 0.03 g/50 mL | 100 W UV-A (180 min) | 84.6% (7) | This work |
| ZnO/GO (5:1) | 1 μg/mL | 0.03 g/50 mL | 100 W UV-A (180 min) | 61.2% (7) | This work |
| Ag/ZnO | 5 μg/mL | 0.15 g/L | 8 W UV lamp (35 min) | 94% (11) | [125] |
| Ag/ZnO | 5 μg/mL | 1 g/L | 300 W tungsten halogen lamp (120 min) | 90.8% (8.5) | [121] |
| Ag/g-C3N4/ZnO | 40 μg/mL | 0.08 g/L | 300 W solar simulator lamp (180 min) | 85.3% (7) | [126] |
| Synthetic ZnO | 20 μg/mL | 0.1 g/50 mL | 0.00146 W solar simulated (60 min) | 100% (9) | [124] |
| WO3/TiO2/SiO2 | 10 μg/mL | 1.5 g/L | 500 W xenon lamp (240 min) | 95% (9) | [118] |
| ZnO/g-C3N410% | 30 μg/mL | 20 mg/100 mL | 500 W xenon lamp (60 min) | [127] |
3.9. Scavenger Test
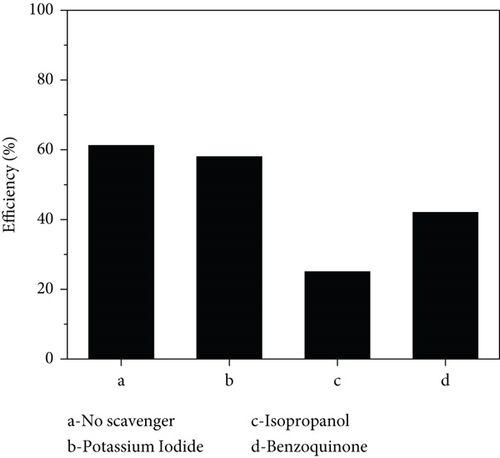
A scavenger test was performed to investigate the reactive species that actively affected the photodegradation process. Isopropanol, benzoquinone, and potassium iodide were used to trap •OH, O2•−, and holes (h+), respectively, with the scavenger concentration kept at 1 mM in all reactions [128]. The degradation efficiencies in the presence of the scavengers are depicted in Figure 14, and the proposed acetaminophen photodegradation pathways are in Figure S4. The hole scavenger caused a negligible change in the photodegradation efficiency, indicating that holes did not play a major role in the process. The •OH and O2•− scavengers caused a significant change in the efficiencies showing that they were actively involved with •OH radicals playing the major role in both nanocomposites. In ZnO/GO, the excitation of electrons from the valence to the conduction band in ZnO resulted in valence band holes, which may have reacted with water and hydroxyl ions to form •OH, as indicated in Figure S5a. The electrons in the conduction band and transferred to the GO surface may have also reacted with oxygen in water to form O2•−. Both radicals mineralized acetaminophen, lowering its concentration. In ZnO/g-C3N4, a Type II heterojunction may have formed between ZnO and g-C3N4. Light irradiation excited electrons in the g-C3N4 semiconductor, and since the g-C3N4 conduction band is more negative than ZnO [129], the excited electrons moved from g-C3N4 to the ZnO conduction band. At the same time, holes moved from the ZnO to the g-C3N4 valence band due to the potential difference, as shown in Figure S5b. The holes in ZnO, however, resulted in hydroxyl radical production since its valence band edge is more positive than the hydroxyl radical oxidation potential [130].

3.10. Reusability
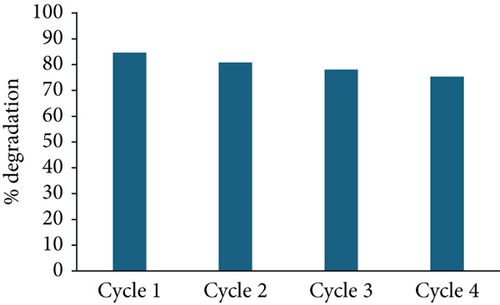
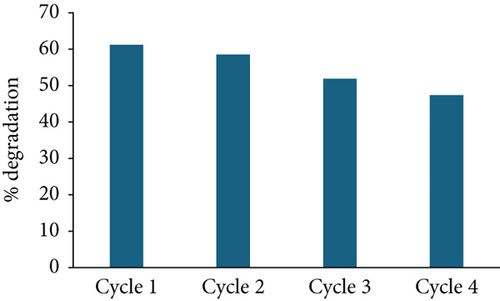
To assess the stability of the prepared photocatalysts, ZnO/g-C3N4 (1:5) and ZnO/GO (5:1), which portrayed better performance, were recovered and reused. After every photocatalytic experiment cycle, samples were recovered by centrifuging the contaminant and photocatalyst mixture. The product was washed with water and ethanol, dried overnight, and reused under similar conditions. This procedure was repeated four times. Figure 15 shows the degradation performance of the photocatalysts in the four cycles. ZnO/g-C3N4 (1:5) displayed better stability than ZnO:GO (5:1) for degradation capacities after four cycles, possibly due to the loss of more photocatalysts in the latter. However, both photocatalysts can be employed for practical applications.
4. Conclusion
Acetaminophen is a widely used pharmaceutical for pain and fever relief. It is among the persistent water contaminants. Fortunately, it can be mineralized into simpler compounds that are less harmful to the environment through the action of highly reactive radicals in the presence of light. This study compared the performance of ZnO/GO and ZnO/g-C3N4 nanocomposites in the photodegradation of acetaminophen. ZnO/g-C3N4 was found to be more efficient. The GO and g-C3N4 load in the nanocomposites was observed to affect the photocatalytic performance. Other parameters such as catalyst load, acetaminophen initial concentration, and pH were also observed to affect the photodegradation efficiency. Under optimized conditions (30 mg/50 mL, 1 μg/mL at pH 7), 84.6% and 61.2% of acetaminophen mineralization were achieved by ZnO/g-C3N4 (1:5) and ZnO/GO (5:1), respectively. Scavenger tests indicated that both O2•− and •OH were responsible for photodegradation in ZnO/GO and ZnO/g-C3N4 with •OH radicals playing a major role. The capacity of the nanocomposites to mineralize acetaminophen demonstrates their potential application in environmental remediation.
Disclosure
Part of the work in this manuscript was presented at the 12th International Conference of the African Materials Research Society (AMRS) held from the 16th to the 19th of December 2024 in Kigali, Rwanda.
Conflicts of Interest
The authors declare no conflicts of interest.
Funding
The work was funded by the University of Pretoria and the Partnership for Skills in Applied Sciences, Engineering and Technology (PASET), an Africa-led, World Bank-affiliated initiative for a Regional Scholarship and Innovation Fund (RSIF).
Acknowledgments
J.C. is grateful to the Partnership for Skills in Applied Sciences, Engineering and Technology (PASET), an Africa-led, World Bank-affiliated initiative for a Regional Scholarship and Innovation Fund (RSIF) bursary to complete her PhD studies. The authors acknowledge the University of Pretoria and PASET for funding and research support.
Open Research
Data Availability Statement
Data will be made available upon reasonable request.


