Pollutant Removal From Paint, Mortar, and Reinforced Composite and Evaluating the Engineering Properties by Incorporate the Photocatalyst: BaTiO3
Abstract
The present work explores to study the pollutant removal properties of mortar, concrete, and paint by incorporating the BaTiO3 as photocatalysts with different dosages (0.5%, 1%, and 2%) replaced by weight of cement and 20 g in white paint of 40 mL. To investigate the pollutant removal property of specimens prepared with Ordinary Portland Cement (OPC) and white cement (WC) and white paint on ordinary wall, Rhodamine B dye is used as a pollutant. The pollutant removal property was investigated for 4 days in laboratory experiment and 4 days in the field experiment. It was observed that the specimen having dosage of 2% photocatalyst have the best result in pollutant removal than the other specimen in laboratory experiment. The catalyst shows pollutant removal ability in white paint even in the presence of sunlight effectively and maintains the color’s grace of the paint. The compressive strength increased with the addition of a photocatalyst, and other engineering properties of the specimens were the same even at different dosages of the photocatalyst. The photocatalyst BaTiO3 remove the pollutant from paint, mortar, and reinforced composite without affecting the all the engineering properties.
1. Introduction
Urbanization and industrialization are becoming dominant forces in shaping global development patterns, the reasons for the huge enhancement in anthropogenic pollution in the preceding decades. Due to this, there has been a major decline in the esthetic scrutiny of building structures, especially by the accumulation of air pollutants [1].
Among the key contributes to the urban air pollution are nitrogen oxides; carbon dioxide (CO2); carbon monoxide; polycyclic aromatic hydrocarbons (PAHs); ozone; heavy metals (including Pb, Cd, Cu, Cr, Ni, Se, and Zn) and volatile organic compounds (VOCs); dust (PM2.5–PM10); and microorganisms; such atmospheric containments are emitted by the range of mobile sources such as motor vehicles, locomotives, construction equipment’s, etc and stationary sources such as manufacturing plants of cements, glass, and coals. The cement manufacturing principally emits a great amount of CO2 into the atmosphere, causative to global warming [2, 3]. Containments available in the atmosphere also go the through physiochemical changes, producing other harmful substances, sediments that appear on buildings, and participate to the deterioration of building materials [2]. The expansion of civil engineering has required pioneering techniques to control stability, sustainability, and performance measures of safety [4].
- •
Photocatalysis involves the utilization of semiconductor materials that, upon exposure to sunlight, generate electron-hole pairs capable of oxidizing and decomposing organic and inorganic pollutants. This mechanism is highly effective in air purification, water treatment, and self-cleaning surfaces.
- •
Piezocatalysis, on the other hand, leverages mechanical stress to induce charge separation in piezoelectric materials, facilitating the breakdown of contaminants even in the absence of light. This process is particularly beneficial for environmental remediation in low-light or indoor conditions.
Both photocatalysis and piezocatalysis have gained considerable attention in recent years due to their effectiveness in environmental purification. The development of self-cleaning materials and the exploration of their structure–function relationships, as well as techniques for fabricating variable–wettability artificial surfaces, have become an active area of research in materials science [5]. These materials have broad applications, ranging from interior solutions such as fabrics, upholstery materials, and glass to exterior building materials, roofing tiles, automotive mirrors, and solar panels [5, 6].
1.1. How Self-Cleaning Material Was Invented and Its History
The self-cleaning characteristic of cement was first introduced by Italian chemist Luigi Cassar, who pioneered the incorporation of titanium dioxide (TiO2) into cement materials. This compound utilizes sunlight to trigger an oxidation process that degrades airborne pollutants [6, 7]. This innovation led to the development of a durable building material capable of maintaining its brightness and cleanliness in polluted environments through a mechanism known as “photocatalysis.” This process harnesses solar energy to repel dirt and break down harmful substances. Notably, experimental observations revealed that the air surrounding concrete treated with this material showed up to an 80% decrease in nitrogen oxides. Reductions were also recorded for other hazardous compounds like lead, carbon monoxide, and sulfur dioxide. A timeline of key developments in the research and application of photocatalytic materials is depicted in Figure 1 [4, 8, 9]. In the early 2000s, the Dives in Misericordia church in Italy became a case study for photocatalytic cement, tested through the discoloration of Rhodamine B (RhB) dye. Subsequently, the launch of the PICADA project marked the production of the first generation of these advanced materials (Figure 1). Through this approach, a thin surface layer of photocatalytic cement has been shown to purify both the concrete structure itself and the surrounding urban air [6, 7].

Self-cleaning is widespread in nature, such as lotus leaves, rice, butterfly wings, and fish scales. Microscopic structures lead to highly hydrophobic surfaces. Therefore, when the water droplets roll off the leaves, they also remove dust and dirt particles. This mechanism is commonly known as the “lotus effect” [7].
- 1.
Surfaces can exhibit oleophobic or superhydrophobic properties, characterized by a contact angle greater than 150°, which significantly reduces dirt and oil adsorption [8–10]. These surfaces repel water and nonpolar substances, helping prevent the accumulation of contaminants and aiding in self-cleaning.
- 2.
In contrast, hydrophilic or superhydrophilic surfaces have a contact angle of less than 10°, allowing water to spread uniformly and facilitating the easy removal of water stains, especially during rain exposure [11, 12].
- 3.
The combination of hydrophobic and oleophobic properties reduces the adhesion of both water-based and oil-based dirt, contributing to enhanced self-cleaning performance. This makes such surfaces particularly useful in environments prone to dust, pollution, or moisture.
- 4.
Additionally, semiconductor-based photocatalytic additives play a vital role in decomposing organic impurities under light exposure, further improving the depolluting efficiency of treated surfaces [2]
In the past few years, semiconductor-based photocatalysis, an “eco-friendly” technology, has been acknowledged greatly due to its potential applications in wastewater decontamination. This technology offers a meticulous advantage in that it can breakdown the organic dyes into nontoxic inorganic substances with the help of solar radiation as an energy source [13]. As we know, almost 43% of the sun’s radiant energy is in the form of visible light, and nearly 7% of the energy is ultraviolet [14].
- •
After reactions with pollutants, the photocatalyst keeps surfaces as hygienic as possible to create a cleaner atmosphere. These materials are not exclusive in that they perform diversified functions.
- •
There are also some other benefits such as reduced maintenance (cleaning procedures) as well as energy savings in building cooling due to lower temperatures [4]
Such surface phenomena in building materials are typically achieved through the application of specialized coatings or the incorporation of additives that modify their composition and microstructure [2].
More than 50 semiconductor systems have been researched to discover a suitable arrangement to offer efficient visible light photocatalysis [15, 16]. The incorporation of the most promising heterogeneous semiconductor photocatalytic materials such as oxides (TiO2, ZnO, ZrO2, etc.) and sulfides (ZnS and CdS) has been recognized to solve the abovementioned problems, which encourage self-cleaning properties in concrete that cause the decomposition of the impurities on the building surfaces [16–18]. Undoubtedly, first-generation TiO2 is an excellent photocatalyst in the ultraviolet range. Its wide band gap of 3.2 eV precludes its utilization in the visible region. For that reason, there is a necessity of extending the response of wide band gap photocatalysts to visible light [14].
Despite significant growth in the domain of photo, there are still some intractable troubles hindering the practical approaches, such as poor consumption of visible light, low separation frequency rate of photo-generated carriers, and lack of chemical reaction in the dark. For that cause, novel catalytic technologies are extremely desirable [19].
Piezocatalysts have received significant concentration in recent years that has shown great potential in several domains, such as photocatalysis of organic matter decomposition, water splitting, photoreduction of CO2 because of having a wide band gap, outstanding catalytic action, better chemical stability, and best biocompatibility [14].
Due to their abovementioned extraordinary properties, they have truly replaceable semiconductors of conventional photocatalysts. These multifunctional piezocatalysts have the benefit of exploiting omnipresent mechanical vibrations and dropping their dependence on visible light. Titanate-based piezoelectric materials such as CaTiO3, SrTiO3, and BaTiO3 demonstrate superior chemical reactivity than TiO2 [14, 17, 20].
Barium titanate (BaTiO3), a ternary metal, is one of the promising candidates for piezophotocatalytic applications. It is associated with a large family unit of compound having the general formula ABO3, also identified as perovskite titnates having high dielectric constant as well as ferroelectric characteristics [14, 21, 22]. Additionally, it is also regarded as the first polycrystalline ceramic material, discovered in the 1950s. The wide band gap of BaTiO3 is 3.25 eV, making itself the most important semiconductor under the UV light [14]. In piezoelectric catalysis, a piezoelectric semiconductor acts as a catalyst. On its surface, free electrons (e−) and holes (h+) are generated by mechanical strain and further separated by a piezoelectric potential under super band gap irradiation. [20, 22, 23].
A sequence of redox reactions subsequently takes place, generating vigorous free radicals and a range of electrochemical reactions such as the splitting of water and the decomposition of organic contaminants [24–26]. Utilizing the synergistic effect of photocatalysts and piezocatalysts to further improve dye decomposition efficiency and promote the application of photocatalysts is needed.The decomposition reaction rate of the organic dye (RhB) utilizing the piezophotocatalytic coupling effect is 5.62 times and 11.0 times that of the individual photocatalyst and piezocatalyst [20, 27]. Photocatalytic activity–synthesized samples were evaluated by taking RhB as the target contaminant under visible light irradiation. An ecological approach of photocatalysis is shown in Figure 1 and Table 1.
| Sr. no. | Reference | Year | Description |
|---|---|---|---|
| 1 | Awadalla | 2011 | This investigation is based on the impact of self-cleaning photocatalyst titanium dioxide (TiO2) on the porosity of various waste materials. The study connected to carbon dioxide photodegradation to cement porosity. |
| 2 | Folli and Aandrea | 2012 | In this study, the author examined the integration of TiO2 incorporate with cement to assess its depolluting properties using Rhodamine B (RhB) dye. |
| 3 | Shen | 2015 | TiO2 nanoparticles are incorporated with the calcium silicate hydrate (C-S-H) to form self-cleaning concrete. As a result of this characteristic, contaminants were washed away by rain. |
| 4 | Li and Liu | 2016 | In this research, TiO2-EMR cement was formulated using a sol–gel dip-coating method, demonstrating enhanced not only self-cleaning properties but also mechanical strength. |
| 5 | Garcia | 2018 | This investigation focused on the fabrication and characterization of glass-reinforced concrete (GRC) with self-cleaning and pollutant degradation properties. TiO2 remained on the surface, but NOx degradation efficiency decay with aging. |
| 6 | Quiroga | 2018 | This study explored the effect of TiO2 self-cleaning coatings on cement durability and their long-term effectiveness in degrading synthetic stains (Rhodamine B). |
| 7 | He et al. | 2019 | This research developed self-cleaning cement-based composite materials (SSCCMs) with hydrophobic and luminescent properties, evaluating their luminous effects and water-repellent characteristics. |
| 8 | Hamidi and Aslani | 2019 | In this analytical study, TiO2-based photocatalytic cement materials are discussed, including applications, challenges, and the role of TiO2 in reducing NOx pollution. |
| 9 | Hipolito | 2019 | This investigation examined substitute construction materials coated with bismuth-based photocatalysts, such as fly ash and sodium carbonate. BiO3CO3 demonstrated high photocatalytic efficiency. |
| 10 | Li and Zhang | 2019 | In this investigation, supplemental cementitious materials (SCMs) such as limestone and diatomite were used in place of regular cement to produce “green concrete” that has a 50% lower potential to cause global warming. |
| 11 | Papanikolaou and Arena | 2019 | This study explored graphene nanoplatelets (GNPs) as functional fillers in self-cleaning cement, highlighting their lower CO₂ emissions—248 times lower than Ordinary Portland Cement. |
| 12 | Szymanowski | 2019 | In this investigation, various testing methods and factors influence the adhesion of surface coatings to construction materials. |
| 13 | Witkowski | 2019 | The air detoxification efficiency of photocatalytic concrete was evaluated after 7 years of exposure in a moderate Polish climate, confirming the long-term stability of TiO2 agglomerates and the material’s sustained ability to remove nitrogen oxides (NOx) from the surrounding environment. |
| 14 | Yang | 2019 | Enhanced NOx abatement and self-cleaning performance by incorporating g-C3N4 nanosheets (CNNs) into photocatalytic cement. |
| 15 | Dalawai | 2020 | Reviewed the advantages of self-cleaning technology (SCT), durability, fabrication methods for photocatalytic surfaces, and its applications across various sectors. |
| 16 | Vaidevi and Kala | 2020 | Various testing methods were presented to evaluate the stability and resistance to segregation of self-compacting concrete, ensuring its consistency and performance in practical applications. |
2. Material
2.1. Ordinary Portland Cement (OPC)
In this study, 53-grade OPC was used. Necessary tests to determine the physical properties of the cement covering parameters like consistency, specific gravity, and initial setting time (IST) and final setting times (FST) were done. The obtained test results are shown in Tables 2 and 3.
| Sr. no. | Test description | Test method | Unit | Value | Requirement as per IS 269-2015 | Significance |
|---|---|---|---|---|---|---|
| 1 | Specific gravity | IS-4031 (Part 11) [28] | — | 3.15 | — | Signify the density of cement which is crucial for accurate calculation of mix design and weight–volume conversions. |
| 2 | Consistency | IS-4031 (Part 4) [29] | % | 30 | — | Necessary to calculate the amount of water for cement paste to achieve the desired standard workability. |
| 3 | Initial setting time | IS-4031 (Part 5) [30] | Minutes | 90 | Min 30 | Represents the time available for mixing and placing before the paste begins to stiffen. |
| 4 | Final setting time | IS-4031 (Part 5) [30] | Minutes | 145 | Max 600 | Indicates the time taken for the cement to completely set; affects finishing and curing. |
| Sr.no. | Test description | Test method | Unit | Value | Requirement as per IS 269-2015 |
|---|---|---|---|---|---|
| 1 | Specific gravity | IS-4031 (Part 11) [28] | — | 3.08 | — |
| 2 | Consistency | IS-4031 (Part 4) [29] | % | 30 | — |
| 3 | Initial setting time | IS-4031 (Part 5) [30] | Minutes | 103 | Min 30 |
| 4 | Final setting time | IS-4031 (Part 5) [30] | Minutes | 140 | Max 600 |
| 5 | Degree of whiteness | IS-8042 (Annexure B) [31] | % | 88 | Min 70 |
2.2. White Portland Cement
Before using White Portland Cement, the degree of whiteness and specific gravity tests were conducted as per IS standards 8042 and 4031, respectively. Testing was carried out at room temperature and 65% relative humidity. The values of the test results of the cement are shown in Table 3.
2.3. Water
The locally available potable water was used for the mixing of composites. Before using, it was ensured that the water is free from any type of oil, grease, or any other harmful materials. Physical examination and laboratory tests were performed as per IS 3025, and the value of the test results was compiled with the IS 456: 2000 specification [31]. The values of the test results of the water are presented in Table 4.
| Sr. no. | Test | Test method | Unit | Value | Requirement |
|---|---|---|---|---|---|
| 1 | pH value | IS-3025 (Part 11) [32] | — | 6.5 | Min 6.0 |
| 2 | Organic | IS-3025 (Part 18) [33] | mg/L | 56.52 | Max 200 |
| 3 | Inorganic | IS-3025 (Part 18) [33] | mg/L | 445.00 | Max 3000 |
| 4 | Sulfates as SO3 | IS-3025 (Part 24) [34] | mg/L | 68.500 | Max 400 |
| 5 | Chloride as CL | IS-3025 (Part 32) [35] | mg/L | 135.10 | 2000 for concrete not containing embedded steel |
2.4. Fine Aggregate (FA)
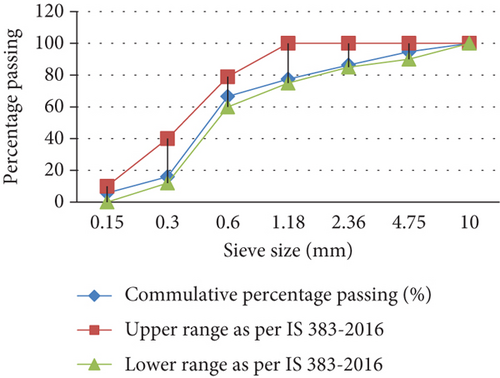
River sand of zone II was used in our study. Before use, it was ensured that the FA was moisture-free. To ensure this, the FA was taken in a tray and then kept inside the thermostatically controlled oven at a temperature of 100°C–110°C for 3 h. After that, physical tests such as gradation, silt content, specific gravity, and water absorption were determined as per IS 2386 Parts 1 and 3 [36, 37] and met the requirements as per IS 383: 2016 [9]. The values of the test results of the physical characteristics of the FA are shown in Figure 2.
2.5. Coarse Aggregate
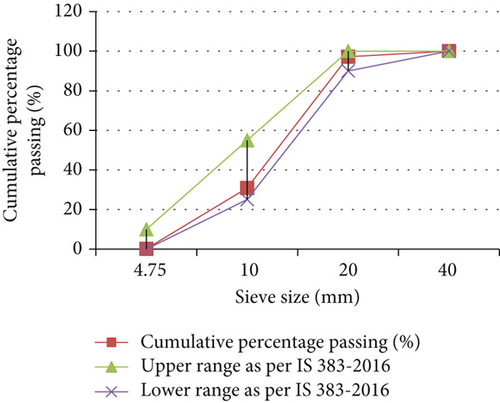
The coarse aggregates used in this study were naturally available. The coarse aggregate employed in the research had an extreme size of 20 mm, conforming to IS-383-1970. The fineness modulus of the coarse aggregate with a size of 10 mm and 20 mm was documented in Figure 3. The weight of the sample taken for analysis was 5000 g. The other physical characteristics of FA and coarse aggregate are shown in Table 5.
| Sr. no. | Parameters | Test method | Coarse aggregate | Fine aggregate | Requirement (as per 383-2016) [7] |
|---|---|---|---|---|---|
| a | Specific gravity |
|
2.70 | 2.67 | — |
| b | Impact value (%) |
|
12.00 | — | Not exceed 45 |
| c | Crushing value (%) |
|
19.15 | Not exceed 30 | |
| d | Water absorption (%) |
|
0.40 | 1.00 | — |
| f | Flakiness and elongation (combined) |
|
14 | NA | Not exceed 40 |
2.6. BaTiO3 Nanopowder and Its Crystallographic Investing
The study employed BaTiO3 nanopowder as a heterogeneous photocatalyst, leveraging its dual photocatalytic and piezocatalytic functionality. The BaTiO3 nanopowder used in this study is a commercially available product sourced from Sigma-Aldrich. According to the supplier’s datasheet, the powder exhibits a tetragonal perovskite structure as confirmed by X-ray diffraction (XRD) analysis.
- •
Phase composition: predominantly tetragonal BaTiO3 (as verified via XRD).
- •
Purity: ≥ 99%
- •
Particle size: ~ 100 nm (BET surface area or TEM analysis)
- •
Specific surface area: for example, 15–20 m2/g
- •
Crystal structure: perovskite-type, tetragonal phase
- •
Appearance: white to off-white powder
The nanopowder was used as received without any further treatment or modification. Its particle size and phase composition were confirmed by independent XRD analysis, ensuring suitability for enhancing the photocatalytic and mechanical properties of the cementitious composites.
Tetragonal crystal structure is responsible for ferroelectric property. Band bending characteristics of ferroelectric materials help to diminish and again combine the charge carriers; thus, photocatalytic performance by BaTiO3 is enhanced. Figure 4 showed the optimized geometries of the composite with possible isomers of BaTiO3 clusters.
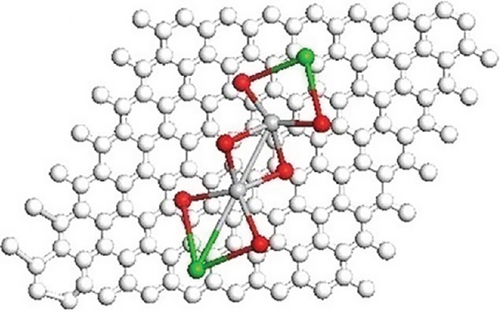
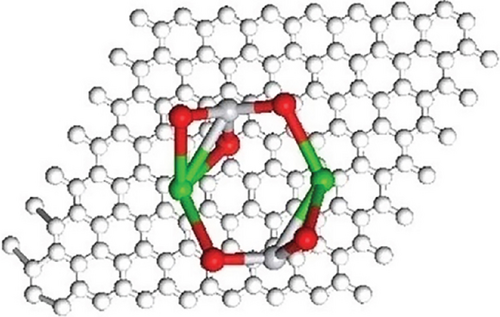
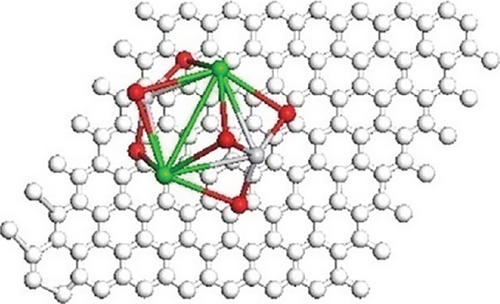
The optimized geometries of the composite and BaTiO3 isomers are shown, with white, gray, red, and green spheres representing C, Ti, O, and Ba, respectively. Color interpretation is available in the web version of the article.
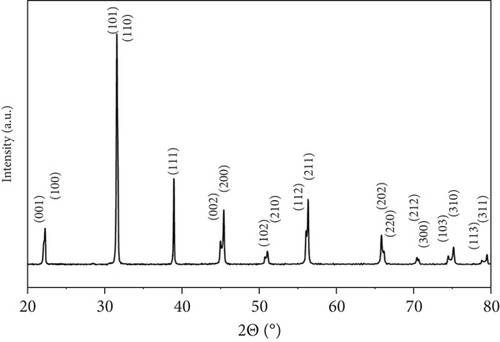
The XRD analysis reveals that the synthesized BaTiO3 crystallizes in a tetragonal phase, evidenced by the clear peak splitting around 2θ ≈ 45° attributed to the (002) and (200) reflections. This splitting is a hallmark of tetragonal distortion and matches the reference pattern from JCPDS Card No. 01-075-0583. The calculated lattice parameters— and —further support the tetragonal symmetry, with the slight elongation along the c-axis confirming the structural distortion.
The diffraction pattern shows sharp peaks at 22.29° (100), 31.53° (110), 38.92° (111), 45.06°/45.31° (002/200), 50.87° (102), 56.34° (211), 65.93° (220), 70.48° (212), 75.03° (310), and 79.44° (311), all indexed to the tetragonal BaTiO3 phase. The absence of impurity peaks and the well-resolved reflections confirm the high phase purity and excellent crystallinity of the material, making it suitable for advanced applications (Figure 5).
2.7. RhB
Rhodamine dye is an excellent dye to determine the depolluting properties of photocatalyst cementitious composites to degradation of organic contaminants on composite surfaces. It is used as a dye and is extensively used in chemical industries. Its applications are such as printing as well as dyeing in textile and paper industries, paints, leathers, and so forth. However, the organic dyes will be an original threat as environmental as well as biological troubles and still capable of bringing irritation or nuisance to the skin and eyes. In this research, it acts as a pollutant or contaminant for the composite surface. The physiochemical properties of the RhB dye are shown in Table 6.
| Sr. no. | Property name | Description |
|---|---|---|
| 1 | Appearance |
|
| 2 | Solubility | • Soluble in water |
3. Specimen Fabrication
- •
For the investigation of depolluting properties of the catalyst in the laboratory, the specimens of mortar were poured into wooden molds (50 × 30 × 10 mm) to obtain cement board samples. Various dosages of the BaTiO3 nanopowder photocatalyst (0.5%, 1%, and 2%,) were added to the cement-based mortar separately, which is cast from OPC and white cement (WC) mortars.
- •
White paint was used for the field investigation of depolluting pollution. A square of 2 × 2 was painted on the wall having 30 mL of paint and 0.2 g of catalyst. The pollutant was introduced manually by paint brush.
- •
For investigating the engineering properties of mortar and concrete, the specimens were made as per the Indian standard.
4. Concrete Mix Design
The mix design of M25 grade concrete was carried out in reference to IS 10262-2009, IS 383-1970, and IS 456-2000. The fresh and hardened properties of mortar and concrete (M25) with OPC containing varying concentrations of BaTiO3 (0.5%, 1%, and 2%) as well as WC containing varying concentrations of BaTiO3 (0.5%, 1%, and 2%) were determined. A detailed study of the mix design has been prepared, and the mix proportions are shown in Table 7.
| Material properties | Shape | Dimensions of specimen (mm) | Specimen no. | Test period | |
|---|---|---|---|---|---|
| Discoloration Test | Concrete | Rectangular | 50 × 30 × 10 | 12(OPC) + 12(WC) | 1–4 days |
| Mortar | Rectangular | 50 × 30 × 10 | 12(OPC) + 12(WC) | 1–4 days | |
| Compressive strength | Concrete | Cube | 150 × 150 × 150 | 27(OPC) + 27WC) | 7, 14, and 28 days |
| Mortar | Cube | 70.5 × 70.5 × 70.5 | 27(OPC) + 27(WC) | 7, 14, and 28 days | |
| Flexural strength | Concrete | Cube | 150 × 150 × 150 | 27(OPC) + 27(WC) | 7, 14, and 28 days |
| Mortar | Rectangular | 40 × 40 × 160 | 27(OPC) + 27(WC) | 7, 14, and 28 days | |
4.1. Details of the Specimens
To investigate the impact of engineering properties of mortar and concrete replacing with cement in the current study, cube specimens were cast. A total of 264 specimens were fabricated for various tests in this study. This included 24 specimens for the discoloration test, with 12 specimens each of concrete and mortar made from OPC and WC. For the compressive strength test, 54 specimens were prepared, with 27 specimens each of OPC and WC concrete cubes (150 × 150 × 150 mm) and mortar cubes (70.5 × 70.5 × 70.5 mm). Similarly, for the flexural strength test, 54 specimens were fabricated, including OPC and WC concrete cubes (150 × 150 × 150 mm) and mortar prisms (40 × 40 × 160 mm). The specimens were tested at various stages, such as 7, 14, and 28 days, to assess their performance under different conditions.
4.2. Casting of Concrete Specimens
- 1.
Weight batching: The ingredients of concrete, such as cement, aggregates, and water, are measured by weight and are mixed in a predetermined ratio.
- 2.
Material mixing: The weighed ingredients are mixed thoroughly using a rotating type drum mixer to ensure the uniform distribution of all the components.
- 3.
Demolding: The mixed concrete is poured into molds of desired shape and size and allowed to set and harden. After the required time, the molds are opened, and the hardened specimens are removed.
- 4.
Curing: The demolded specimens are then subjected to a curing process that provides the required moisture and temperature conditions for the proper hydration of cement and the development of strength. Curing can be done by various methods like water curing, steam curing, or curing compounds.
- 5.
Testing: To evaluate the characteristics of cement composites (concrete and mortars) having different concentrations of BaTiO3, a battery of tests was conducted as discussed below.
5. Test
5.1. Fresh Property Test for Mortar
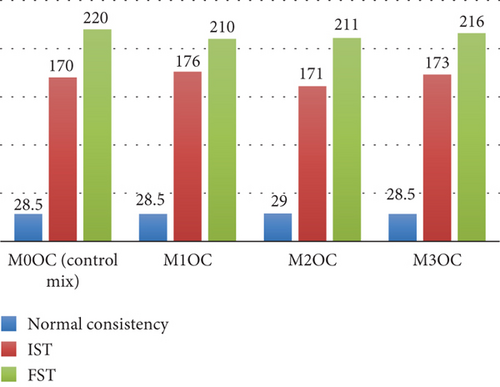
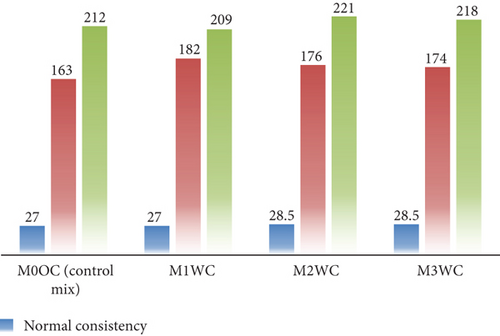
In this study, the effects of adding (0.5%, 1%, and 2%,) BaTiO3 to OPC and WC are examined with respect to their fresh properties, including the workability of mortar through the use of normal consistency tests along with the determination of IST and FST. The results and graphical representations of these tests are provided in Figures 6 and 7, respectively. According to the experimental investigation, the workability of mortar remains the same and enhances on the addition of a photocatalyst in OPC as well as in WC. Figures 6 and 7 represent the test results of normal consistency, IST and FST of OPC mortar mix and WC mortar mix. On the addition of a photocatalyst, the IST increases from 170 to 176 min in the case of OPC and from 163 to 182 min in the case of WC; this was due to some water being absorbed by the particles of the photocatalyst, which interfered in the early hydration reaction. The particle size of WC was finer, which was the reason for the greater difference in IST of cement with different dosages of the photocatalyst. The mix also shows some variation in FST. The difference in the readings of IST and FST can be neglected because it did not affect the engineering properties of the mortar mix from OPC and WC. In the case of normal consistency, the water demand slightly increases on the addition of the photocatalyst because the photocatalyst is an ultra-fine powder, resulting in higher water demand.
5.2. Fresh Property Test for Concrete
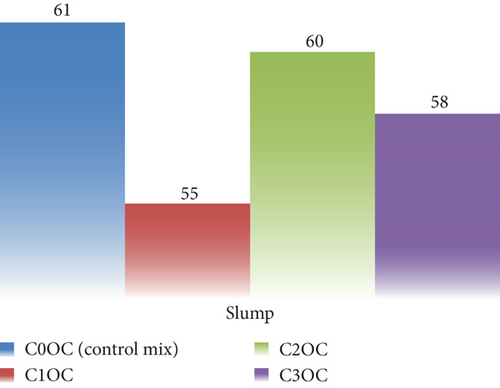
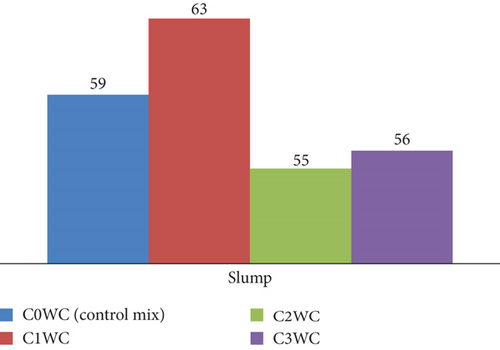
The workability of fresh concrete was evaluated using the empirical concrete slump test. Figures 8 and 9 illustrate the corresponding slump of different concrete mixtures graphically represented. The slump value indicates the workability of concrete. On addition of photocatalyst in OPC and WC concrete, the workability of concrete decreases in a very small amount. In OPC cement concrete, the slump value is 61 mm, while the mix having the photocatalyst in different dosages was 55, 60, and 58, and the same will happen in WC concrete. Initially, the slump reading was 59, and after mixing of photocatalyst, the readings were 63, 55, and 56. The results show in both cases that the workability of concrete mixes was not affected on addition of photocatalyst.
5.3. Hardened Property Test for Mortar and Concrete
Examining the hardened qualities of concrete and mortar is one of the most crucial methods to determine how well they work and whether or not they should be used in construction. These characteristics, which are crucial for determining the materials’ durability and structural integrity, include flexural strength, split tensile strength, and compressive strength.
5.3.1. Hardened Property Test for Mortar
The graphical representations of compressive strength test results are shown in Figures 10 and 11, respectively. The graph in Figure 10 compares the compressive strength of four mortars mixes M00C (control), M10C, M20C, and M30C prepared by using OPC; the compressive test was performed at 7, 14, and 28 days of curing. All mixes having the photocatalyst dosages show the improved compressive strength of mortar over the control mix.
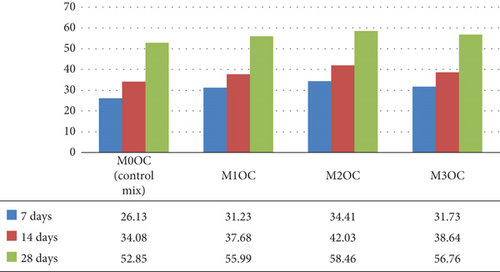
The compressive strength of mortar increased by the addition of photocatalyst, especially M10C and M20C, which gained the compressive strength significantly. Early and long-term compressive strength is shown in Figure 10.
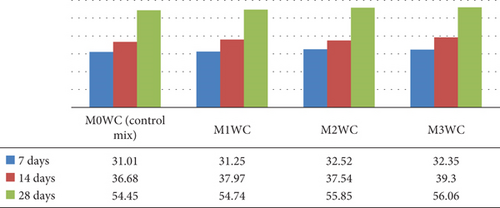
The graph in Figure 11 compares the compressive strength of four mortars mixes M00WC (control), M1WC, M2WC, and M3WC prepared by using the WC gained the compressive strength significantly early and long-term compressive strength shown in Figure 11.
The graphical representations of flexural strength test results are shown in Figures 11 and 12. The results of the split tensile strength testing shown in Figures 13 and 14 provide a graphical description of these tests. The compressive strength of mortar was increased on addition of photocatalyst in both cases, either in OPC or WC. The tensile strength of mortar also increased a little bit.
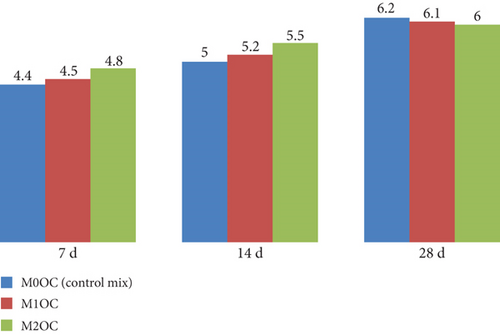
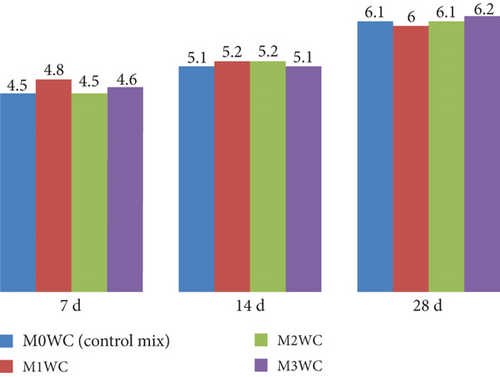
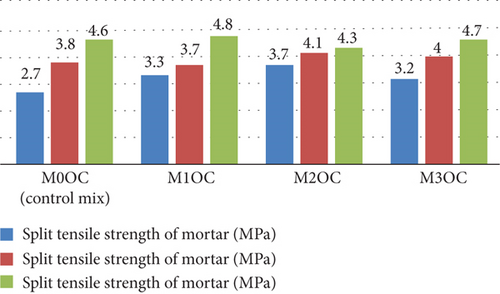
Figure 12 shows the graphical representation of flexure strength of specimens cast with OPC at 7, 14, and 28 days of curing. The flexural strength showed the ability to resist bending. The results show a significant increment in the flexural strength with the addition of photocatalyst in the mix.
Figure 13 shows the graphical representation of flexure strength of specimen cast with white at 7, 14, and 28 days of curing. At 7 days, M1WC showed the highest strength of 4.8 MPa, while M0WC and M2WC had 4.5 MPa. At 14 days, all mixes ranged closely around 5.1–5.2 MPa. By 28 days, M3WC exhibited the highest strength of 6.2 MPa, slightly above the control mix of 6.1 MPa. All mixes showed strength gain with curing age.
Figure 14 shows the graphical representation of split tensile strength at 7, 14, and 28 days for various OPC mortar mixes (M0OC, M1OC, M2OC, and M3OC). The result indicate that the increment of split tensile strength at 7 days of curing, but at 28 days of curing, all mixes had no any significant increment in the spilt tensile strength.
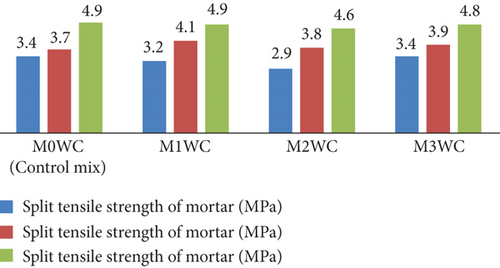
Figure 15 shows the graphical representation of split tensile strength at 7, 14, and 28 days for various WC mortar mixes (M0WC, M1WC, M2WC, and M3WC). The results indicate that the decrease in the split tensile strength at 7 days of curing indicates no significant increment in the split tensile strength at 28 days of curing.
5.3.2. Hardened Property Test for Concrete
The compressive strength test results in graphical representations of these tests are provided in Figure 16. The results of split tensile strength of concrete testing are shown in Figure 17. Figure 18 graphically represents the flexural strength testing result. The graphical representation showed that on addition of photocatalyst the compressive strength increases with the increase in the concentration of photocatalyst. The same result was observed in the case of flexural strength.
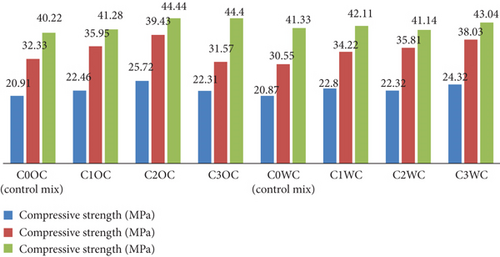
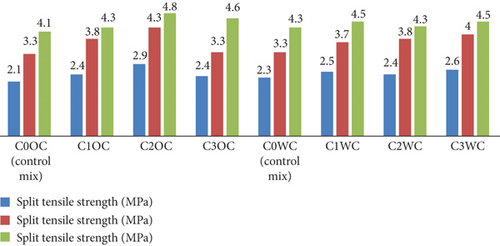
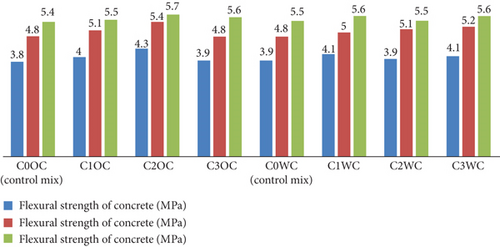
Figure 16 shows the graphical representation of the result of compressive strength of concrete prepared by OPC and WC, respectively. The test result shows an increment in compressive strength. The compressive strength of C2OC and C3OC curing after 28 days is 4.44 MPa; this indicates that with the increment of photocatalyst, the compressive strength increases. The concrete prepared with the WC has shown no significant increment in compressive strength.
The graph shows the split tensile strength of different concrete mixes (C0OC to C3OC and C0WC to C3WC) at 7, 14, and 28 days. Strength increases with curing time for all mixes. Among OPC mixes, C2OC achieved the highest 28-day strength of 4.8 MPa, while C0OC (control) had the lowest at 3.3 MPa. Similarly, in WC mixes, C3WC showed the highest 28-day strength (4.5 MPa), and C0WC the lowest (4.3 MPa). Modified mixes consistently performed better than control mixes, indicating that the addition of alternative materials enhances split tensile strength with time in both OPC and WC concretes.
The graph in Figure 18 displays the flexural strength of various concrete mixes (C0OC to C3OC and C0WC to C3WC) at 7, 14, and 28 days. Strength consistently increases with curing time across all mixes. Among OPC mixes, C2OC shows the highest 28-day flexural strength of 5.7 MPa, while the control mix C0OC has the lowest 7-day strength at 3.8 MPa. For WC mixes, C3WC achieves the highest 28-day strength of 5.6 MPa. All modified mixes (C1–C3) exhibit better strength performance than control mixes, indicating the beneficial effect of added materials on flexural strength development over time in both cement types.
6. Discussion of Fresh and Hardened Property Test Results
6.1. Fresh Property Analysis
The fresh property tests revealed critical insights into workability and setting behavior. For mortar mixes (Figures 5 and 6), the normal consistency ranged narrowly between 27% and 29%, indicating BaTiO3 incorporation up to 2% had minimal impact on water demand. However, the IST showed a 12–15-min delay in OPC mixes (170–176 min vs. control 220 min), likely due to BaTiO3’s high surface area temporarily adsorbing mixing water. WC mixes exhibited more consistent setting times (209–221 min), attributed to its finer particle size distribution. Concrete slump tests (Figures 7 and 8) demonstrated maintained workability (55–63 mm) across all mixes, confirming BaTiO3’s compatibility with standard construction practices.
6.2. Hardened Mortar Properties
Compressive strength development (Figures 9 and 10) showed clear dosage dependence, with 2% BaTiO3 achieving 44.44 MPa in OPC (8.4% increase vs. control) and 43.04 MPa in WC at 28 days. The flexural strength results (Figures 11 and 12) revealed even greater enhancement (10.3% improvement for 2% dosage), suggesting BaTiO3 improves interfacial transition zone properties. Split tensile strength (Figures 13 and 14) followed similar trends, with optimal performance at 2% loading, indicating balanced pore-filling and nucleation effects without excessive agglomeration.
6.3. Hardened Concrete Properties
The compressive strength results (Figure 15) mirrored mortar trends but with lower absolute values (40.22–44.4 MPa), expected due to aggregate inclusion. Notably, the 7-day strength gain was more pronounced in BaTiO3 mixes (20.91–25.72 MPa vs. control 20.87 MPa), suggesting accelerated early hydration. Split tensile strength (Figure 16) showed exceptional improvement in WC mixes (4.9 MPa vs. control 4.1 MPa), likely due to better BaTiO3 dispersion in the whiter matrix. Flexural strength (Figure 17) exhibited comparable enhancement patterns, confirming BaTiO3’s effectiveness across multiple mechanical property categories.
6.4. Depolluting Test
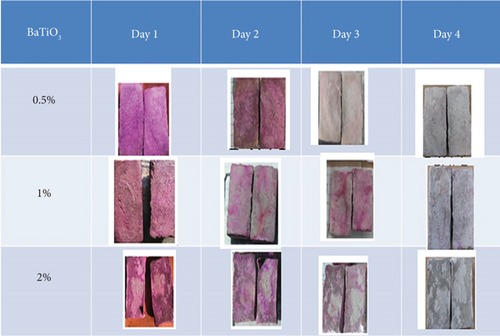
The depolluting test, a core component of this study, evaluated the photocatalytic efficiency of cement composites modified with varying concentrations of BaTiO3 (0.5%, 1%, and 2%).The depollution test evaluates the ability of concrete and mortar specimens to degrade and resist the accumulation of surface pollutants under controlled conditions. RhB dye was used as a model organic contaminant, and discoloration was observed under ultraviolet exposure across a 4-day period.
Concrete specimens are prepared using a mix comprising 12 parts OPC and 12 parts WC. The specimens are rectangular in shape, measuring 50 × 30 × 10 mm. They are exposed to the testing procedure for a duration ranging from 1 to 4 days.
The test is designed to evaluate how well the specimens resist pollution from factors such as sunlight, stains, or chemical exposure. In this depolluting test, composite samples were dipped in a RhB solution (0.005 g/L) for 2 min. The solution was then applied to the surface of each specimen, which was exposed to UV light (LUMILUX T8, 18 W) from a distance of 10 cm for 4 days. Observations were recorded every 3 h. Figures 19 and 20 present the results for OPC and WC composites with different BaTiO3 contents (0.5%, 1%, and 2%), highlighting their self-cleaning behavior under UV exposure. After a 4-day period of visual observation of OPC and WC composites, it was found that WC composites demonstrated superior depolluting ability compared to OPC composites, particularly at a BaTiO3 concentration of 2%. WC composites showed better self-cleaning properties than OPC composites.
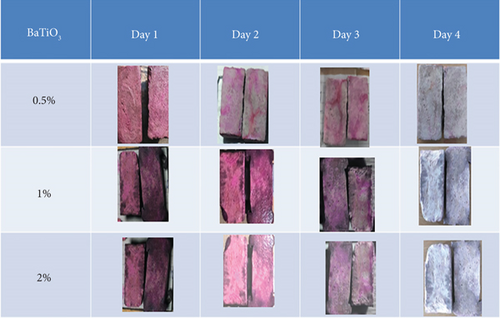
Visual analysis was used to quantify depollution in specimens due to its ease of use, affordability, and rapid evaluation. Future research could use more reliable methods like colorimetry, spectroscopy, and digital image processing.
6.4.1. Field Test
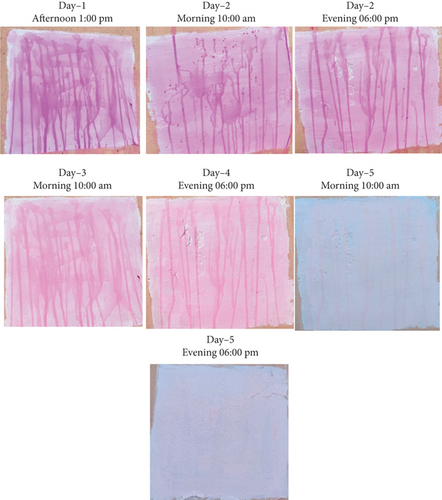
Figure 21 represented the field test, in which the pollutant removal agent was mixed in white paint and the observations were recorded. It was found that white paint demonstrated superior depolluting ability.
7. Observation
- •
In concrete mixtures with OPC (C0OC) and WC (C0WC) containing BaTiO3, the sluggish initial hydration caused by BaTiO3 delays the development of hydration products, which accounts for the slight variations in slump values. Despite the presence of BaTiO3, this results in comparable workability and slump values (61 mm for C0OC and 59 mm for C0WC). The filler effect of BaTiO3 does not significantly affect the mixtures’ flowability, although it does marginally raise viscosity. As a result, the slump values of the OPC and WC combinations are nearly equal.
- •
Workability was not significantly affected by the slump values, which ranged from 55 to 63 mm for the mixtures with BaTiO3 replacement (C1OC, C2OC, C3OC, C1WC, C2WC, and C3WC). The reason for this is that BaTiO3 slows down the initial hydration, which delays stiffening temporarily without harming flowability overall. Furthermore, the mixes’ water content stays constant, and the filler effect to of BaTiO3 marginally raises viscosity without significantly decreasing workability, leading little fluctuation in slump values.
- •
Measurement of the IST and FST and determination of the normal consistency mortar mixtures (M0OC, M1OC, M2OC, and M3OC) typically had consistency values between 28.5% and 29.0%, with minimal fluctuation.
- •
In the case of WC mortar combinations, the low variance in normal consistency, which ranges from 27.0% to 28.5%, may be attributed to the modest reactivity of BaTiO3, which does not considerably affect the water consumption. The modest variations in setting times (IST: 161–176 min for OPC and 163–182 min for WC) can be related to the interaction of BaTiO3 with hydration products. This interaction results in the creation of a transient barrier that slows down the synthesis of calcium silicate hydrate (C-S-H). There are some tiny delays as a consequence of this, but the total impact is still insignificant and falls within acceptable bounds.
- •
The small variance in FST (210–220 min for OPC and 209–221 min for WC) is due to BaTiO3’s interaction with cement hydration products. The development of calcium silicate hydrate (C-S-H) is delayed as a result of the establishment of a temporary barrier that slows down the hydration reaction because of this. The FST values, on the other hand, remain within acceptable limits because this influence is rather minor.
- •
The improvement in compressive strength (7, 14, and 28 days) with BaTiO3 replacement occurs because its fine particles density the concrete matrix by filling microvoids and improving the link between the cement paste and aggregates. For OPC mixes, M2OC displayed the greatest compressive strength as the BaTiO3 replacement level maximized the balance between matrix densification and hydration retardation.
- •
M3WC attained the maximum compressive strength due to white cement’s compatibility with greater BaTiO3 replacement levels. The tiny BaTiO3 particles boosted matrix densification by filling microvoids, whereas white cement’s finer particle size and quicker hydration supported lower porosity and better particle packing, resulting in greater strength.
- •
Since it may densify the matrix, improve bonding with hydration products, and prevent crack propagation, substituting BaTiO3 greatly increases the flexural strength of both OPC and WC mixtures. A stronger cementitious matrix and improved stress distribution are the outcomes of these effects. The differences in peak performance can be explained by the time-dependent integration of BaTiO3 with hydration products; M2OC reaches the maximal flexural strength after 14 days, whereas M3WC does so at 28 days. The lack of BaTiO3 resulted in lower strengths for control mixes (M0OC and M0WC), underscoring its critical role in improving mechanical properties. All things considered, BaTiO3 works well as an addition to enhance flexural performance in both OPC and WC systems.
- •
As a result of matrix densification, enhanced bonding with hydration products, and improved fracture resistance, OPC mixes with BaTiO3 replacement had increased flexural strength, especially for M2OC at 14 days. By filling up gaps, decreasing porosity, and fortifying the cement matrix, BaTiO3 improves the cement’s resistance to bending forces. Peak flexural strength was achieved at this stage with the ideal amount of BaTiO3 in M2OC, with the effects of BaTiO3 integration being most noticeable at 14 days.
- •
The results of the WC combinations’ flexural strength varied, with M3WC obtaining the greatest values after 28 days. In contrast to the control mixtures, M0OC (ordinary cement) and M0WC (white cement), which showed lower strengths, the addition of BaTiO3 to these mixes increased flexural strength. The densification and crack resistance offered by BaTiO3, which fortifies the matrix and aids in the better distribution of stresses under bending, are responsible for this improvement. The highest flexural strength was found in M3WC when the integration of BaTiO3 with the hydration products in WC mixtures that peaked at 28 days.
- •
It was evident from visual observation (Figures 18 and 19) that the more BaTiO3 there was, the more intense the discoloration. RhB fading was greatest in specimens containing 2% BaTiO3, suggesting greater photocatalytic degradation. At the same BaTiO3 dose, WC composites outperformed their OPC counterparts in terms of dye degradation among the tested matrices.
- •
Furthermore, the field test (Figure 21) verified that self-cleaning behavior was visible even in the presence of ambient sunlight. The viability of real-world applications is supported by the dye stains’ 5-day gradual fading. These observations show that BaTiO3 has positive effects on the fresh and hardened properties of cement and concrete, suggesting that this compound may improve the performance and sustainability of building materials
- •
The lighter shade and smaller particle size of WC enhance light reflectance and BaTiO3 particle dispersion, leading to increased photoactivity due to synergistic interactions between the catalyst and WC. The self-cleaning behavior was confirmed in a field test under natural sunlight.
8. Conclusion
- •
This study focused on BaTiO3 produced by hydrothermal methods in order to assess the advantages of adopting advanced oxidation materials for the depollution of structural surfaces. These substances show promising photocatalytic qualities for breaking down environmental contaminants because of their great purity and reactivity. Improved depolluting capability without sacrificing mechanical integrity was achieved by adding BaTiO3 to cementitious composites, such as paint, mortar, and concrete.
- •
Laboratory and field studies confirmed that the specimens incorporating 2% BaTiO3 yielded the most effective results in pollutant removal, showing superior photocatalytic activity and self-cleaning behavior. This concentration not only enhanced surface cleanliness but also improved compressive and flexural strength, matrix densification, and durability. WC composites, in particular, demonstrated enhanced compatibility with the photocatalyst, achieving better results than OPC-based counterparts.
- •
The use of BaTiO3 supports sustainability in the built environment by reducing maintenance needs, preserving aesthetics, and mitigating air pollution. The findings highlight the compound’s dual benefit—functional environmental remediation and mechanical performance enhancement—making it a viable additive for developing next-generation building materials.
8.1. Future Direction
- 1.
Long-term durability
- 2.
Hybrid photocatalyst
- 3.
Economic feasibility and scalability
- 4.
Environmental impact assessment
To authenticate the environmental sustainability of BaTiO3 production as well as its long-term effects when utilized in infrastructure, life cycle analysis should be performed.
By addressing these challenges, future research can help transition BaTiO3 from laboratory success to mainstream construction innovation, contributing to greener, smarter, and more sustainable urban infrastructure.
Future research can advance BaTiO3 into mainstream construction by overcoming challenges and promoting greener, smarter, and sustainable urban infrastructure.
Conflicts of Interest
The authors declare no conflicts of interest.
Author Contributions
All co-authors have seen and agree with the content of the manuscript.
Funding
No funding was received for this manuscript.
Open Research
Data Availability Statement
The data that support the findings of this study are available from the corresponding author upon reasonable request.


