An Investigation of Solar Radiation, Dew Point, Relative Humidity, and Air Temperature in the Afar Region of Ethiopia
Abstract
The study is aimed at analyzing monthly variations in air temperature, relative humidity (RH), solar radiation, and dew point temperature for the cities of Asayita, Dubti, and Samara between 2013 and 2017 by Using from the weather data from Meteorological Agency Ethiopia. The monthly average global solar radiation on the horizontal surfaces of the Afar region was calculated using the temperature, sunshine, and humidity models. The temperature model indicates that the places’ projected solar radiation is more than 5.24 kWh/m2/day, and the sunshine model indicates that it is more than 4.1 kWh/m2/day. Based on the research findings, the cities of Asayita, Dubti, and Samara in the Afar region of Ethiopia have evaluated global sun radiation that is advantageous for solar energy application. Furthermore, a direct association between the dew point temperature and RH at the study sites was additionally determined.
1. Introduction
Solar energy is a renewable energy source that is rapidly displacing other traditional energy sources since it has no limitations on how much energy it can use for both residential and commercial uses, without much impact on the environment [1]. This has led to increased research in the assessment and harnessing of available solar energy in any given location. Climate change has a significant impact on people’s lives and the environment [2, 3]. Solar radiation is an important metric for assessing the effects of climate change, pollution, the food industry, agriculture, and hydrology [3]. Even when building a solar energy the conversion system, it is necessary to have sufficient knowledge about the availability of solar radiation at the desired location [4–6]. For researchers to better understand and estimate the potential of solar radiation at particular locations of interest, an abundant amount of knowledge and data has been gathered over the years as climate monitoring and prediction have continued to improve.
The physical and biological processes required for life to exist depend heavily on solar radiation that reaches the Earth’s surface [7, 8]. Climate data, the hydrologic cycle, sensible heat, latent heat, evaporation, ecological life, dew point temperature, atmospheric temperature, sunshin hour length, relative humidity, and many other crucial parameters are all directly affected by changes in solar radiation [9]. Due to all of these factors, solar energy systems are expected to be crucial in reducing carbon emissions and creating new jobs in the coming years, especially within developing countries including Ethiopia [10]. It is also necessary to have a precise understanding of the availability of solar radiation at any location of world [11–14]. In order to understand climate changes, a number of weather-related variables, including relative humidity, clouds, atmospheric pressure, and physical temperature, have also been extensively studied [9]. Additionally, a thorough understanding of the amount of solar radiation available wherever in the earth is required [11–14]. Therefore, while designing and evaluating solar energy systems, the total solar radiation potential will be essential [15–17]. The location and human infrastructure are thought to be more affected by extreme temperatures, and human perceptions of the location are influenced by environmental variability [18]. Two common methods of measuring the amount of moisture in the air are relative humidity and dew point temperature [19]. Relative humidity is a sensitive factor that influences the physical properties of agricultural foods, biological materials, electrical equipment, and metals, and it also determines how uncomfortable a person’s body temperature is for this group of people [20, 21]. When predicting human comfort [22, 23], the probability of thunderstorms [24], and the production of rain, frost, and fog, meteorologists support a dew point temperature above relative humidity. Solar radiation, outer surface temperature, and dew point temperature are all potential influences on relative humidity [25, 26]. The “dew point” is the temperature at which atmospheric water vapor condenses into liquid water at the same rate that it evaporates; partial vapor pressure and partial saturation vapor pressure are equal at this temperature. Numerous studies have been carried out worldwide to investigate recent changes in temperature and solar radiation; however, studies that concentrate on temperature and other variables at more regional scales are just as significant because large-scale studies may overlook significant regional and temporal variability in climate change [27]. Despite its usefulness as a source of meteorological data for environmental study, ground-based weather stations are still utilized to gather data from a variety of locations. When the dew point rises beyond 60°C, strong thunderstorms are more likely to develop in lower atmospheres [28].
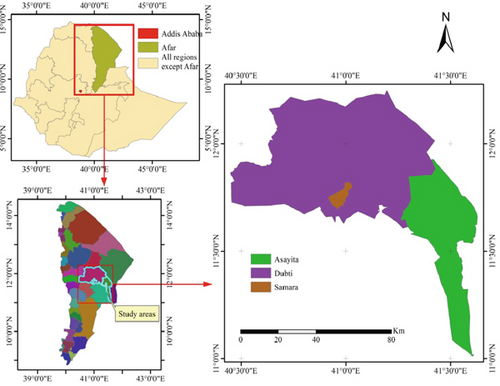
This study’s goal is to examine the monthly variations in meteorological variables like air temperature, relative humidity, solar radiation, and the dew point temperature in the northeastern Ethiopian region of Afar, specifically in the cities of Asayita, Dubti, and Samara, as shown in Figure 1.
To be able to determine the feasibility and efficacy of solar energy application projects in the Afar region as landmarks, it is imperative that you first assess solar radiation estimates.
- ✓
There is no published data, no estimated solar radiation report, and no estimation of solar energy potential for the locations of study.
- ✓
Using the sunshine model of Aysaita, Dubti City, and Samara City in the Afar area, the monthly average values of horizontal daily global solar radiation will be assessed.
- ✓
Performing a thorough investigation that offers insightful recommendations for engineers and designers alike, as well as for any potential the use of solar energy at these research areas.
- ✓
Present and forecasting the monthly average daily global solar radiation at these cities, as well as a general one for the Aysaita, Dubti City, and Samara city of Afar region.
2. Methodology
2.1. Study Area
The study area lies between latitudes 11.57°N and longitudes 41.43°E in northern Ethiopia. Specifically, Table 1 shows that Asayita is placed at 11.57° latitude, 41.43° longitude; Dubti is located at 11.73° latitude, 41.08° longitude; and Samara is located at 11.81° latitude, 41.03° longitude as shown in Figure 1. Their respective elevations are 432 m for Asayita, 381 m for Dubti, and 437 m for Samara [29, 30]. The weather monitoring station in the Afar region has a subtropical steppe climate because it is 404 m above sea level. The yearly temperature differential in Ethiopia is 19.16°C. There are roughly 108.64 wet days and 66.43 mm of precipitation in the Afar region annually. The locations of the weather cities are displayed in Figure 1 [31, 32].
| No. | Location | Latitude (ϕ) | Longitude | Altitude | Years |
|---|---|---|---|---|---|
| 1 | Asayita | 11.57 | 41.43 | 432 | 2013–2017 |
| 2 | Dubti | 11.73 | 41.08 | 381 | 2013–2017 |
| 3 | Samara | 11.81 | 41.03 | 437 | 2013–2017 |
2.2. Data Collection
The data sources and the geographic locations are shown in Table 1 and Figure 1. The Notational Meteorological Agency of Ethiopia (NMAE) in Addis Ababa recorded the maximum and minimum temperatures, relative humidity, and average sunlight hours. Data for the cities of Asayita, Dubity, and Samara in the Afar region were gathered from the National Meteorological Agency of Ethiopia (NMA) over a 5-year period, from 2013 to 2017.
2.3. Models
In this work, correlation based on measurements of sun hour duration was used to estimate the value of solar radiation at the study [33]. Because it proposed a linear relationship between the ratio of average daily sunshine duration to the maximum possible sunshine duration and the ratio of average daily horizontal radiation to the corresponding value on a completely clear day, the modified Angstrom equation is widely used in a variety of correlations [34, 35]. The location solar declination angle was determined using Equations (1)–(6); the maximum sunshine hour angle for each day was calculated using Equation (8); the average number of hours of sunlight per month was calculated using Equation (6); and the monthly average daily extraterrestrial radiation was obtained using Equation (4).
3. Results and Discussions
3.1. Sunshine Models
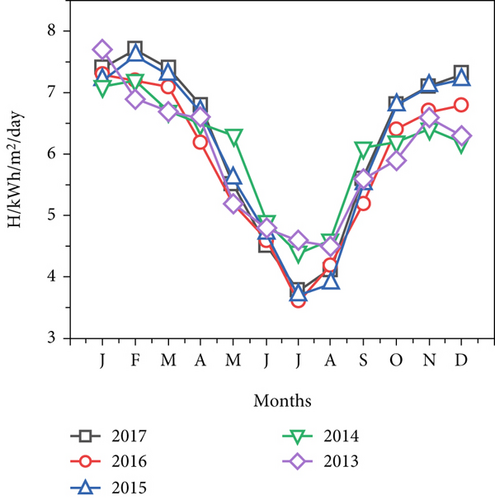
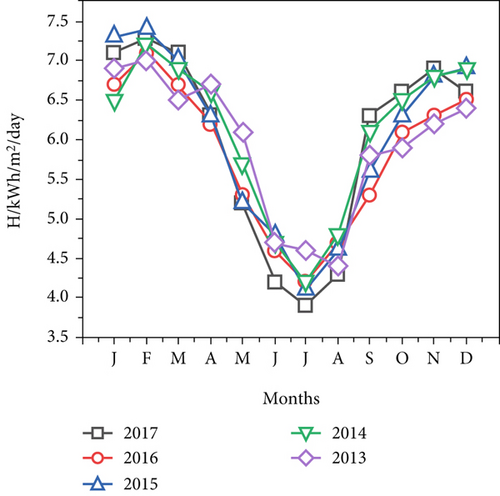
The monthly variation of predicted solar radiation of Asayita City on horizontal surface by sunshine model Equation (1) is presented in Table 2. In 2017, 2016, 2015, 2014, and 2013, significant quantities of solar radiation were estimated from January to April, with monthly solar radiation amounts ranging from 4.1 to 7.7 kWh/m2/day, 4.2 to 7.3 kWh/m2/day, 3.9 to 7.6 kWh/m2/day, 4.4 to 7.2 kWh/m2/day, and 4.5 to 7.1 kWh/m2/day. Figure 2a shows the estimated monthly radiation on the horizontal surface at Asayita City; the maximum monthly average daily sun radiation in Asayita City occurred from December to March, and the trend has remained consistent throughout the year, descending from January to June and rising from July to December. This indicates that solar radiation estimates are lower throughout the summer season, from June to August. In addition, Table 2 presents the estimated monthly solar radiation in Dubti City, which increased from 4.2 to 7.1kWh/m2/day in 2016, then from 4.1 to 7.4 kWh/m2/day in 2015, from 4.2 to 7.2 kWh/m2/day in 2014, and from 4.4k to7.0 kWh/m2/day in 2013. Figure 2b shows the estimated monthly radiation of Dubti City from 2013 to 2017. There has been a steady trend of change throughout time, with drops from January to July and increases from July to November. From December through March, Dubti experiences the most average daily exposure to sunlight. January, February, November, and December usually receive the most solar radiation, while June and July usually receive the least. According to the data, Dubti City’s average monthly global solar radiation on a horizontal surface increased from 3.8 kWh/m2/day in July to 7.4 kWh/m2/day in February between 2013 and 2017.
| Y | J | F | M | A | M | J | J | A | S | O | N | D |
|---|---|---|---|---|---|---|---|---|---|---|---|---|
| (a) Asayita | ||||||||||||
| 2017 | 7.4 | 7.7 | 7.4 | 6.8 | 5.5 | 4.5 | 3.8 | 4.1 | 5.6 | 6.8 | 7.1 | 7.3 |
| 2016 | 7.3 | 7.2 | 7.1 | 6.2 | 5.2 | 4.6 | 3.6 | 4.2 | 5.2 | 6.4 | 6.7 | 6.8 |
| 2015 | 7.2 | 7.6 | 7.3 | 6.7 | 5.6 | 4.7 | 3.7 | 3.9 | 5.5 | 6.8 | 7.1 | 7.2 |
| 2014 | 7.1 | 7.2 | 6.7 | 6.5 | 6.3 | 4.9 | 4.4 | 4.6 | 6.1 | 6.2 | 6.4 | 6.2 |
| 2013 | 7.7 | 6.9 | 6.7 | 6.6 | 5.2 | 4.8 | 4.6 | 4.5 | 5.6 | 5.9 | 6.6 | 6.3 |
| Ave | 7.3 | 7.4 | 7.1 | 6.6 | 5.6 | 4.7 | 4.1 | 4.3 | 5.6 | 6.4 | 6.8 | 6.7 |
| (b) Dubti | ||||||||||||
| 2017 | 7.1 | 7.3 | 7.1 | 6.3 | 5.2 | 4.2 | 3.9 | 4.3 | 6.3 | 6.6 | 6.9 | 6.6 |
| 2016 | 6.7 | 7.1 | 6.7 | 6.2 | 5.3 | 4.6 | 4.2 | 4.7 | 5.3 | 6.1 | 6.3 | 6.5 |
| 2015 | 7.3 | 7.4 | 7.0 | 6.3 | 5.2 | 4.8 | 4.1 | 4.6 | 5.6 | 6.3 | 6.8 | 6.9 |
| 2014 | 6.5 | 7.2 | 6.9 | 6.6 | 5.7 | 4.7 | 4.2 | 4.8 | 6.1 | 6.5 | 6.8 | 6.9 |
| 2013 | 6.9 | 7.0 | 6.5 | 6.7 | 6.1 | 4.7 | 4.6 | 4.4 | 5.8 | 5.9 | 6.2 | 6.4 |
| Ave | 6.9 | 7.2 | 6.8 | 6.4 | 5.5 | 4.6 | 4.2 | 4.6 | 5.8 | 6.3 | 6.6 | 6.7 |
| (c) Samara | ||||||||||||
| 2017 | 7.8 | 7.5 | 7.2 | 6.8 | 5.8 | 4.9 | 4.5 | 4.8 | 5.7 | 6.9 | 6.7 | 7.5 |
| 2016 | 6.6 | 7.2 | 6.9 | 6.3 | 5.4 | 4.3 | 3.8 | 4.6 | 5.5 | 6.6 | 6.5 | 6.7 |
| 2015 | 6.9 | 7.4 | 7.2 | 6.9 | 5.9 | 4.7 | 4.3 | 4.2 | 5.8 | 6.8 | 6.7 | 7.1 |
| 2014 | 6.8 | 6.7 | 6.5 | 6.8 | 5.8 | 5.1 | 4.6 | 5.4 | 6.1 | 6.9 | 6.4 | 7.3 |
| 2013 | 6.2 | 7.3 | 6.7 | 6.4 | 5.4 | 4.1 | 4.2 | 4.4 | 5.8 | 6.2 | 6.3 | 6.5 |
| Ave | 6.8 | 7.2 | 6.9 | 6.6 | 5.7 | 4.6 | 4.3 | 4.7 | 5.7 | 6.7 | 6.5 | 7.1 |
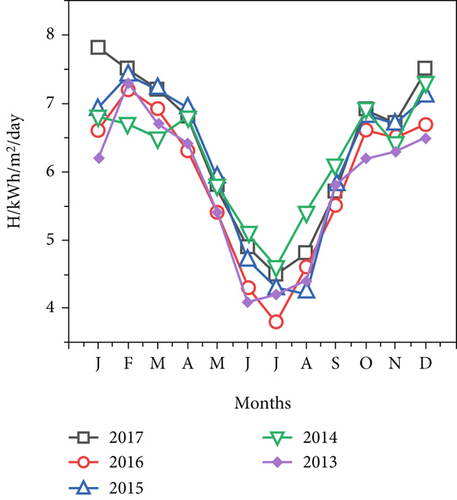
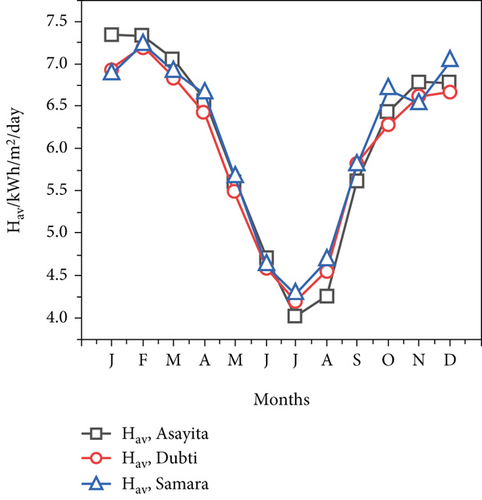
According to the sunshine model Equation (1), the monthly average variation in solar radiation in Samara City in 2017, 2016, 2015, 2014, and 2013 was between 4.5 and 7.8 kWh/m2/day, 3.8 and 7.2 kWh/m2/day, 4.2 and 7.4 kWh/m2/day, 4.6 and 7.3 kWh/m2/day, and 4.1 and 7.3 kWh/m2/day, respectively, as shown in Figure 2c. The pattern of variations revealed a decrease from January to July and an increase from July to December, but the largest quantities were consistently obtained in January through February and November. Over the years, the variation trend has shown declines from January to June and increases from July to December.
From July to December, the pattern varied, rising, and from January to June, it fell. Figure 2d displays the average monthly estimated radiation levels in Asayita, Dubti, and Samara, with Samara City receiving the most hours of sunshine on average from December to March. According to the results, the average monthly global solar radiation in the cities of Samara, Asayita, and Dubti varied from 4.3 kWh/m2/day in July to 7.2 kWh/m2/day in February, 4.1 kWh/m2/day in July to 7.4 kWh/m2/day in February, and 4.2 kWh/m2/day in July to 7.2 kWh/m2/day in February. In addition, the cities of Asayita, Dubti, and Samara received the least amount of energy in July (4.1, 4.2, and 4.3 kWh/m2/day, respectively), while Dubti, Samara, and Asayita received the highest amounts in February (7.4, 7.2, and 7.2 kWh/m2/day, respectively). As illustrated in Figure 2d, the estimated solar radiation in the three cities of Asayita, Dubti, and Samara increases from July to December and decreases from January to July. According to the World Meteorological Organization (WMO), the minimum solar radiation amount for solar energy to predict availability of accessible solar radiation within a specific location in the global world is 2.88 kWh/m2/day. This study concluded that the lowest estimated solar radiation in this study area, 4.1 kWh/m2/day, was 42.3% higher than the minimum value of 2.88 kWh/m2/day required for solar energy application. These findings confirm that the Afar region has significant potential to use solar radiation for energy applications throughout the year.
3.2. Temperature Model
The pattern of the estimated monthly average global solar radiation at any given location could be ascertained by estimating global solar radiation using temperature models. Hargreaves and Samani [40] are the first to suggest that Equation (9) should be used to estimate the various temperature models.
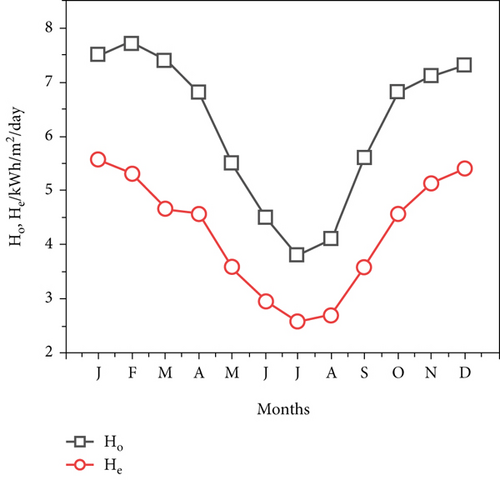
The monthly fluctuations in Aysaita City’s climate variables in 2017 are given in Figure 3a. These comprise of temperature change (TD), average temperature (Tav), and dew point temperature (see Table 3) [43]. Figure 3b shows the projected worldwide solar radiation (He) and is the monthly mean of daily extraterrestrial solar radiation Ho at the city of Aysaita. There is a similar trend of change from January to July (7.5 –3.8 kWh/m2/day) and from July to December (3.8–7.3 kWhm2/day).

| M | Tmax/ °C | Tmin/ °C | TD/ °C | Tav | HO | He | RH% | TDP |
|---|---|---|---|---|---|---|---|---|
| J | 33.7 | 14.1 | 19.6 | 23.9 | 7.5 | 5.56 | 78 | 19.5 |
| F | 37.5 | 20.6 | 16.9 | 29.1 | 7.7 | 5.31 | 69 | 22.9 |
| M | 35.1 | 21.3 | 13.8 | 28.2 | 7.4 | 4.67 | 80 | 24.2 |
| A | 37.9 | 22.3 | 15.6 | 30.1 | 6.8 | 4.56 | 71 | 24.3 |
| M | 40.4 | 25.5 | 14.9 | 32.9 | 5.5 | 3.59 | 73 | 27.6 |
| J | 41.7 | 26.5 | 15.2 | 34.1 | 4.5 | 2.97 | 74 | 26.7 |
| J | 44.6 | 28.4 | 16.2 | 36.5 | 3.8 | 2.58 | 63 | 29.1 |
| A | 41.1 | 25.9 | 15.2 | 33.5 | 4.1 | 2.71 | 65 | 26.5 |
| S | 40.2 | 25.8 | 14.4 | 33 | 5.6 | 3.58 | 77 | 28.4 |
| O | 39.1 | 23.3 | 15.8 | 31.2 | 6.8 | 4.56 | 70 | 25.2 |
| N | 35.8 | 17.5 | 18.3 | 26.6 | 7.1 | 5.12 | 76 | 21.9 |
| D | 32.9 | 13.6 | 19.3 | 23.3 | 7.3 | 5.41 | 72 | 17.7 |
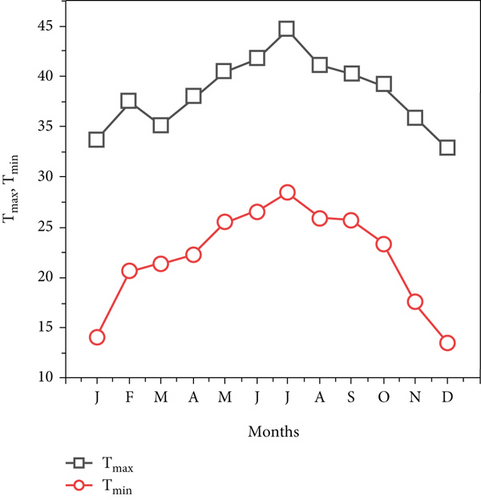
The city of Aysaita in the Afar region is plotted for Tmax, Tmin, and TD in Figure 3c. July had the highest monthly average temperature in 2017 at 44.2°C, while December had the lowest at 13.6°C.
Figure 4a shows the monthly Tmax, Tmin, and TD of Dubti City in 2017. Figure 4b displays the city of Dubti daily extraterrestrial solar radiation, Ho, and estimated global solar radiation. The fluctuation pattern increases from 2.7 to 5.4 kWh/m2/day from July to December and decreases from 7.1 to 3.8 kWh/m2/day from January to July.
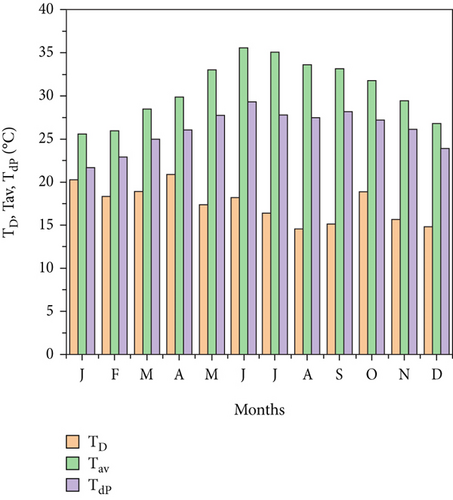
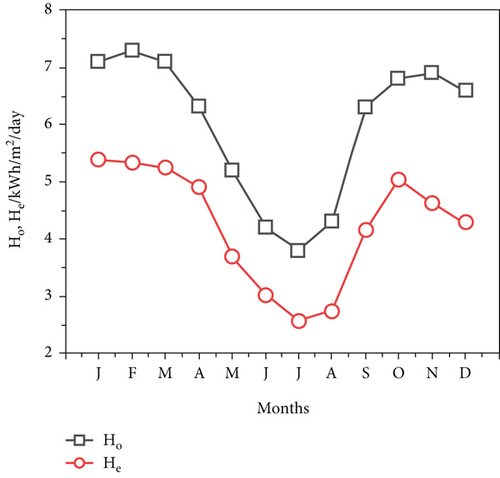

Figure 4c illustrates the Tmax and Tmin plots of Dubti in the Afar region. The lowest monthly average temperature was 15.4°C in July 2017, while the highest monthly average temperature was 43.2°C. Both the maximum and minimum temperatures showed a similar pattern of variations over the years. The ambient temperature rises from January to July and gradually decreases from July to December due to the study region’s dusty and aerosol-rich environment.
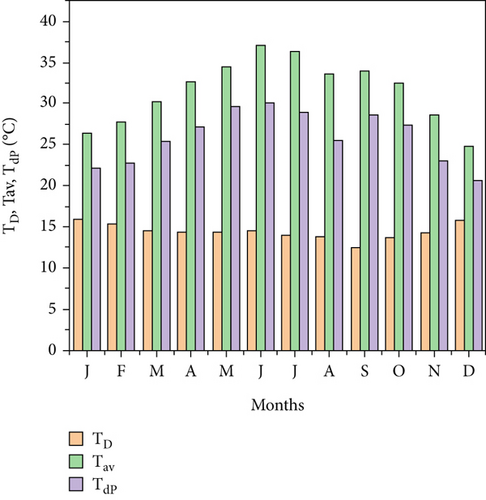
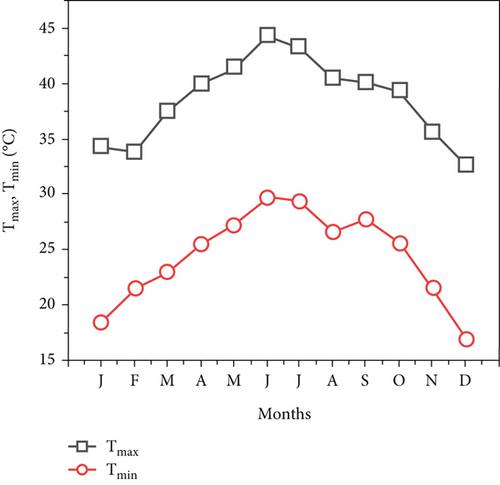
Figure 5a illustrates monthly changes in Samara City dew point temperature TdP, average temperature Tav, and temperature change TD for the year 2017 [21]. Figure 5b shows daily extraterrestrial solar radiation Samara City, He, and mean alien global solar radiation. The reduction was from 7.6 to 4.2 kWh/m2/day from January to July and from 4.2 to 7.1 kWh/m2/day between July and December. The estimated solar radiation decreases from 5.24 kWh/m2/day in February to 2.77 kWh/m2/day in July and then returns to 4.75 kWh/m2/day in December. Figure 5c shows a plot of Tmax and Tmin for Samara in the Afar region. In July, the highest monthly average temperature was 44.3°C, while the lowest monthly average temperature was 16.9°C in December of 2017.

However, the horizontal surface radiation fluctuation pattern increases from July to December and decreases from January to July. During the summer season from June to August, the research locations of Asayita, Dubti, and Samara were projected to have low levels of global sun radiation. The summer months in the Afar region are quite dusty, with thick clouds and aerosol particles that reduce the amount of solar energy that reaches the earth’s surface.
The existence of dusty clouds and water particle suspension, which cause incoming solar energy to be scattered, absorbed, and reflected to the earth’s surface, are the primary causes of the low assessments [44].
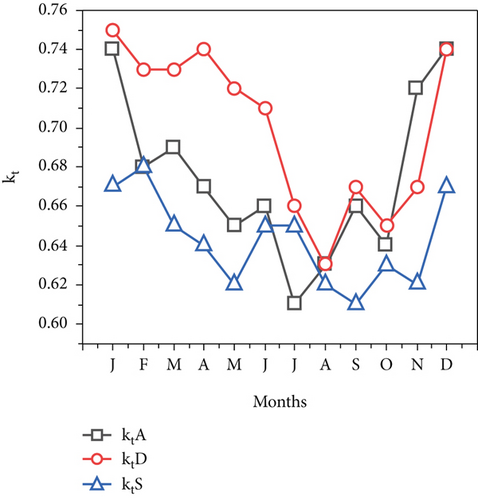
It measures the availability of the solar radiation or the transmissivity of the atmosphere. The degree of sky clarity and the amount of solar radiation extinction in the atmosphere, including the effects of radiation interaction with other atmospheric elements, are both measured by the clearness index (kt) [45–48].
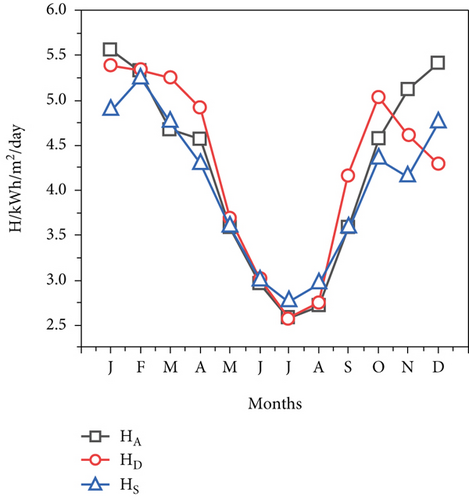
Tables 4, 5, and 6 illustrates the monthly average values of the clearness index, diffuse index, and measured global sunshine radiation. The clearness index (kt) and global solar radiation (H) have a similar pattern, as shown in Figure 6b. For three research sites, Figure 6b displays the monthly average of the clearness index (kt) pattern, which rises to its maximum values from July to December and falls from its highest values to its lowest from January to July. The clarity index increases in tandem with an increase in global sun radiation, and vice versa. The optimum times to harvest the highest values of H and kt are clearly the autumn, spring, and winter time of year. The sun irradiation and clearness index are at their lowest during the summer months of June to August in Dubti and Samara.
| M | Tmax/ °C | Tmin/ °C | TD/ °C | Tav | HO | He | RH% | TdP |
|---|---|---|---|---|---|---|---|---|
| J | 35.7 | 15.4 | 20.3 | 25.55 | 7.1 | 5.4 | 80 | 21.6 |
| F | 35.1 | 16.8 | 18.3 | 25.95 | 7.3 | 5.3 | 85 | 22.9 |
| M | 37.9 | 19.1 | 18.8 | 28.5 | 7.1 | 5.2 | 82 | 24.9 |
| A | 40.3 | 19.4 | 20.9 | 29.85 | 6.3 | 4.9 | 81 | 26.1 |
| M | 41.7 | 24.4 | 17.3 | 33.05 | 5.2 | 3.7 | 73 | 27.7 |
| J | 44.2 | 26.5 | 18.1 | 35.55 | 4.2 | 3.2 | 68 | 29.3 |
| J | 43.2 | 26.9 | 16.3 | 35.05 | 3.9 | 2.7 | 67 | 27.8 |
| A | 40.3 | 25.8 | 14.5 | 33.55 | 4.3 | 2.8 | 69 | 27.4 |
| S | 40.1 | 25.6 | 15.1 | 33.15 | 6.3 | 4.2 | 75 | 28.2 |
| O | 40.2 | 21.4 | 18.8 | 31.8 | 6.8 | 5.1 | 77 | 27.2 |
| N | 37.3 | 21.6 | 15.7 | 29.45 | 6.9 | 4.6 | 83 | 26.1 |
| D | 34.2 | 19.4 | 14.8 | 26.8 | 6.6 | 4.3 | 85 | 23.8 |
| M | Tmax/ °C | Tmin/ °C | ΔT°C | Tav/ °C | Ho | He | RH/% | TdP |
|---|---|---|---|---|---|---|---|---|
| J | 34.3 | 18.4 | 15.9 | 26.35 | 7.2 | 4.89 | 79 | 22.2 |
| F | 33.8 | 21.5 | 15.3 | 27.7 | 7.6 | 5.24 | 75 | 22.7 |
| M | 37.5 | 22.9 | 14.6 | 30.2 | 7.3 | 4.75 | 76 | 25.4 |
| A | 39.9 | 25.5 | 14.4 | 32.7 | 6.7 | 4.29 | 72 | 27.1 |
| M | 41.4 | 27.3 | 14.1 | 34.4 | 5.7 | 3.59 | 76 | 29.6 |
| J | 44.3 | 29.7 | 14.6 | 37.1 | 4.6 | 2.99 | 65 | 30.1 |
| J | 43.2 | 29.3 | 13.9 | 36.3 | 4.2 | 2.77 | 63 | 28.9 |
| A | 40.4 | 26.6 | 13.8 | 33.5 | 4.7 | 2.96 | 60 | 25.5 |
| S | 40.1 | 27.7 | 12.4 | 33.9 | 5.9 | 3.59 | 73 | 28.5 |
| O | 39.3 | 25.6 | 13.7 | 32.5 | 6.9 | 4.35 | 74 | 27.3 |
| N | 35.6 | 21.5 | 14.3 | 28.6 | 6.7 | 4.15 | 72 | 23.1 |
| D | 32.6 | 16.9 | 15.7 | 24.8 | 7.1 | 4.75 | 79 | 20.6 |
| (a) Asayita | (b) Dubti | (c) Samara | |||||||
|---|---|---|---|---|---|---|---|---|---|
| M | HO | He | kt | HO | He | kt | Ho | He | kt |
| J | 7.5 | 5.56 | 0.74 | 7.1 | 5.39 | 0.75 | 7.2 | 4.89 | 0.67 |
| F | 7.7 | 5.31 | 0.68 | 7.3 | 5.33 | 0.73 | 7.6 | 5.24 | 0.68 |
| M | 7.4 | 4.67 | 0.69 | 7.1 | 5.25 | 0.73 | 7.3 | 4.75 | 0.65 |
| A | 6.8 | 4.56 | 0.67 | 6.3 | 4.91 | 0.74 | 6.7 | 4.29 | 0.64 |
| M | 5.5 | 3.59 | 0.65 | 5.2 | 3.69 | 0.72 | 5.7 | 3.59 | 0.62 |
| J | 4.5 | 2.97 | 0.66 | 4.2 | 3.02 | 0.71 | 4.6 | 2.99 | 0.65 |
| J | 3.8 | 2.58 | 0.61 | 3.9 | 2.58 | 0.66 | 4.2 | 2.77 | 0.65 |
| A | 4.1 | 2.71 | 0.63 | 4.3 | 2.75 | 0.63 | 4.7 | 2.96 | 0.62 |
| S | 5.6 | 3.58 | 0.66 | 6.3 | 4.16 | 0.67 | 5.9 | 3.59 | 0.61 |
| O | 6.8 | 4.56 | 0.64 | 6.8 | 5.03 | 0.65 | 6.9 | 4.35 | 0.63 |
| N | 7.1 | 5.12 | 0.72 | 6.9 | 4.62 | 0.67 | 6.7 | 4.15 | 0.62 |
| D | 7.3 | 5.41 | 0.74 | 6.6 | 4.29 | 0.74 | 7.1 | 4.75 | 0.67 |
3.3. Air Temperature, Humidity, and Dew Point Studies
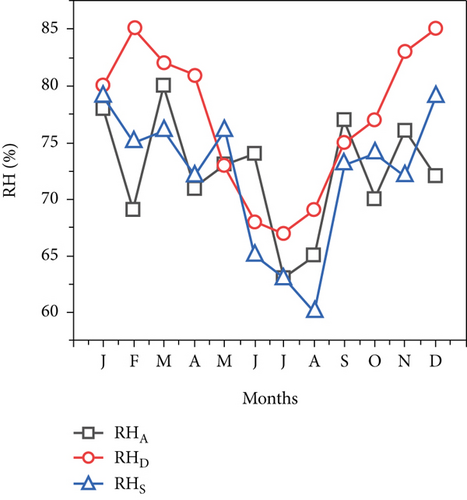
There is a correlation between relative humidity and both air temperature and dew point temperature. For the purpose of this study, the Ethiopian National Meteorological Agency (EMA) supplied the monthly air temperature relative humidity data for three different stations in the Afar region for 2017. A very simple estimate that allows conversion between temperature, relative humidity, and the dew point is also available. To determine the maximum and minimum temperatures of each month, the highest and lowest temperatures are averaged over the duration of a month. Figure 7a shows the relative humidity at the cities of Aysaita, Dubti, and Samara in 2017. The three locations displayed a similar pattern of variability, with RH decreasing from January to July and then increasing from July to December. The highest recorded RH was 79% in January in Samara city, 80% in March in Asayita City, and 85% in February in Dubti City. The lowest recorded RH was 63% in June in Asayita City, 67% in July in Dubti City, and 60% in August at Samara City (Tables 3, 4, and 5). Figure 7b shows the dew point plots for the cities of Asayita, Dubti, and Samara in 2017. The dew point temperature movement throughout the year is shown when the high dew point temperature is projected to occur in Aysaita City from May to October, Dubti City from April to November, and Samara City from April to October. The Asayita station recorded the lowest dew point temperatures between January and April and between November and December, but its worth was relatively high from May to October. Air temperature and relative humidity are two distinct environmental factors that are significantly impacted by the dew point temperature.
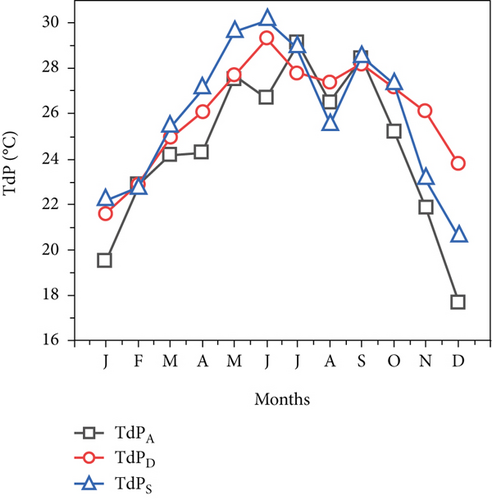
The dew point temperature, which indicates how steamy and oppressively humid the Afar region will be throughout the year, can be used to calculate the total quantity of moisture in the air. Furthermore, the Samara City dew point temperature is comparatively high from January to September and lower from January to March, November, and December based on meteorological temperature by Equation (10).
For every rise in air temperature, a variety of climatic events affect both the RH and the dew point temperature [33], and Figure 7a shows how they interact to affect the RH. Figure 7b shows the variation of the average monthly dew point. The dew point followed the same trend as the air temperature, varying from 10°C to 25°C. From January’s lowest number to June, July, August, and September’s highest, the dew point increased. It finally fell considerably to 13.65°C, the second-lowest temperature. In general, when the ambient temperature fluctuates uniformly, there is a correlation between the relative humidity and the dew point temperature. However, in this study area, the ambient temperature fluctuated inconsistently, resulting in inconsistent variations in the RH and dew point temperature. This could be caused by a variety of environmental factors, including dusty particles, air particles, or unclear sky conditions. Additionally, the variations in air temperature between different locations will also cause variations in air pressure, which will result in air movement and wind. As is well known, both air temperature and relative humidity affect dew point; however, the results indicate that air temperature affects dew point more than relative humidity.
The sun shine model [36–39] and temperature model from the models [49] used in this study are the suggested models, and they can be used to accurately estimate global solar radiation at the study location specifically or over the entire Afar region, generally, according to the discussion above. Furthermore, by using this model (Equations (1) and (9)), it is possible to compute global solar radiation with adequate accuracy at diverse locations when no device for detecting solar radiation is available. Additionally, it is suitable for forecasting at any location globally; however, because it is site-dependent, its empirical coefficients must be adjusted against the local data when used in other sites. In addition, the temperature data is easily and continuously captured for various purposes, which is considered the main advantage of using the present technique in this study. In general, these models’ high applicability can be attained by combining them with a range of short- or long-term weather forecasting techniques, which are mostly employed to accurately predict meteorological conditions like sun shine and temperature. Further, the relationship between relative humidity and air and dew point temperatures is a crucial component in estimating and quantitatively characterizing the possible solar radiation at the study location. In order to calculate the accurate estimate for solar radiation, which is crucial and the main factor for designing for various solar applications in the upcoming years, we use these precise temperature predictions as inputs to our solar radiation model (Equations (1) and (9)).
4. Conclusions
Estimating solar radiation using the Afar region’s input point parameters is the research’s output. It comes to the conclusion that two different factors—changes in solar radiation and temperature variation determine well solar energy applications function. The study’s conclusions demonstrate that temperature-based models that take into consideration both the highest and lowest temperatures as well as sunshine hour models are the most effective means of predicting solar radiation for this research study area.
- ✓
The sunshine model served as the basis for the 2013–2017 estimates of solar radiation in the Afar region. In February, the highest reported averages were 7.4 kW/h/m2/day at Aysaita City, 7.2 kW/h/m2/day at Dubti City, and 7.4 kW/h/m2/day at Samara City.
- ✓
The cities of Asayita, Dubti, and Samara received 5.56, 5.39, and 5.24 kw/h/m2/day of the estimated global solar radiation in the Afar area in 2017, respectively, based on the temperature model.
- ✓
The months of January and April saw the lowest and largest monthly temperature variations, respectively. August was the month with the highest relative humidity, while April had the lowest.
- ✓
The highest recorded relative humidity was 80% in March for Aysaita City, 85% in February for Dubiety City, and 79% in January for Samara City.
- ✓
The locations that showed solar radiation are more than 4.1 kW/h/m2/day according to the sunshine model and higher than 5.24 kW/h/m2/day according to the temperature model.
- ✓
According to the research findings, the Afar region has the highest levels of solar radiation, which makes it a suitable site for solar photovoltaic cell applications and the region’s potential for renewable energy.
Nomenclature
-
- a, b
-
- Angstrom constants (for afar region a = 1.021 and b = 0.371)
-
- H
-
- the monthly mean of daily horizontal solar radiation
-
- He
-
- the estimated horizontal solar radiation
-
- H0
-
- the monthly mean of daily extraterrestrial solar radiation
-
- ω
-
- hour angle (degree)
-
- ωs
-
- sunset hour angle for mean day of month (degree)
-
- Φ
-
- latitude angle (degree)
-
- Eo
-
- eccentricity correction facto
-
- Isc
-
- the solar constant
-
- A
-
- anisotropy index
-
- nd
-
- the day number of the year
-
- δ
-
- declination angle
-
- GM
-
- estimated global solar radiation
-
- H
-
- monthly horizontal radiation
-
- HAV
-
- monthly average horizontal radiation
-
- Ho
-
- global solar radiation
-
- K
-
- Hargreaves constant
-
- NMAE
-
- Notational Meteorological Agency of Ethiopia
-
- Tmin
-
- daily minimum temperatures
-
- Tmax
-
- daily maximum temperatures
-
- TdP
-
- the dew point temperature
-
- T
-
- the average temperature
-
- TD
-
- the temperature difference
-
- RH
-
- the relative humidity
-
- S
-
- monthly average daily hours of bright sunshine (hours)
-
- So
-
- monthly average of the maximum possible daily hours (day length) of bright sunshine
-
- WMO
-
- World Meteorological Organization
-
- kt
-
- the clearness index for the day
-
- ktA
-
- clearness index of Asayita
-
- ktD
-
- clearness index of Dubti
-
- ktS
-
- clearness index of Samara
Conflicts of Interest
The author declares no conflicts of interest.
Funding
No funding was received for this manuscript.
Acknowledgments
I would like to thank EMI for providing the data of the study location of the Afar region.
Open Research
Data Availability Statement
The data that support the findings of this study are available from the corresponding author upon reasonable request.


