Machine Learning–Based Multiparameter Performance Predictions of Ultra-Dense WDM FSO–FTTx Systems Under Diverse Weather Conditions
Abstract
Free-space optical (FSO) communication is vital for modern wireless systems due to its high data rates, energy efficiency, secure transmission, and cost-effectiveness. However, weather-induced attenuation, turbulence, and pointing errors affect performance. Recent advancements leverage machine learning (ML) to predict and enhance system reliability under adverse conditions, improving channel awareness and quality of service (QoS). This study has applied modulation schemes, including on-off keying with nonreturn-to-zero (OOK–NRZ), quadrature phase shift keying (QPSK), polarization division multiplexed QPSK (PDM–QPSK), and polarization shift keying (PolSK) with an ultra-dense wavelength division multiplexed (WDM) FSO-fiber-to-the-x to modulate the data across clear, fog, rain, and hazy conditions. Furthermore, multiparameter performance predictions of the system under diverse weather conditions have been assessed using ML algorithms such as extreme learning machine (ELM), support vector machine (SVM), and gradient boosting (GB). Mean squared error (MSE) and coefficient of determination (R2) statistical measures have been employed to measure the robustness of ML. Modulation schemes, atmospheric attenuation, input powers, and FSO link length are fed to the input of ML as features. At the same time, the primary modeling targets are optical signal-to-noise ratio (OSNR), quality factor (QF), bit error rate (BER), data rate, and received power. The simulation results have demonstrated that the GB ML achieved the model’s best performance with reduced MSE values for OSNR, QF, BER, data rate, and received power of 2.0203e − 03, 9.3905e − 04, 3.5214e − 12, 1.2527e − 03, and 2.0203e − 03, respectively. Moreover, the study demonstrated exceptional R-squared values of 0.9997, 0.9998, 0.9987, 1, and 0.9997, respectively.
1. Introduction
1.1. Background and Rationale
In the rapidly evolving fifth-generation (5G) and sixth-generation (6G) wireless communication systems, artificial intelligence (AI), particularly machine learning (ML), plays a pivotal role in enabling intelligent network orchestration and management [1]. These advanced systems heavily integrate the internet of things (IoT), especially the tactile IoT, which introduces challenges related to traffic diversity and stringent quality of service (QoS) requirements [1, 2]. Free-space optics (FSO) is, therefore, among the promising methods for high data rates with lower power consumption, offering secure and cost-effective communication [1]. However, it has significantly deteriorated depending on the propagation conditions, including weather-induced attenuation, turbulence, and pointing errors operating in different environments. Recent developments of MLtechniques in wireless communication have demonstrated their use in evaluating and optimizing an FSO system for performance under adverse conditions. Those models perform real-time estimations of channel parameters to guarantee top-notch service independent of fluctuating weather conditions and can be reliably deployed [1]. Moreover, the study introduced by the authors in [3] developed a novel decoding technique using the support vector machine (SVM) for on-off keying (OOK)–modulated FSO signals to overcome these performance limits of FSO systems. FSO systems are known to be negatively impacted by various weather conditions that can cause impairment, such as atmospheric turbulence, fog, and precipitation. They concluded that the SVM–based model could achieve impairment caused by fog, rain, snow, turbulence, and pointing errors. The study has pointed out various gaps that need further investigation: poor performance of the schemes in strong turbulence regimes, unaddressed inherent complexity of deep learning (DL)–based decoders, insufficient investigation into the impact of severe weather conditions on performance, and advanced algorithms to improve the system’s efficiency.
Several research works have examined the effectiveness of QAM and quadrature phase shift keying (QPSK) modulation techniques in FSO optical wireless communication systems for lousy weather conditions [3]. The study utilized SVMs to analyze how atmospheric factors affect communication quality. The results demonstrate that the QPSK single channel performs best under minimal haze and for long propagation distances but rapidly loses efficiency in the case of dense fog. These observations indicate that an adaptive scheme will be essential in modulation to communicate efficiently in such circumstances. Thus, this work is a valuable guide for further research on optical wireless systems. In addition, the research presented by the authors in [4] integrated ML techniques for real-time optical performance estimation for FSO systems. The work demonstrated that meteorological factors such as clear, haze, and rain weather greatly influence the effectiveness and dependability of terrestrial radio over FSO (RoFSO) communication. Bit error rate (BER) and signal-to-noise-ratio variations, which directly impact the QoS, are caused by certain environmental factors. In this context, RoFSO systems that use advanced modulation techniques, including 32-QAM and 64-QAM OFDM, were considered. ML models, namely, ANN, KNN, and DT, were employed to predict system performance for various weather conditions. The input variables were the atmospheric attenuation parameters and internal system features, while the target outputs were SNR and BER. The study explores ML techniques to enhance real-time optical performance in FSO systems, focusing on advanced modulation schemes such as 32-QAM and 64-QAM OFDM for better reliability and service quality.
The effects of weather attenuation, turbulence, and pointing problems on the performance of FSO communication systems were investigated [2]. They showed that the traditional maximum likelihood decoding technique requires prior channel information to decode the signal effectively. They proposed an innovative decoding method using the SVM for decoding OOK–modulated FSO signals. They tested it under various atmospheric conditions, including fog, rain, snow, turbulence, and pointing errors. The SVM–based decoding schemes successfully mitigated the attenuation, pointing errors, and turbulent channel impairments. Although the study shows the high performance of the proposed decoding based on SVM for poor weather conditions, further investigations are required to find its scalability for higher modulation formats and real-time implementation in dynamic environments. In parallel, the authors in [5] analyzed the effectiveness of an OFDM–FSO system in Bangladesh under atmospheric turbulence channels. They modeled the channel using a gamma–gamma (G–G) distribution and evaluated its impact on system functionality based on weather conditions. Their study showed that signals were seriously degraded due to attenuation and turbulence in the atmosphere, indicating one of the significant challenges in developing robust performance prediction models. Furthermore, these results underscore how local weather data are included in predictive models to provide better FSO systems’ reliability under realistic scenarios. All these models need further research in various geographical regions with different climatic conditions.
The study by [6] contributed to this discussion by using the K-nearest neighbor (KNN) ML algorithm in distinguishing different Hermite–Gaussian (HG) beams in mode division multiplexed (MDM) FSO systems. Their study examines how well these beams transmit information under rainy weather conditions in various Indian cities. The KNN model, in its classification accuracy, stands at 94% in identifying the beams; hence, this has the potential for performance improvement in the wavelength division multiplexed (WDM) FSO system. This paper has investigated how ML techniques can improve the capacity and reliability of FSO communications under intense weather conditions. In a related study [7], the BER performance for SISO and MIMO RoFSO systems, atmospheric turbulence that ranges from weak to vigorous, was examined using BPSK modulation. The results examined how well SISO and MIMO systems performed in weak to strong atmospheric turbulence for BPSK signals and additionally examined system behavior under heavy turbulence conditions by changing parameters such as SNR, responsivity, energy per bit to noise power spectral density ratio, and scattered conditions. ML models such as ANN, decision trees, and gradient boosting (GB) regression have been used to estimate the quality of the received signal regarding the BER. While the study used ML models to predict BER within turbulent conditions, further optimization of such models is required to operate in real-time and for scalability analysis over various environmental conditions.
Furthermore, the work in [8] has also employed AI, namely ML, to address the issues of rate adaptation and switching between FSO/RF links. For hybrid FSO/RF systems, a random forest–based adaptive modulation mechanism was developed with link budget estimation under various environmental conditions in mind, even during harsh weather conditions, including rain and fog. The model classified the link budget threshold for modulation techniques such as PPM, PSK, and QAM, using local meteorological data to achieve precise soft-switching and modulation adaptability. According to the results of the simulations, the AI–powered adaptive modulation technique maintains reliable hybrid FSO/RF communication. The study in [9] presents a method where the requirement for channel state information (CSI) is eliminated by directly inputting the received signal into a deep neural network. They proposed a detector based on DL and compared its performance with both perfect CSI ML and blind CSI ML detectors. Researchers model the weak, weak-to-strong, and saturated atmospheric turbulence regimes using negative exponential, log-normal, and GG distributions. The results indicate that the DL–based detector achieved performance close to the ideal CSI ML detector while maintaining significantly lower complexity than the blind CSI ML detector. Besides, the authors of [10] have shown a significant improvement in IsOWC systems that use ANNs for precise power estimation between satellites. They successfully handled the most critical problems related to atmospheric turbulence and environmental conditions that highly affect signal integrity and communication efficiency. The proposed work generates dataset-based input attributes, such as propagation distance and scintillation attenuation; ANN was good for the linear and nonlinear data fit, which enhanced the prediction’s accuracy. These findings highlight the possibilities of ANNs for enhancing IsOWC systems and provide the essential framework for other research in improving technology for space communication shortly within complex space environments.
As the study by the authors in [11] indicated, atmospheric turbulence degrades the FSO–transmitted signals of the recovered signal’s bit error performance at the receiver by causing scintillation. They showed that they might overcome these limitations by using DL detection techniques. This study presented a novel method for OOK–modulated signal identification using different models of DL over different strength FSO turbulent channels without being aware of the channel’s parameters. Further research is needed to explore the scalability of these DL models for real-time applications and their robustness under dynamic environmental conditions. The study in [12] comprehensively analyzed hybrid FSO/RF networks. The paper discussed the weakness of stand-alone systems, especially for adverse weather conditions. The argument brought forth by the authors is that the addition of RF connectivity enhances reliability and availability in bad atmospheric conditions. They show that routing protocols and switching techniques require adaptive solutions to address dynamic weather changes, which would improve the overall efficiency of WDM FSO systems. Researchers expect to conduct more studies to optimize energy efficiency and scalability in hybrid networks. The study in [13] explored the implications of the hybrid FSO system and analyzed the challenges caused by the presence of the RF spectrum. The hybrid system is extremely capable of high-speed data transmission by lowering the effect of environmental factors such a fog and scintillation. Their work stresses the development of robust modulation schemes and adaptive channel models to fit variable weather conditions, with which performance prediction in WDM FSO systems would be possible. Furthermore, they have conducted a contemporary survey on FSO communication to highlight recent developments and technical challenges in this field. They emphasize adaptive modulation and relay-aided transmission methods for achieving link reliability even under severe conditions. These findings underpin that a deeper understanding of atmospheric effects and deploying more sophisticated ML techniques considerably improved performance prediction for WDM FSO systems.
Lastly, recent advancements in FSO communication systems have leveraged diverse multiplexing and ML techniques to address performance encounters under dynamic weather. Early foundational work by the authors in [14, 15] revealed the potential of optical MDM for improving spectral efficiency in RoFSO systems. Specifically, their examinations on HG and Laguerre–Gaussian (LG) modes [14] and 4 × 20 Gbps MDM transmissions [15] established critical benchmarks for signal-to-noise ratios and power coupling in clear weather, though weather resilience remained unexplored. Building on these multiplexing standards [16], we integrated polarization division multiplexing (PDM) with OCDMA to achieve 100 Gbps FSO transmission under fog, stressing cost-effective strategies to mitigate weather-induced attenuation. However, these studies lacked predictive frameworks for multiparameter optimization. The convergence of photonic radar and ML was studied through the [17] MDM–WDM system, which employed decision tree and random forest classifiers to attain 91.51% target recognition accuracy under fog and solar noise, demonstrating ML’s transformative role in weather-resilient signal processing. While prior works advanced multiplexing techniques [14–17] and isolated ML applications [17], they did not holistically address ultra-dense WDM–fiber-to-the-x (WDM–FTTx) systems or multiparameter ML predictions across diverse weather scenarios. Earlier studies focused on single-output metrics such as received power [14] or fog resilience [16], whereas they [17] pioneered ML–driven photonic radar but limited targets to recognition accuracy.
Building upon the studies above, ML algorithms integrated into the performance prediction of WDM FSO systems have the potential to develop better communication reliability in various weather conditions. These investigations’ combined results indicated how crucial meteorological data, adaptive algorithms, and hybrid system designs are to deal with the difficulties brought on by atmospheric variation. While active research is ongoing on these dimensions, the possibility of having more reliable FSO communications systems is becoming increasingly feasible, which paves the way for future advancements in optical wireless technologies. This work examines multiparameter performance predictions of ultra-dense WDM FSO–FTTx (UDWDM FSO–FTTx) systems under foggy, rainy, hazy, and clear weather scenarios. The received signal values of optical signal-to-noise ratio (OSNR), quality factor (QF), BER, data rate, and received power are analyzed based on modulation schemes, atmospheric attenuation, input power, and FSO link lengths. The study further examines the estimation of system performance metrics using extreme learning machine (ELM), SVM, and GB ML techniques. In addition, mean square error and determination coefficient (R-squared) are the leading performance measures for assessing the prediction accuracy of different ML algorithms.
This study is structured so that each section logically flows into the other. The Introduction starts with 1.1 Background and Rationale, which introduces the context and importance of the study, followed by 1.2 Core Attributes and Unique Contributions, which describes the novelty of the research. The Materials and Method section is elaborative, initiated with 2.1 System Model that is further divided into subsections like 2.1.1 Atmospheric G–G Turbulence FSO Channel Model, 2.1.2 Models of Diverse Weather Conditions Specific Attenuation and 2.1.4 FSO Link Model to describe the technical framework comprehensively. It elaborates on data handling in 2.2 Dataset Preprocessing and ML Models. It is divided into 2.2.1 Data Preprocessing and 2.2.2 ML Models Building to explain how data was prepared and analyzed using ML techniques. Section 3, Results and Analysis section, where an objective interpretation is given; Sections 4 and 5, Discussion and Conclusion, provide detailed interpretations of the results and summarize the study’s findings.
- •
Investigation of multiple parameter performance prediction: This study focuses on the performance prediction of UDWDM FSO–FTTx systems. It identifies multiple parameter performance estimations, including OSNR, QF, BER, data rate, and the received power, as a key factor in achieving high-quality service in such systems under varying weather conditions.
- •
Utilization of diverse modulation schemes: The work uses modulation formats such as on-off keying with nonreturn-to-zero (OOK–NRZ), QPSK, polarization division multiplexed QPSK (PDM–QPSK), and polarization shift keying (PolSK). The different modulation schemes have been studied to determine which one may optimize the performance in differing atmospheric conditions.
- •
Use of ML techniques: The study uses the most recent ML methods, such as ELM, SVM, and GB, to predict system performance. These techniques effectively model complex input feature-performance metric relationships.
- •
Identification of optimal predictive model: The GB ML model showed the best performance with lower mean squared error (MSE) values for QF, BER, OSNR, data rate, and received power as 9.3905e − 04, 3.5214e − 12, 2.0203e − 03, 1.2527e − 03, and 2.0203e − 03, and the R-squared values for QF, BER, OSNR, Data Rate, and Received Power measure 0.9998, 0.9987, 0.9997, 1, and 0.9997, respectively.
Our study actively analyzed multiple parameter performance estimation in an UDWDM FSO–FTTx technology. The study significantly contributed to multiparameter performance estimation, forming the foundation for enhanced channel awareness and improved QoS under varying weather conditions. We evaluated the effectiveness of several modulation schemes, including PDM–QPSK, OOK–NRZ, QPSK, and PolSK, to optimize system performance across diverse atmospheric scenarios such as fog, rain, haze, and clear weather. Advanced ML techniques, including ELM, SVM, and GB, were applied to model complex relationships between input features and performance metrics. The results identified GB and ELM as the most accurate predictive models.
2. Materials and Methods
This study employs a simulated dataset generated from an UDWDM FSO–FTTx system to evaluate the performance under varying atmospheric conditions. The dataset consists of 4800 rows and nine columns, incorporating features such as modulation schemes (OOK–NRZ, QPSK, PDM–QPSK, and PolSK), input power levels, FSO link lengths, and atmospheric attenuation. Key performance indicators include OSNR, QF, BER, data rate, and received power. Data preprocessing involved normalization to mitigate the impact of outliers and ensure uniform scaling across features. Data normalization was applied, followed by an 80:20 split for training and testing sets with a fixed random state to ensure reproducibility. Python was the primary software for system model data generation and ML implementation. ML models applied in this analysis include an ELM with log-sigmoid activation, a SVM with a polynomial kernel, and GB algorithms. These models were trained on simulated datasets to predict performance metrics, including weather-induced attenuation levels, link distances, modulation schemes, and input power variations. The evaluation focused on diverse atmospheric conditions such as foggy, rainy, hazy, and clear weather scenarios to assess the system’s robustness under real-world environmental influences.
2.1. System Model
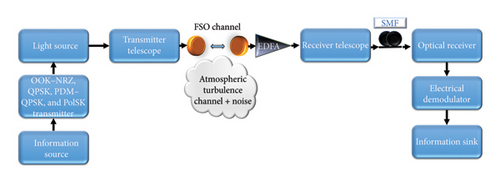
The proposed UDWDM FSO–FTTx system consists of five major components, each contributing effectively to ensure effective optical communication. The transmitter uses advanced modulation techniques to convert input signals into optical signals, using LED or LASER sources for free-space transmission.
Atmospheric turbulence, fog, rain, and scattering introduce attenuation, scintillation, and path loss, deteriorating signal quality. An EDFA amplifies the attenuated signals after the FSO link without electrical conversion to compensate for those effects. The amplified signals are forwarded over a 35-km SMF section for minimal degradation. At the receiver, an optical receiver captures and demodulates the signal to retrieve original data while compensating for residual impairments caused by atmospheric or fiber losses.
2.1.1. Atmospheric G–G Turbulence FSO Channel Model
The atmospheric channel in FSO communication affects the signal propagation through attenuation, scintillation, diffraction, refraction, and absorption. The reason for the attenuation is the transmission and absorption of air particles, which reduces and, depending on the wavelength, lowers the signal’s intensity. Scintillation, caused by the fluctuations in the refractive index, introduces rapid intensity variations and noise [19, 20]. Diffraction leads to beam divergence as light bends around obstacles or refractive changes, while refraction, influenced by temperature, pressure, and humidity shifts, alters beam trajectory and causes pointing errors. In addition, absorption by raindrops or air density further degrades the signal quality. Thus, accurate modeling of these effects is essential for reliable FSO communication systems.
The simulation parameters of the proposed UDWDM FSO–FTTx system are listed in Table 1 [19]. The atmospheric channel for our study is defined by parameters and measurements that describe its properties and variations, modeled using the G–G probability distribution model. G–G models are frequently utilized in FSO communications to characterize scintillation caused by air turbulence [20–22].
| Value | Units | |
|---|---|---|
| Transmitter parameters | ||
| Transmitter | ||
| CW laser wavelength | 1550 | nm |
| Frequency spacing | 0.2 | nm |
| Power | −20 to 5 | dBm |
| Extinction ratio | 30 | dB |
| Linewidth | 0.1 | MHz |
| Modulation type = OOK–NRZ, QPSK, PDM–QPSK, and PolSK | ||
| Channel parameters | ||
| FSO channel | ||
| Range | 0 to 12.5 | km |
| Transmitter aperture diameter | 5 | cm |
| Beam divergence | 2 | mrad |
| Receiver aperture diameter | 20 | cm |
| Atmospheric conditions | Clear, hazy, rainy, and foggy | |
| Noise model | AWGN | |
| Atmospheric turbulence FSO channel model | Gamma–gamma (G–G) | |
| EDFA | ||
| Radius of core | 2.2 | μm |
| Radius of Er doping | 2.2 | μm |
| Lifetime of Er metastable | 10 | ms |
| Aperture in numerical | 0.24 | |
| Density of Er ion | 10e + 024 | m−3 |
| At 1550 nm, loss | 0.1 | dB/m |
| Loss at 980 nm | 0.15 | dB/m |
| Length | 5 | m |
| Receiver parameters | ||
| Optical fiber | ||
| Reference wavelength | 1550 | nm |
| Length | 35 | km |
| Attenuation | 0.2 | dB/km |
| Dispersion | 16.75 | ps/nm/km |
| Dispersion slope | 0.075 | ps/nm2/km |
| Differential group delay | 0.2 | ps/km |
| Effective area | 80 | μm2 |
| n2 | 26e − 021 | m2/W |
| Max. nonlinear phase shift | 3 | mrad |
| PIN photodiode | ||
| Responsivity | 1 | A/W |
| Dark current | 10 | nA |
| Thermal power density | 100e − 024 | W/Hz |
| Shot noise distribution | Gaussian | |
| Junction capacitance | 3 | pF |
| Low pass cosine roll-off filter | ||
| Cutoff frequency | 0.75 ∗ symbol rate | Hz |
| Depth | 100 | dB |
| Roll-off factor | 0.5 | |
| Layout parameters | ||
| Bit rate | 1280e + 009 | bits/s |
| Sequence length | 1024 | bits |
| Sample per bit | 64 | |
The model incorporates several critical elements: Shape parameters αf and βf, which define small and large-scale turbulence effects based on atmospheric conditions and link geometry; Gamma functions Γ(αf) and Γ(βf), which are essential for normalizing the modified Bessel function Kν(x) and the probability density function (PDF), which reflects turbulence-induced fading. The intensity (I) represents fluctuating received signal strength due to atmospheric variations, while a normalization constant, the factor 2(αfβf) (αf + βf)/2Γ(αf) Γ(βf), ensures the PDF integrates into one. This model predicts signal degradation probabilities under varying atmospheric conditions, aiding in optimizing the FSO link.
2.1.2. Models of Diverse Weather Conditions’ Specific Attenuation
Haze attenuation: Haze particles persist longer in the atmosphere than rainfall and are influenced by visibility levels, making this condition more common in tropical regions. Applying the Kruse and Kim model, heavy haze attenuation is quantified as 2.37 dB/km based on visibility [23–27].
Fog attenuation: Fog particles, comparable in size to optical wavelengths, cause significant photon scattering, leading to high attenuation and reduced visibility. This makes fog conditions a critical challenge for FSO communication. Fog attenuation, calculated using the Kim and Kruse model, highly depends on atmospheric visibility [23–27]. Thus, for this study, using equations (5)–(9), at an operating wavelength of 1550 nm, the atmospheric attenuation values are calculated based on the influence of clear sky, rain, haze, and fog weather conditions and presented in Table 2.
2.1.3. FSO Communication Link Model
2.2. Dataset Preprocessing and ML Models
Data preparation and collection for this study are accomplished by obtaining the simulated dataset using essential performance parameters such as OSNR, QF, BER, data rate, and received power of the signal under various atmospheric conditions, which were measured by the proposed UDWDM FSO–FTTx system for various input parameter interactions, which included modulation formats, atmospheric attenuation levels, input power values, and the length of the FSO link. Then, data are normalized in a way that eliminates the outliers. The final data shape is formed of 4800 rows and nine columns, where the features are modulation schemes (OOK–NRZ, QPSK, PDM–QPSK, and PolSK), input power levels, FSO link lengths, and atmospheric attenuation, and where the labels are OSNR, QF, BER, data rate, and received power. Data are then broken down into a 80:20 split ratio between a train set and a test set to ensure robust model evaluation, and a fixed random state is applied to maintain reproducibility [34]. As shown in Table 3, the dataset description provides a clear overview of the dataset’s features and structure. In addition, Table 4 presents the components and variables used in our model, along with a clear description of their respective meanings.
| Description | Values | |
|---|---|---|
| Data source | Simulated dataset by utilizing the proposed UDWDM FSO–FTTx system | |
| No. of instances | 4800 | |
| No. of variables | Numerical | 8 |
| Categorical | 1 | |
| Model components/variable’s full name | Data type | Variables | |
|---|---|---|---|
| Modulation | OOK–NRZ | Categorical | Input feature |
| QPSK | |||
| PDM–QPSK | |||
| PolSK | |||
| Atmospheric attenuation (dB/km) | Numerical | Input feature | |
| FSO length (km) | Numerical | Input feature | |
| Input power (dBm) | Numerical | Input feature | |
| Quality factor (dB) | Numerical | Output label | |
| Bit error rate | Numerical | Output label | |
| Optical signal-to-noise ratio (dB) | Numerical | Output label | |
| Received power (dBm) | Numerical | Output label | |
| Data rate (Gbps) | Numerical | Output label | |
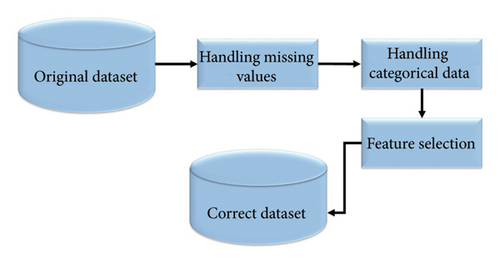
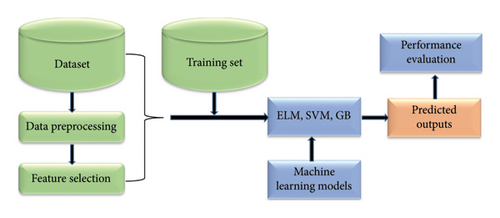
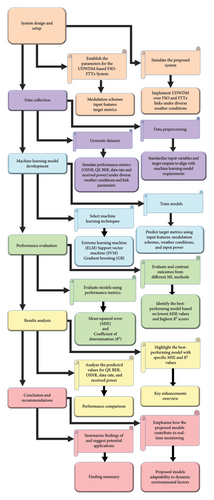
The process begins with generating datasets by simulating performance metrics such as OSNR, QF, BER, data rate, and received power under varying atmospheric conditions (foggy, rainy, hazy, and clear weather). Normalization was performed on modulation schemes such as OOK–NRZ, QPSK, PDM–QPSK, PolSK, input power levels, lengths of the FSO link, atmospheric attenuation, OSNR, QF, BER, data rate, and finally received power to standardize these data to ML models. Methods for ML, including SVMs, ELMs, and GB, are then employed to predict target metrics. Figures 1 and 2 show a structured flow diagram that outlines the steps from dataset generation to preprocessing, model training, and evaluation for accurate prediction of optical transmission parameters under diverse environmental conditions. The task involves predicting multiple target variables based on input features , where n is the number of samples, p is the number of features, and m is the number of target variables.
2.2.1. Data Preprocessing
Preprocessing prepares clean and relevant data for training ML models. This study used the imputation technique to examine the dataset for inconsistencies and missing data. To ensure compatibility with ML algorithms, categorical features were encoded using one-hot encoding.
Feature selection was made to retain only the most essential variables for input features and target metrics. Redundant or irrelevant features were removed to enhance the model’s performance. The data were then normalized, and the scaling was performed uniformly to be suitable for ML algorithms.
2.2.2. ML Models Building
The study developed ELM, SVM, and GBM ML models to predict target metrics such as OSNR, QF, BER, data rate, and received power in FSO communication systems. Input features included modulation schemes (OOK–NRZ, QPSK, PDM–QPSK, and PolSK), atmospheric conditions (foggy, rainy, hazy, and clear), input power levels, and FSO link lengths. Researchers split the dataset into training and testing subsets while ensuring balanced feature representation. The model performance was optimized using MSE and R2. The best-performing model achieved minimal MSE and maximum R2 through iterative refinement. The selection of ELM, SVM, and GB was motivated by their computation speed, interpretability, and stability for a medium-scale dataset. ELM’s randomized hidden-layer composition enables high-speed training and is suitable for real-time application without demanding significant computational resources [36]. SVM’s kernel-based methodology ensures resilience to outliers while maintaining transparent decision boundaries [36], a critical advantage over less interpretable neural networks for smaller datasets. GB minimizes overfitting risks through iterative error correction in its ensemble framework, achieving near-perfect parameter generalization [37]. While neural networks excel with large datasets, their complexity and resource requirements made ELM, SVM, and GB more practical choices for balancing accuracy and efficiency in our study scope.
Dataset preprocessing: This study generated the dataset by simulating UDWDM FSO–FTTx systems under various weather conditions, modulation schemes, and input power levels. Key performance metrics such as OSNR, QF, BER, data rate, and received power were collected. The dataset was preprocessed and prepared for the normalization of input features and target metrics to ensure compatibility with ML models. Biases were reduced, and better accuracy in the models was achieved through this step. Feature selection: Relevant features such as modulation schemes (OOK–NRZ, QPSK, PDM–QPSK, and PolSK), weather conditions (foggy, rainy, hazy, and clear), input power levels, and FSO link lengths were the selected impacts of these features on the system performance metric used as the basis for their selection.
Training set preparation: The preprocessed dataset was divided into subgroups for training and testing to make model creation and assessment more manageable. A typical split ratio of 80:20 was used to ensure adequate data for training while keeping some for validation. ML models: Three ML techniques, ELM, SVM, and GBM, were employed to predict system performance metrics. Each model was trained using the selected features as inputs to predict outputs such as QF, BER, OSNR, data rate, and received power. Predicted outputs: The trained models predicted the target metrics under varying conditions. These predictions were compared against actual simulated values to assess model accuracy. Performance evaluation: The model performance was evaluated using MSE and R2. The model with the highest R2 scores and the lowest MSE values across all projected outputs was determined to be the top performer.
2.2.2.1. Model for ELM ML
2.2.2.2. Model for SVM ML
2.2.2.3. Model for GBM ML
3. Results and Analysis
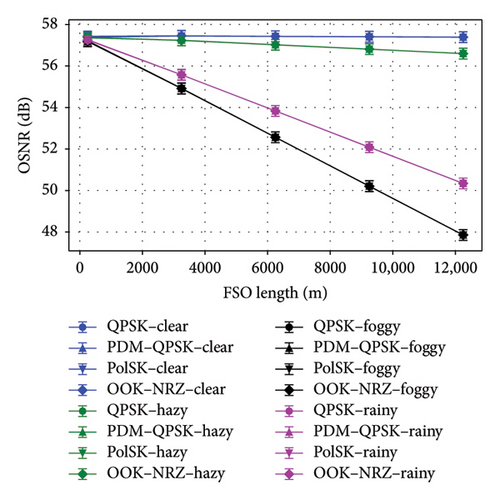
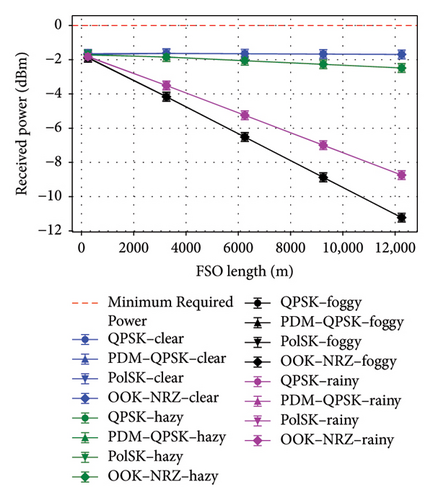
The system’s performance has been comprehensively evaluated by analyzing key parameters such as QF (dB), BER, OSNR (dB), Data rate, and received power (dBm) in relation to FSO range and input power under varying atmospheric conditions, including foggy, rainy, hazy, and clear weather from Figures 1, 2, 3, and 4. These metrics were recorded for different FSO link lengths ranging from 50 to 12,500 m while maintaining consistent system parameters. The study highlights the influence of increasing FSO link length on system performance across various modulation formats under diverse atmospheric conditions and turbulence levels. An increase in FSO link length resulted in the degradation of critical metrics such as OSNR, QF, BER, and received power across all examined modulation formats under the specified atmospheric conditions.
Figures 5(a), 5(b), 5(c), and 5(d) highlighted the performance of different modulation schemes in an UDWDM FSO–FTTx system under clear, hazy, foggy, and rainy weather conditions. For clear weather, PDM–QPSK achieved the highest QF of 30.617 dB at a link length of 12250 m with a minimal BER of 1.728765e − 52 and an OSNR of 57.77 dB, demonstrating superior performance compared to other schemes. In contrast, OOK–NRZ, while simpler, showed a lower QF of 24.617 dB at the given link length but suffered from a higher BER of 7.22e − 05. Under hazy conditions, all modulation schemes experience degradation; however, PDM–QPSK remains robust with a QF of 30.56 dB at a link length of 12,050 and an OSNR of ∼57 dB, while OOK–NRZ exhibited significant performance loss with a QF reduced to 24.56 dB over the same distance. The QF is highest for PDM–QPSK, reaching 29.85 dB in foggy conditions and 30.06 dB in rainy conditions, demonstrating superior signal quality compared to other schemes. The BER values indicated that PDM–QPSK achieved the lowest error rates, 2.47e − 44 in foggy and 1.84e − 46 in rainy conditions, due to its robustness against atmospheric impairments. Regarding OSNR, all modulation schemes maintained consistent levels around 48–50 dB, with slight variations across weather types. The received power remained stable at approximately −10 dBm for foggy conditions and improved to around −8 dBm during rain, reflecting better link performance in less dense atmospheric scattering scenarios. The results underscore that advanced modulation formats such as PDM–QPSK have resisted more unfavorable weather scenarios than simpler formats such as OOK–NRZ.
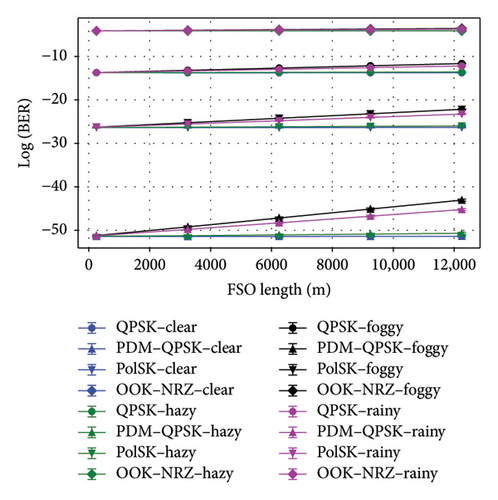
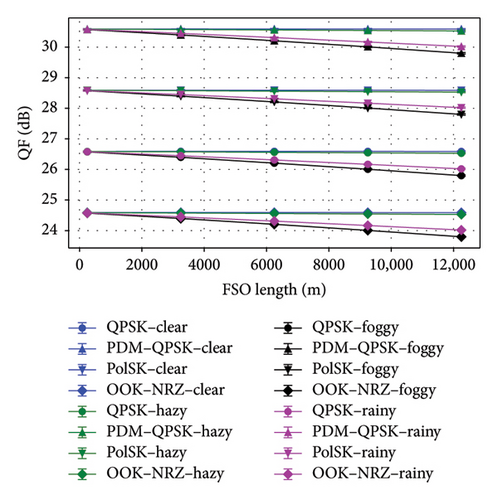
Figures 6(a), 6(b), and 6(c) underscored the effectiveness of different modulation schemes OOK–NRZ, QPSK, PDM–QPSK, and PolSK under clear and hazy weather conditions in terms of data rate, OSNR, log(BER), and QF. PDM–QPSK consistently achieved the highest data rate of 5120 Gbps with superior QF values exceeding 30 dB in clear (30.624 dB) and hazy (30.56 dB) conditions, demonstrating its robustness against atmospheric impairments. PolSK offered a balanced performance with a data rate of 2560 Gbps and high QFs above 28 dB (clear: 28.62 dB; hazy: 28.56 dB), making it suitable for moderate link lengths.
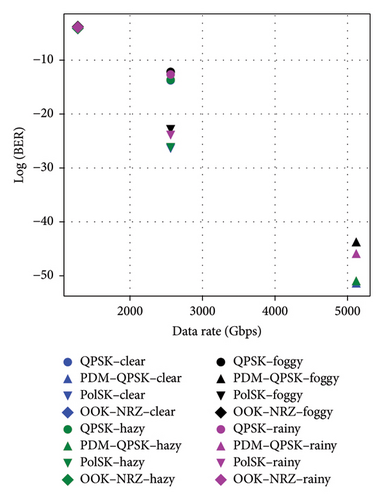
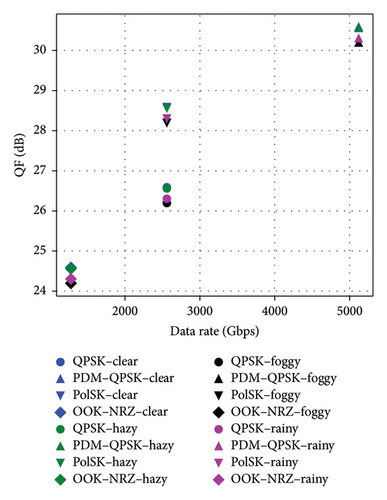
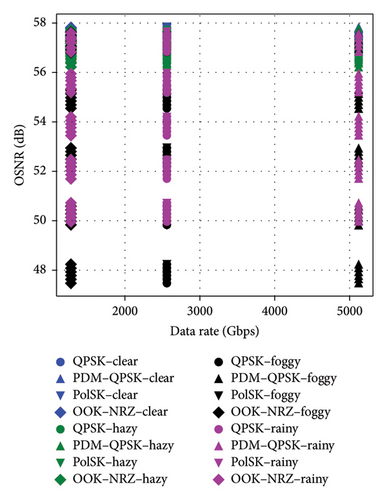
In contrast, OOK–NRZ exhibited lower data rates (1280 Gbps) and reduced QFs by around 24 dB (clear: 24.617151 dB; hazy: 24.558711 dB), reflecting its limitations in adverse weather scenarios despite simpler implementation. PDM–QPSK consistently outperformed other schemes with the highest data rates of 5120 Gbps, superior QFs (29.85 dB in foggy conditions and 30.06 dB in rainy conditions), and minimal BER values (2.47e − 44 in foggy conditions). In contrast, OOK–NRZ, while simpler, showed lower data rates (1280 Gbps) and higher BER values (2.51e − 04 in foggy conditions). The results also revealed that adverse weather impacted all metrics; however, rain has a slightly less detrimental effect compared to fog across all modulation schemes. Notably, OSNR remains stable around 48–50 dB, indicating robust signal quality despite environmental challenges. Across all schemes, BER values remained significantly low under clear conditions but increased slightly under haze, foggy, and rainy conditions due to signal attenuation effects on the FSO link. Notably, the data rate for PDM–QPSK is double to that of QPSK or PolSK (5120 vs. 2560 Gbps) due to polarization multiplexing, while OOK–NRZ exhibited the lowest data rate (1280 Gbps) but maintained acceptable performance metrics at the given link lengths.
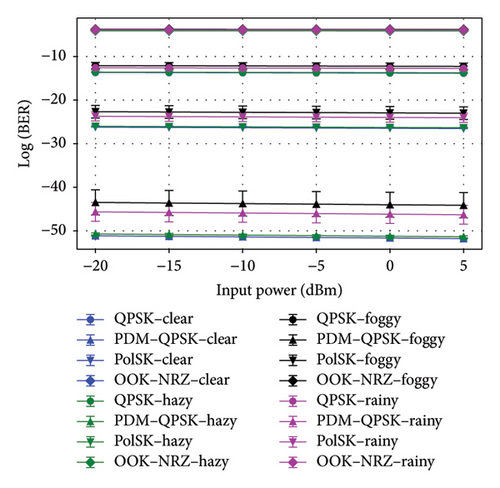
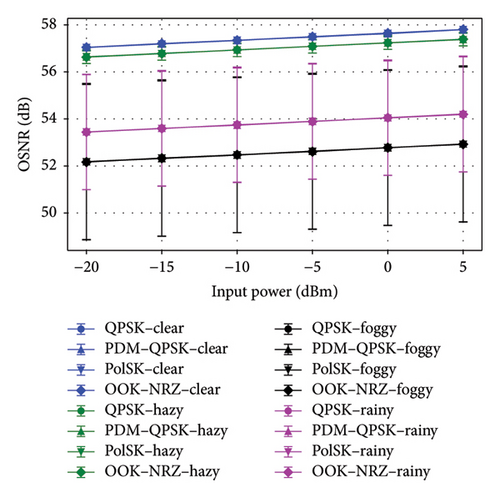
Figures 7(a), 7(b), and 7(c) highlighted the effectiveness of OOK–NRZ, QPSK, PDM–QPSK, and PolSK modulation schemes under varying conditions of the weather about input power. In the situation of clear weather, QPSK at 5 dBm input power achieved a QF of 26.617 dB with an OSNR of 57.77 dB, while PDM–QPSK reached a higher QF of 30.617 dB and an extremely low BER (1.73e − 52) at the same input power range. PolSK demonstrated robust performance with a QF of 28.62 dB and comparable OSNR (57.77 dB) at 5 dBm input power over a 12000m link. However, OOK–NRZ showed lower efficiency with a QF of 24.62 dB and a higher BER (7.22e − 05) despite maintaining similar OSNR levels. Under hazy conditions, all modulation schemes experience slight degradation; QPSK at 5dBm input power yielded a reduced QF of 26.56 dB, while PDM–QPSK still outperformed others with a QF of 30.56 dB and minimal BER (8.22e − 52). For the input power of 5 dBm, PDM–QPSK consistently outperformed other schemes with the highest QF values of 29.85 dB in foggy weather and 30.06 dB in rainy weather, alongside negligible BER values (2.47e − 44 and 1.85e − 46, respectively). PolSK also demonstrated robust performance with QFs exceeding 27 dB in both conditions. OOK–NRZ exhibited the lowest QF (23.85 dB) and higher BER (2.51e − 04) under foggy conditions, indicating its susceptibility to adverse weather effects. The OSNR was similar for all schemes in the 48–50 dB range, which evidenced that UDWDM FSO–FTTx system’s adaptability to noise disruption is unaffected by diverse weather conditions. These results underlined the superior resilience of advanced modulation formats such as PDM–QPSK and PolSK in adverse weather conditions in contrast to conventional OOK–NRZ.

Figures 8(a), 8(b), and 8(c) depicted that the performance comparison of BER, QF, and OSNR against channel spacing for the UDWDM FSO–FTTx system under clear, hazy, foggy, and rainy conditions exhibited significant variations in the modulation techniques. When it comes to the channel spacing of 0.2 nm, PDM–QPSK consistently fared better than alternative methods for the top QF, 30.62 dB in clear weather and 30.56 dB in haze, along with the lowest BER, and 1.73e − 52 in clear weather and 8.22e − 52 in haze, making it the most suitable for high-capacity links at a data rate of 5120 Gbps. PolSK demonstrated strong performance with a QF of 28.62 dB (clear) and 28.56 dB (hazy) while keeping low BER values at 2.98e − 27 and 6.57e − 27, respectively.
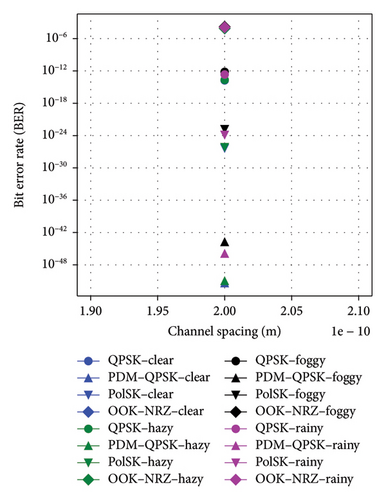
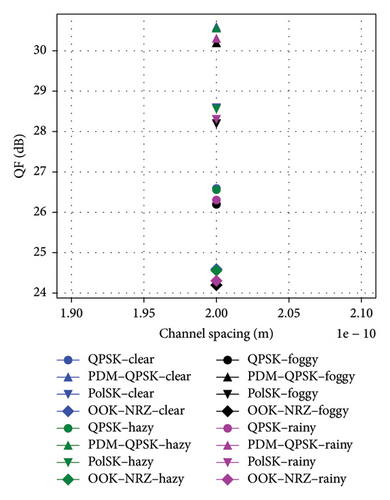
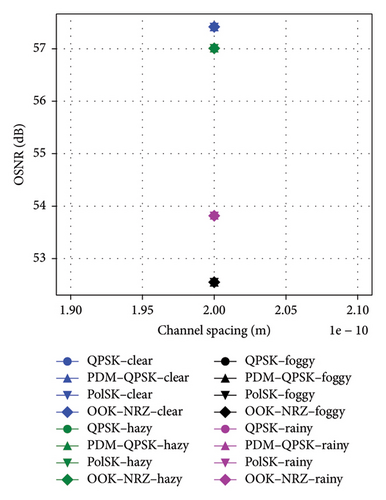
In comparison, the OOK–NRZ has depicted lesser QF values of 24.62 dB in clear weather and 24.56 dB in haze for higher BER values of 7.222e − 05 and 8.00e − 05, respectively; consequently, it may only be appropriate for modest data rates, such as 1280 Gbps. At a narrow 0.2 nm channel spacing, the PDM–QPSK appears to perform better than others do for the highest QF in both foggy (29.85 dB) and rainy (30.06 dB) conditions at the lowest BERs in such conditions, 2.47e − 44 and 1.85e − 46, respectively. PolSK also came out very well with a QF of 27.85 dB for foggy and 28.06 dB for rainy conditions; in contrast, the lowest QF was brought about by OOK–NRZ: 23.85 dB for foggy and 24.06 dB for rainy weather yet continued to be viable for lower data rates such as 1280 Gbps. The results showed that UDWDM FSO–FTTx system levels were combined with advanced modulation formats, such as PDM–QPSK or PolSK, by utilizing the given channel spacing to maintain optimal performance under different atmospheric conditions.
The study’s results given above enable the accurate multiparameter performance predictions and system improvements required to predict the performance parameters of systems subject to diverse weather conditions through the use of ML techniques. This guarantees increased channel awareness and better QoS in a way that successfully alleviates difficulties brought on by unfavorable weather conditions. Thus, building on that basis, the subsequent examination of the use of ML to enhance the predictive model performance for the estimation of different parameters makes use of simulated datasets that consider the system performance as a whole. The study provides evidence of ML’s substantial contribution to the operational efficiency and reliable advancement of UDWDM FSO–FTTx systems. The regression fit plots in Figure 9(a) demonstrated that ELM had achieved the closest alignment between predicted and true QF values, with a near-perfect linear relationship. The result showed the excellent capability of this model in effectively simulating the QF in different scenarios.
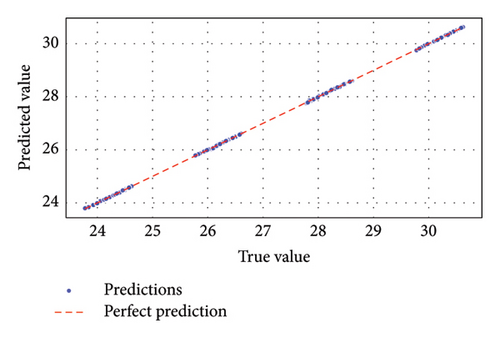
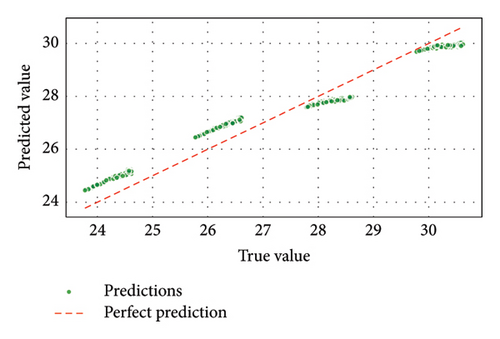
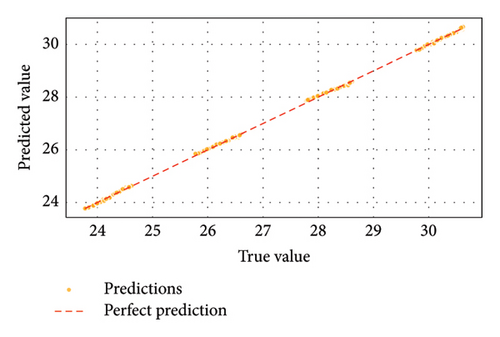
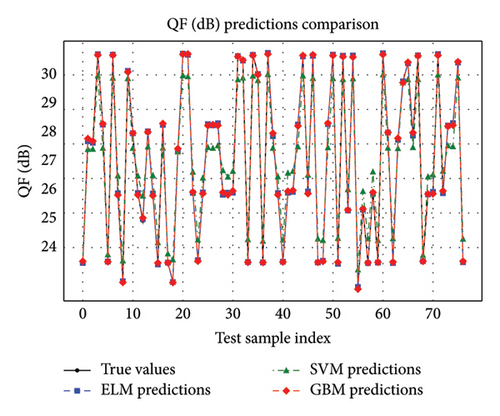
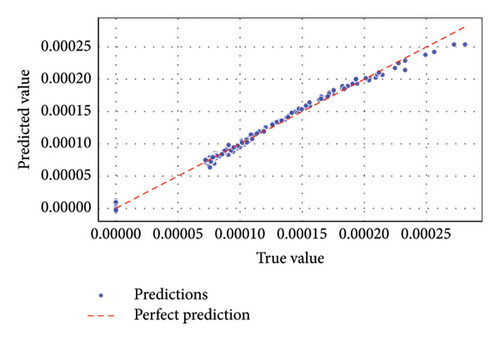
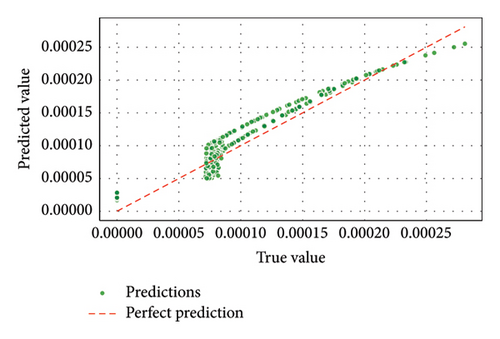
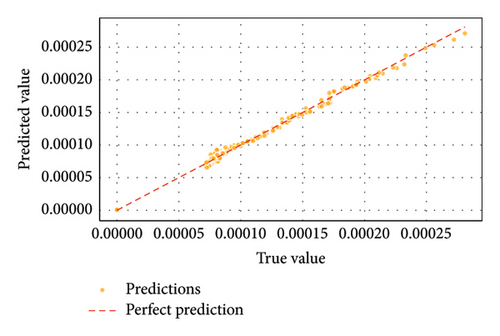
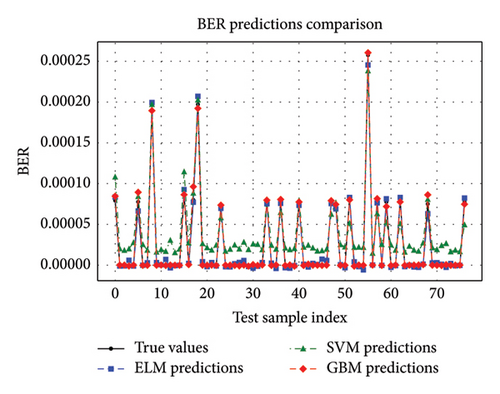
By contrast, GBM in Figure 9(c) is also doing well but slightly deviating from the true values. On the other hand, it is found from Figure 9(b) that the SVM presented a more significant prediction error, showing that their precision is relatively low. Figure 10 further corroborated these findings by illustrating that ELM and GBM predictions closely matched the actual QF values across all data points, outperforming the other model. Figures 11(a), 11(b), 11(c), and 12 revealed that GBM consistently outperformed other models in predicting BER, achieving minimal error and a strong regression fit. The near-linear relationship of the predicted and actual BER values for GBM underlined its robustness in handling this parameter. ELM was the second-best performer, while SVM in Figure 11(b) displayed higher deviations from actual BER values, reflecting reduced accuracy.
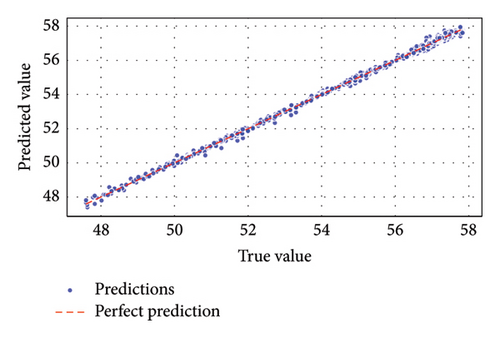
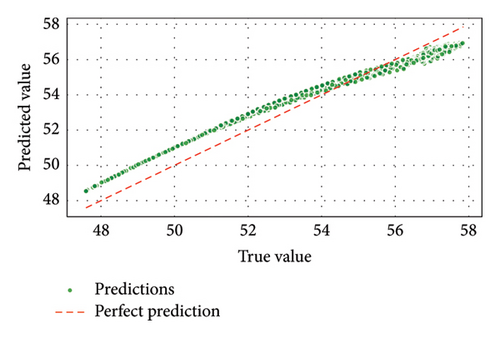
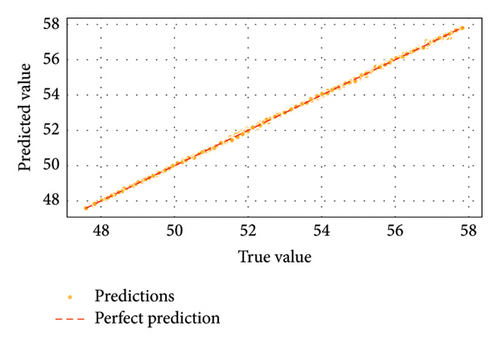
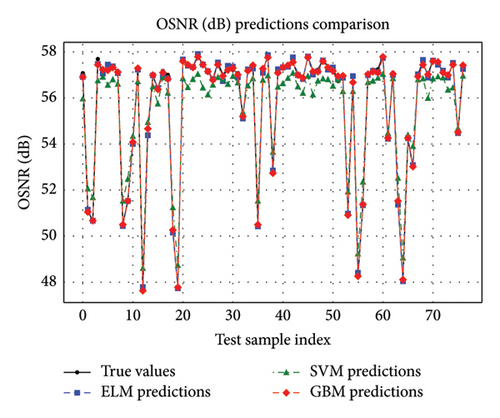
For OSNR predictions, Figures 13 and 14 highlighted GBM’s dominance with precise alignment of predicted versus true values. The regression fit plot for GBM in Figure 13(c) showed minimal residuals, confirming its high accuracy in modeling OSNR. ELM again demonstrated in Figure 13(a) competitive performance but lagged slightly behind GBM. Figure 13(b) depicts SVM struggling to achieve comparable precision, reflecting noticeable prediction errors. Furthermore, supporting evidence is given in Figure 14, indicating that the GBM and ELM predictions closely fitted the true OSNR(dB) values across all data points, while the case was not so with SVM.
Figures 15 and 16 emphasized GBM’s and ELM’s exceptional predictive capability for data rate, achieving near-perfect regression fits with minimal error margins. Figure 15(c) of the result confirmed that GBM is highly effective at capturing complex relationships influencing data rates in FSO–FTTx systems; Figure 15(a)’s result of ELM provided reliable predictions but was less precise than GBM. Figure 15(b) revealed that SVM was less consistent, with more significant deviations from actual data rates. For received power (dBm) prediction, Figures 17(c) and 18 underscored that GBM demonstrated superior performance in predicting received power levels with high accuracy. Its regression fit plot showed a strong correlation between predicted and true values with minimal variance. While Figure 17(a) showed that the result of ELM performed reasonably well, it did not match the precision of GBM. Figures 17(b) and 18 revealed that SVM exhibited significant prediction errors compared to ELM and GBM.
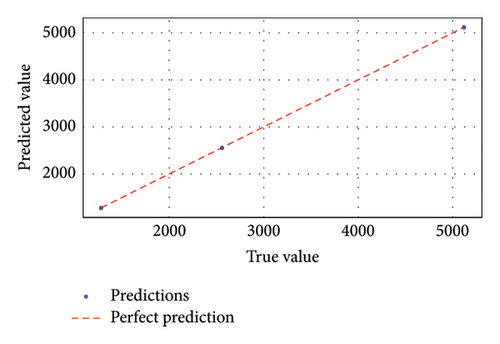
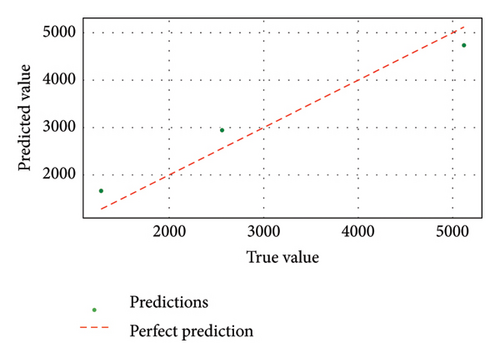
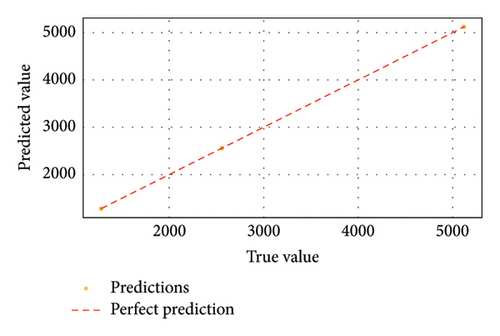
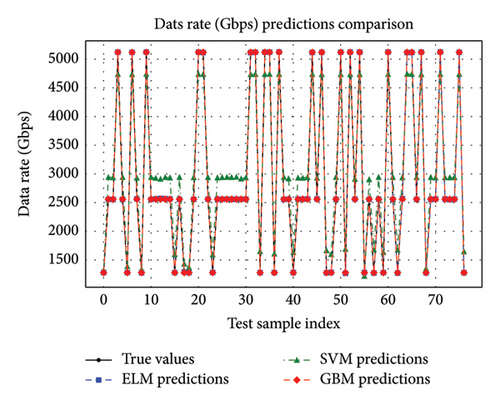
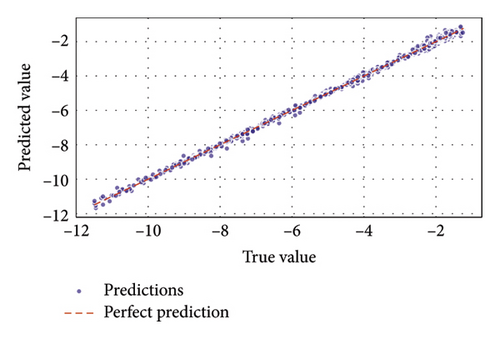
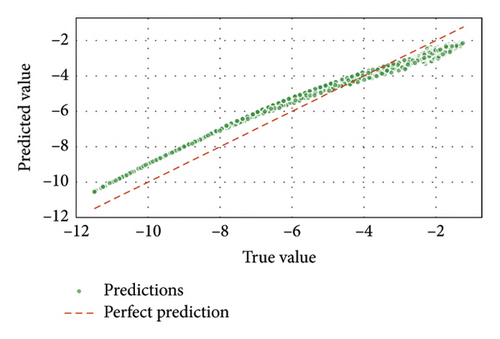
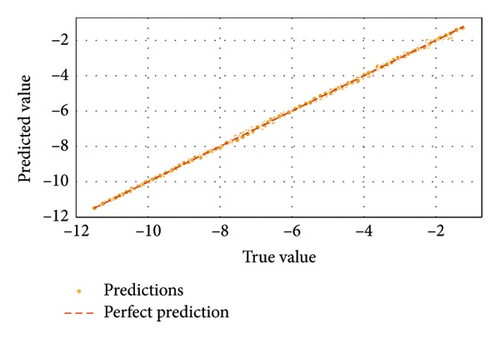
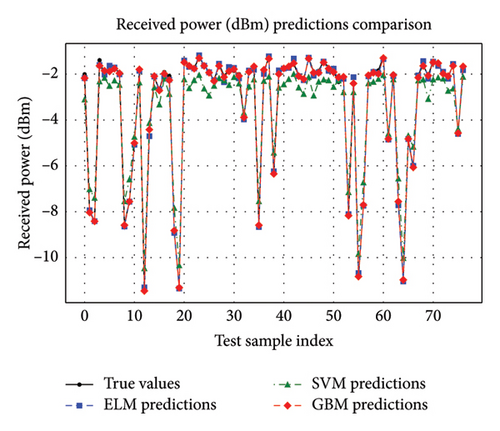
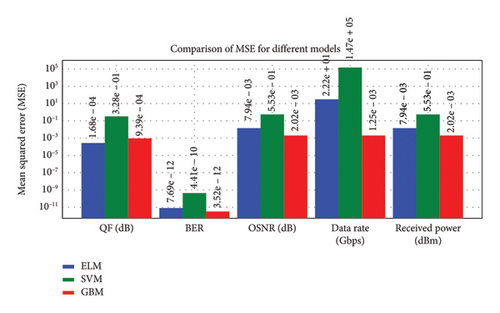
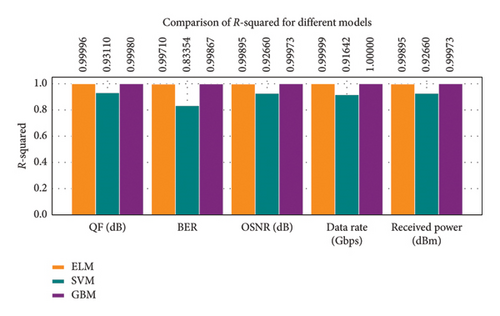
Thus, Figures 9, 10, 11, 12, 13, 14, 15, 16, 17, and 18 showed that across all parameters, QF, BER, OSNR, data rate, and received power, GBM consistently outperformed other ML models by achieving the lowest MSE and highest R-squared values. These results underscored the potential of GBM for predicting performance metrics and optimizing FSO–FTTx systems in various environmental settings because of their capacity to deliver accurate predictions across critical performance metrics. Moreover, the comparative analysis of ML models ELM, SVM, and GBM was conducted using key performance metrics such as MSE and R-squared values across multiple predicted parameters, including QF, BER, OSNR, data rate, and received power. Figures 19 and 20, and Table 5 further supported the findings from Figures 9, 10, 11, 12, 13, 14, 15, 16, 17, and 18 by showing that GBM and ELM have consistently outperformed SVM in terms of accuracy and error minimization, as reflected by their superior R2 values nearing one and significantly lower MSE values.
| Metric | ELM MSE | ELM R2 | SVM MSE | SVM R2 | GBM MSE | GBM R2 |
|---|---|---|---|---|---|---|
| QF (dB) | 1.6785e − 04 | 0.99997 | 3.2810e − 01 | 0.93109 | 9.3905e − 04 | 0.99980 |
| BER | 7.6909e − 12 | 0.99710 | 4.413622e − 10 | 0.83354 | 3.521367e − 12 | 0.99867 |
| OSNR (dB) | 7.9385e − 03 | 0.99895 | 5.526608e − 01 | 0.92660 | 2.020315e − 03 | 0.99973 |
| Data rate (Gbps) | 2.2248e + 01 | 0.99999 | 1.474559e + 05 | 0.91642 | 1.252711e − 03 | 1.00000 |
| Received power (dBm) | 7.9385e − 03 | 0.99895 | 5.526608e − 01 | 0.92660 | 2.020315e − 03 | 0.99973 |
Figures 19 and 20 and Table 5 present the QF prediction analysis of the ML models revealing that ELM had achieved an outstanding MSE of 1.6785e − 04 with an R2 value of 0.999965, whereas GBM had come close with a value of 9.3905e − 04 and an R2 value of 0.999803. In contrast, the SVM model had shown an increased MSE of 3.2810e − 01 and a lower R2 value of 0.9311, indicating less accuracy in prediction for this parameter. In the case of BER, GBM demonstrated the best performance with a very impressive MSE of 3.521367e − 12 and a high R2 value of 0.998672, outperforming ELM, which had recorded an MSE value of 7.6909e − 12 and an R2 value of 0.997099. SVM had lagged significantly behind with an MSE of 4.413622e − 10 and an R2 value of only 0.833542. For OSNR, both ELM and GBM had shown strong predictive capabilities with respective MSE values of 7.9385e − 03 and 2.020315e − 03, alongside high R2 values of 0.998946 and 0.999732, respectively; however, SVM again had underperformed with a considerably higher MSE value of 5.526608e − 01 and a lower R2 score of 0.926604.
When analyzing the data rate, GBM achieved near-perfect results with an MSE as low as 1.252711e − 03 and an ideal R2 value of precisely 1, showcasing its unparalleled precision for this parameter compared to ELM’s already excellent performance with an MSE of 2.2248e + 01 and an R2 score close to perfection at 0.999987. SVM’s performance was also notably weaker here, reflected by its exceedingly high MSE value of 1.474559e + 05 and a relatively low R2 score of just 0.916419.
Lastly, for received power, both ELM and GBM maintained their dominance with identical performances to those observed for QF, BER, OSNR, and data rate: ELM recorded an MSE value of 7.9385e − 03 paired with an R2 score of 0.998946, while GBM achieved a superior MSE value at just 2.020315e − 03 along with a near-perfect R2 score at 0.999732; meanwhile, SVM trailed behind once more with an elevated MSE at approximately 5.526608e − 01 accompanied by a lower predictive accuracy indicated by its corresponding R2 score at only about 0.926604. In conclusion, the results from Figures 19 and 20 and Table 5 conclusively established that both GBM and ELM models are the most effective models among those tested for predicting various optical communication parameters such as QF (dB), BER, OSNR (dB), data (Gbps), and power (dBm). The fact that it yielded near-perfect R2 values and minimum MSE highlighted its suitability in highly accurate and reliable applications. It was far from the high error rates emanating from SVM and lessened the predictive power it had.
4. Discussion
In this study, cutting-edge ML algorithms were applied to estimate the performance of UDWDM FSO–FTTx systems under various weather conditions. A comparative analysis with prior studies, as summarized in Table 6, highlighted significant advancements and contributions of our research regarding system modeling, atmospheric conditions, ML algorithms employed, modeling targets, and modulation schemes. In comparison to previous works such as [4], which utilized RoFSO systems under clear, haze, and rain weather conditions with ML algorithms lsuch as ANN, KNN, and DT targeting SNR and BER metrics using 16-QAM and 32-QAM modulation schemes, the present study extends its scope by incorporating a UDWDM FSO–FTTx model. This model can operate effectively under various weather conditions, including foggy, rainy, hazy, and clear sky environments. Similarly, the study in [6] focused on MDM/FSO systems in rainy weather using KNN for BER prediction. While effective for specific scenarios, it lacks the versatility demonstrated in the current work’s ability to handle multiple adverse weather conditions. This versatility ensures higher reliability in real-world scenarios. Similarly, the authors in [7] employs RoFSO systems under strong turbulence conditions with ANN, GBM, and DT models targeting BER improvements through BPSK modulation. While effective for specific turbulence scenarios, it lacks the broader adaptability of the proposed system. The present work not only addresses BER but also optimizes additional multiple parameters such as OSNR, QF, data rate, and received power in various weather conditions by taking into account a variety of modulation schemes, including OOK–NRZ, QPSK, PDM–QPSK, and PolSK modulation schemes. This multitarget approach ensures comprehensive performance evaluation across diverse operational scenarios.
| Parameter | Reference [4] | Reference [6] | Reference [7] | Reference [8] | Reference [10] | Current study |
|---|---|---|---|---|---|---|
| Model of the system | RoFSO | MDM/FSO | RoFSO | Hybrid FSO/RF links | IsOWC | UDWDM FSO–FTTx |
| Atmospheric turbulence/weather condition | Clear, haze, and rain weather | Rainy | Strong turbulence | Rain and fog | Scintillation & turbulence | Clear, hazy, rainy, and foggy weather |
| ML algorithms | ANN, KNN, and DT | KNN | ANN, GBM, and DT | RF | ANN | ELM, SVM, and GBM |
| Modeling targets | SNR and BER | BER | BER | Link availability, spectral efficiency, and BER | Received power | OSNR, QF, BER, data rate, and received power |
| Modulation schemes | 16-QAM and 32-QAM | OOK–NRZ | BPSK | PPM, PSK, and QAM | 16-QAM | OOK–NRZ, QPSK, PDM–QPSK, and PolSK |
Furthermore, the authors in [8] investigated hybrid FSO/RF links under rain and fog using RF ML models for link availability, spectral efficiency, and BER predictions. While innovative in addressing hybrid link challenges, it does not leverage ultra-dense WDM or address FTTx applications. The present work surpasses this by integrating UDWDM technology into FSO–FTTx systems to enhance spectral efficiency while maintaining robust performance under challenging atmospheric conditions. Lastly, the authors in [10] addressed IsOWC systems with scintillation and turbulence effects using ANN but limited its focus to received power predictions. The current study builds upon this by addressing multiple parameters, such as OSNR, QF, BER, and data rate, in various weather conditions by taking into account a variety of modulation schemes, including OOK–NRZ, QPSK, PDM–QPSK, and PolSK modulation schemes, while ensuring compatibility with ultra-dense WDM configurations.
The comparison shown in Table 7, a comparative evaluation of the achievement in current studies, is a direct consequence of observations framed in Table 6, which compares the proposed work with other studies. This table defines the new contributions, improved methodologies of the current study, and notable improvements over existing research.
| Parameter | Previous studies | Current study | Key improvements |
|---|---|---|---|
| System model | RoFSO, MDM/FSO, hybrid FSO/RF, and IsOWC | UDWDM FSO–FTTx | Combines ultra-dense wavelength division multiplexing with FSO–FTTx for improved scalability and bandwidth efficiency |
| Tested conditions | Limited to specific scenarios | Clear, hazy, rainy, and foggy weather | Evaluates performance over a wider array of atmospheric disturbances for improved robustness in varied environments |
| ML algorithms | Basic algorithms (ANN, KNN, DT, and RF) | ELM, SVM, and GBM | Employs ensemble and kernel-based ML models for improved accuracy in system performance prediction under turbulence |
| Performance metrics | Narrow focus | OSNR, QF, BER, data rate, and received power | Multidimensional analysis for comprehensive system assessment, encompassing both quality and reliability |
| Modulation schemes | Conventional schemes (QAM, BPSK, and OOK–NRZ) | OOK–NRZ, QPSK, PDM–QPSK, and PolSK | Employs polarization division multiplexing (PDM–QPSK) and PolSK for enhanced spectral efficiency and noise resilience |
In conclusion, the proposed UDWDM FSO–FTTx framework offers significant advancements over existing FSO communication systems, and Table 7 provides a detailed comparison of the proposed framework with other studies, which shows that the proposed framework significantly advances existing FSO communication systems by addressing critical scalability, adaptability, and performance analysis limitations. This work introduces a holistic approach, unlike prior studies that focused on narrow metrics such as BER or SNR [4, 6] or limited their evaluations to specific weather conditions such as rain or turbulence [8, 10]. The system achieves unprecedented spectral efficiency and scalability by integrating ultra-dense WDM with FSO–FTTx, a key gap in hybrid FSO/RF and MDM/FSO architectures [4, 7]. Moreover, rigorous testing across different atmospheric conditions, including fog, haze, rain, and clear skies, validates robustness in scenarios where conventional models falter, particularly under foggy environments with severely lower received power [8]. The adoption of ensemble and kernel-based ML models (ELM, SVM, and GBM) outperforms traditional ANN and DT methods [4, 7] in predicting OSNR and QF, enabling real-time adaptive modulation. In addition, the addition of PDM–QPSK and PolSK schemes improves noise resilience and data rates compared to standard QAM/BPSK modulations [6, 10]. This multidimensional optimization of OSNR, BER, and throughput addresses a critical trade-off overlooked in single-metric studies, making the framework a versatile solution for next-generation optical wireless networks.
5. Conclusion
This study comprehensively evaluates UDWDM FSO–FTTx systems under various weather conditions, and it established a rigorous framework for positioning UDWDM FSO–FTTx systems in next-generation networks, considering critical challenges posed by atmospheric turbulence and weather-induced attenuation. Systematic evaluations across clear, hazy, rainy, and foggy conditions demonstrated that polarization-based modulation schemes (PDM–QPSK and PolSK) consistently outperformed conventional formats, achieving superior performance metrics: QF (> 27 dB), OSNR (> 48 dB), and data rates (≥ 2560 Gbps) while maintaining BER below the (10e − 12) threshold. In contrast, OOK–NRZ demonstrated severe degradation under adverse weather conditions, predominantly in fog, where BER > (10e − 5), emphasizing the necessity of advanced modulation for reliable FSO communication.
In addition to these findings, ML algorithms, particularly GB, significantly enhanced predictive accuracy across performance metrics, achieving minimal MSE (< 0.002) and near-perfect R2 values (> 0.998). While ELMs approached GB’s accuracy, SVM lagged in overall performance. The results showed that using ML algorithms greatly enhanced the prediction capability for UDWDM FSO–FTTx systems under different weather conditions while promoting channel awareness and enhanced QoS. These ML–driven insights enable real-time channel dynamics forecasting, which could lay the groundwork for adaptive strategies, such as SVM/ELM–guided microelectromechanical systems (MEMS) beam steering to counteract beam wander while preserving ultra-dense WDM channel spacing. Furthermore, GB’s ultra-low BER predictions could facilitate autonomous hybrid RF/FSO switching to maintain QoS during extreme weather events.
In light of these developments, the proposed system aligns with 6G efficiency targets through ultra-dense spectral alignment and ML–driven adaptability, offering a scalable optical backbone for emerging applications such as quantum key distribution (QKD)–compliant OSNR levels for quantum-secure transmission. The generated multiparameter datasets provide foundational frameworks for training deep reinforcement learning (DRL) agents to autonomously control polarization switching, modulation reconfiguration, and power optimization in response to real-time weather fluctuations. Future work should focus on experimental validation of ML–guided adaptive systems in turbulent urban settings and expansion into terahertz capacity regimes. This study positions ML–enhanced WDM FSO–FTTx as a transformative, intelligently adaptive solution for next-generation networks capable of sustaining robust performance under dynamic atmospheric conditions.
Conflicts of Interest
The authors declare no conflicts of interest.
Funding
There is no any research fund in this study.
Open Research
Data Availability Statement
The data supporting the findings of this study are available from the corresponding author upon reasonable request.


