Identification of Hazardous Substances in Mail by Terahertz Radiation Based on Voigt and AsLS Fitting Spectral Reconstruction
Abstract
With the development of e-commerce, noninvasive mail inspection is becoming particularly prominent. Terahertz waves have fingerprint spectrum characteristics and can penetrate nonpolar materials. Terahertz waves are ideal for the nondestructive identification of harmful substances hidden in the mail. However, the gaps between mail packages and samples affect the accuracy of the inspection. In this study, the influence of irregular gaps was analyzed using a model sample under envelope occlusion. A spectral reconstruction method based on Voigt and asymmetric least squares (AsLS) fitting is proposed. Principal component analysis (PCA) results showed that the reconstructed spectral data were easier to identify and the root mean square error (RMSE) of quantitative analysis was the smallest. PCA–support vector machine (SVM) and convolutional neural network (CNN) classification models were used to verify the effectiveness of this method.
1. Introduction
With the rapid development of e-commerce, the security of mail is particularly important. Mail has become an important means for criminals to transport hazardous substances, such as illicit drugs and explosives. Moreover, with the advancement of biological antiterrorism measures, the detection of harmful biological factors hidden in mail has become an urgent problem. The key to solving these problems is to establish accurate and convenient detection technology and methods. Terahertz (THz) technology, characterized by its unique properties, is expected to be used in the security detection of mail.
THz waves are typically defined as those with frequencies ranging from 0.1 to 10 THz. They have drawn significant attention as one of the most notable new technological advancements [1]. One of the most important features of THz technology is its ability to be transmitted through nonpolar substances, such as paper, plastics, textiles, and other packaging materials. This allows hazardous substances hidden in mail packages to be “seen” by THz instruments [2–4]. Additionally, explosives, illicit drugs, and other hazardous substances exhibit unique absorption spectra (termed the “fingerprint spectrum”) in the THz band, which can be utilized to identify these substances [5–7]. The photon energy of THz waves is low, and thus, they will not cause harmful photoionization to the sample [8]. These characteristics make the THz technology ideal for conducting nondestructive detection and identifying hazardous substances hidden in the mail [9, 10].
However, most of these studies were conducted under ideal conditions. In actual detection, the THz spectra often contain significant fluctuations and interference peaks. This is largely because of the gaps between the sample and the envelope or other packaging materials. THz radiation undergoes multiple reflections between the sample and the envelope, complicating the transmission spectrum immensely. Conventional data processing algorithms are unable to surmount these issues. The asymmetric least squares (AsLS) method is an effective baseline estimation method. It combines a smoother with an asymmetric weighting of the smooth trend deviation [11]. Voigt fitting, based on the convolution of Gaussian and Lorentz functions, can better characterize the THz absorption peaks.
In this study, to filter out interference peaks caused by the envelope, a spectral reconstruction method based on AsLS and Voigt fitting was proposed. The AsLS method was used for baseline fitting, and Voigt fitting was performed on the absorption peaks. The two fitting results were added to reconstruct the THz absorption spectrum. Principal component analysis (PCA) was performed on the THz spectrum before and after fitting. Subsequently, models were established using the support vector machine (SVM) and convolutional neural network (CNN) methods for classification and recognition. The reconstructed THz absorption spectra could filter out the interference and false absorption peaks, thereby enhancing the recognition accuracy of the samples.
2. Experiment and Methods
2.1. Experimental Apparatus and Sample Preparation
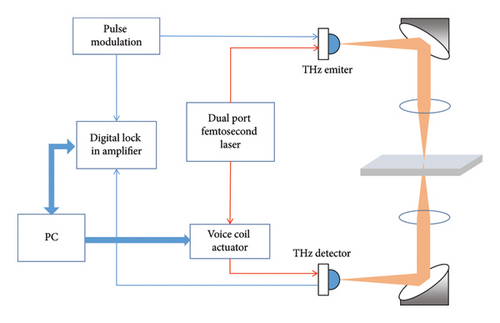
For practicality, a THz time-domain spectroscopy system (THz-TDS) was used in the experiments. As shown in Figure 1, its optical path was an all-fiber interconnection. The system has good stability and was easy to debug and replace components. A dual-port femtosecond laser with dispersion pre-compensation was used as the light source. This helped reduce the dispersion caused by the fiber link. The two ports of the laser were the pump light and the probe light respectively. The THz pulse was generated by irradiating the LT-GaAs photoconductive antenna with the pump light. After being focused by the off-axis mirror, it passed through the sample and then converged on the THz detector, which was triggered by the probe beam to generate a THz electric field [12, 13].
Due to the strict control of hazardous substances like drugs and explosives, two antibiotics, nalidixic acid and mitomycin, were chosen as simulants. These antibiotics show characteristic absorption in the THz band. They were mixed with high-density polyethylene (HDPE) powders. Then the mixtures were compressed into tablets with diameters of 13 mm under a pressure of 20 MPa [15]. In total, 20 samples of different concentrations were made.
2.2. Influence of Obstructions
The model of THz radiation transmitted through a sample is shown in Figure 2. In this model, the lighter color represents the sample, while the darker color represents the envelope package. The THz wave is incident perpendicularly. The signal received by the THz detection antenna is composed of transmission spectra and multiple reflection spectra, which are referred to as Fabry–Perot (FP) echoes [16]. Therefore, the THz spectrum of the sample can be expressed as .
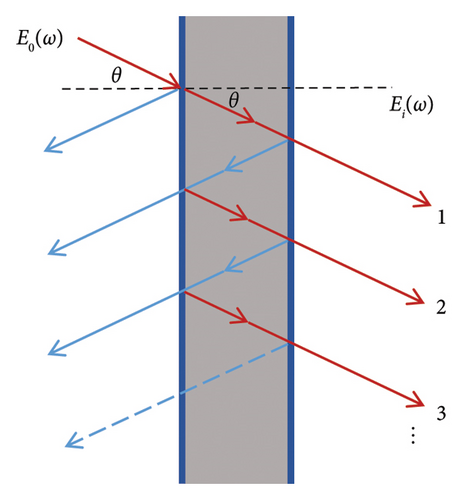
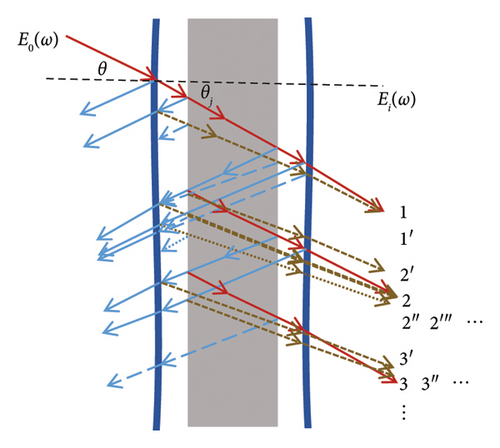
Figure 2(a) depicts the ideal state. The envelope is assumed to be transparent and have no impact on the sample’s absorption spectra. However, in reality, there are gaps between the envelope and the sample, as shown in Figure 2(b). Due to these gaps, THz radiation causes multiple reflections between the sample and the envelope, increasing the number of FP-echoes. The gaps are typically irregular. The THz wave passing through the envelope and the sample is the horizontal component of the incident wave. Moreover, the optical paths of echoes with different refraction angles vary. Because of the influence of these irregular gaps, the echo pulse will aggravate the fluctuations of the spectrum and even produce false absorption peaks.
2.3. AsLS Method
2.4. Voigt Fitting
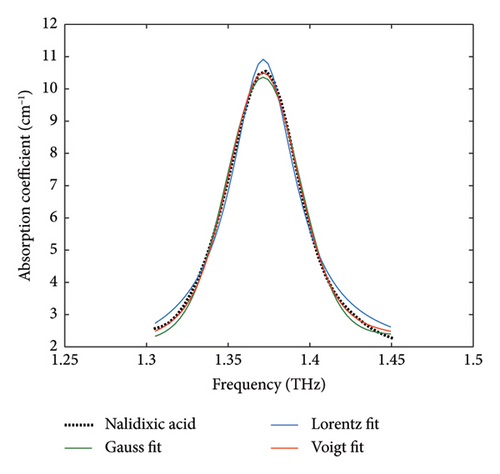
The absorption peak of nalidixic acid at 1.37 THz was fitted using Gaussian, Lorentz, and Voigt functions. The fitting results are presented in Figure 3. As can be seen, the Voigt function achieved a better fitting effect compared to the other two functions [15].
2.5. Model Establishment
For classification purposes, the most commonly used methods include SVM, random forest (RF), back propagation neural network (BPNN), and CNN. All of these methods can achieve high accuracy in specific scenarios [22, 23]. The identification model for the antibiotics was established using SVM and CNN. The combination of PCA and the SVM (PCA-SVM) is an improvement over the SVM, which is the most widely used classification method in THz spectral analysis [24, 25]. After PCA dimension reduction, the sample data were utilized for SVM training. This approach reduces the complexity of the SVM. CNN, as one of the most widely used deep learning network models, has been used as a classification method of THz technology in recent years [22, 26]. With this method, the material recognition can be carried out without preprocessing the spectral data, thus the complex feature extraction process required by the traditional algorithm is bypassed [26].
3. Results and Discussion
Two antibiotics, nalidixic acid and mitomycin, which have characteristic absorption peaks in the THz band, were selected. These were placed in Express Mail Service (EMS) envelopes as samples. First, 100 spectra were obtained consecutively in a dry environment. Subsequently, the average value was calculated to filter out random noise.
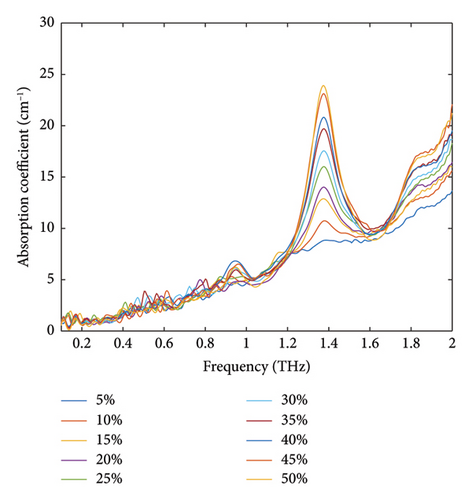
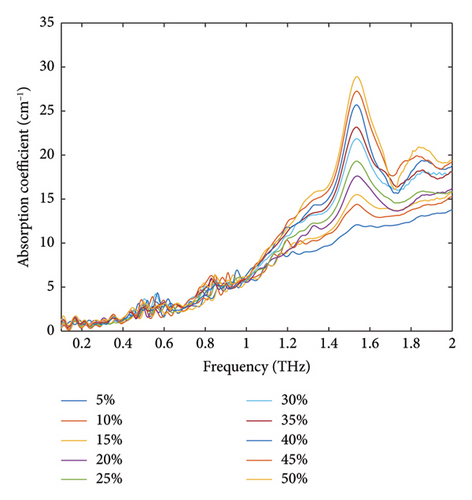
Figure 4 shows the absorption spectra of nalidixic acid (Figure 4(a)) and mitomycin (Figure 4(b)) with different contents, covered by the EMS envelope, in the 0.1–2.0 THz band. The characteristic absorption peaks of the sample remained, yet they were affected by the envelope, causing the spectral baseline to rise. Due to the limitations of the dynamic range, the effective bandwidth became narrow. Impacted by the irregular gaps between the envelope and the sample, significant fluctuations appeared in the low-frequency part of the spectrum, and many interference peaks emerged. Moreover, the positions of the interference peaks in each measurement were not fixed, which could affect the accuracy of mail recognition.
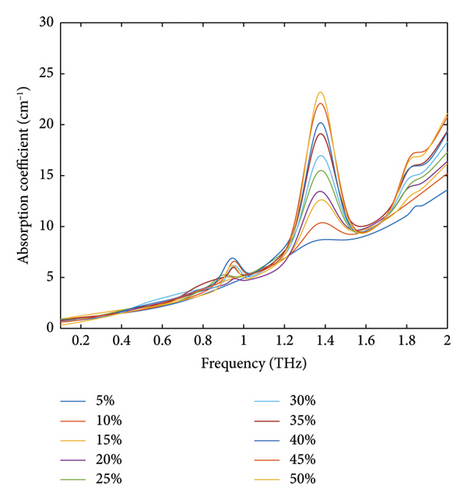
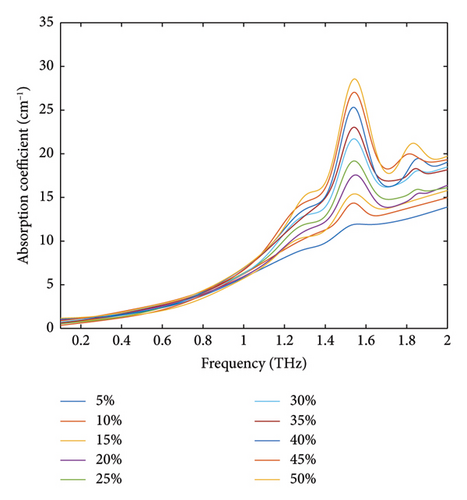
To reduce the influence of the irregular gaps between the sample and the envelope on the THz absorption spectrum, we employed the proposed spectral reconstruction method based on AsLS and Voigt fitting. Figure 5 depicts the reconstructed spectra of samples with different contents of nalidixic acid and mitomycin. Samples with varying contents exhibit the same absorption peaks as those in Figure 4. There was positive correlation between the content of samples and the absorbance information such as the peak height and full width at half maximum (FWHM), which conforms to Lambert Beer’s law.
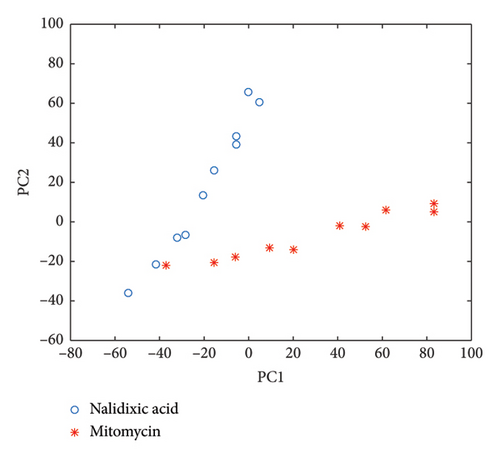
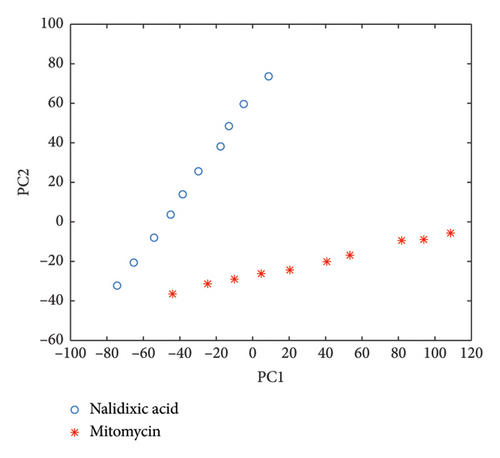
PCA was performed on the two antibiotics with different contents. When covered by envelopes, the contribution rate of the first principal component (PC1) was only 75%, while the sum of the first two principal components (PC1 and PC2) exceeded 90%. After waveform reconstruction using Voigt and AsLS fitting, the sum of PC1 and PC2 of the two antibiotics was greater than 99%. Figure 6 shows a two-dimensional score plot for the PCA of the two antibiotics. Because the two antibiotics had strong absorption peaks in the 0.1–2.0 THz band, they could still be differentiated even when covered by envelopes. However, as shown in Figure 6(a), the content distribution did not conform to the Beer–Lambert law. In contrast, as shown in Figure 6(b), the content distribution of the two antibiotics after waveform reconstruction did obey the Beer–Lambert law. If the characteristic peaks were weak or far apart, they would overlap due to the influence of envelopes.
In order to evaluate the performance of the spectral reconstruction method, the absorption spectra filtered by Savitzky-Golay (S-G) smoothing algorithm with windows size of 20 and 40 were compared. When the window size was 20, only a small amount of noise was filtered. When the window size increased to 40, the noise filtering effect improved, but distortion occurred, which affected the accuracy of qualitative and quantitative analysis of substances. Table 1 presents the root mean square error (RMSE) of the principal component regression analysis (PCR) for the absorption spectra of nalidixic acid and mitomycin under different conditions. The RMSE of the absorption spectra of the two samples placed in the EMS envelope was 1.14 and 1.26 respectively. After filtering with the S-G smoothing algorithm using window sizes of 20 and 40, the RMSE of the spectra were 1.1, 1.09 and 0.89, 0.87 respectively. The RMSE of the S-G smoothing method was smaller than that before filtering, but the change was not significant, and it decreased with the increase of the window size. The RMSE of the spectral reconstruction method proposed in this paper was the smallest, with values of 0.31 and 0.28, respectively, which was close to the situation without EMS packages.
| Methods | No filtering | 20 pts SG smooth | 40 pts SG smooth | Spectral reconstruction | Without EMS packages |
|---|---|---|---|---|---|
| Nalidixic acid | 1.14 | 1.1 | 0.89 | 0.31 | 0.11 |
| Mitomycin | 1.26 | 1.09 | 0.87 | 0.28 | 0.1 |
Considered all samples of the two antibiotics in different proportions as 20 different samples. Different classification methods were used to identify different types and concentrations of antibiotics. The data were divided into two groups: the THz absorption spectra of the samples when covered by envelopes and the absorption spectra after waveform reconstruction. Each group of data was obtained from 20 samples tested 10 times. Among them, 140 samples are used as the training set, and the remaining 60 samples were used as the test set.
PCA-SVM analysis is a learning algorithm that can classify high-dimensional samples. First, PCA was employed to reduce the dimensions of the sample data, and then the data were used for SVM training and validation. Grid search with cross-validation is utilized to jointly optimize the parameters of PCA and SVM. By optimizing the hyper-parameters C and g, overfitting of SVM can be avoided. The regularization parameter C, serving as a penalty factor, balances the contradiction between the complexity of the model and the training error. The parameter g represents the degree of influence of samples on the model. Through the grid-search method, the optimal values obtained.
A one-dimensional CNN (1D-CNN) was also used for classification. It mainly consists of two convolutional modules, each of which includes a convolutional layer and a max pooling layer. Finally, we use a fully connected layer activated by “softmax” to output the classification results. The initial learning rate of the CNN is 0.01, and the number of epochs of the CNN model is 60. The Adam optimizer is adopted. By utilizing the firs moment and second moment estimates of the gradient, it dynamically adjusts the learning rate of each parameter. In the event that the model gets trapped in a local minimum, a relatively large update magnitude can assist it in escaping the local optimum.
As presented in Table 2, when using the SVM, the classification accuracy of the spectral data following waveform reconstruction attained 90.74%. This value is 7% points higher than that of the nonreconstructed data. Likewise, when employing the 1D-CNN) model, the discrimination accuracy of the waveform reconstructed data was enhanced to 98.45%, representing an increase of nearly 10% points.
| Classification algorithm | Accuracy under envelope occlusion (%) | Accuracy after spectral reconstruction (%) |
|---|---|---|
| PCA-SVM | 83.33 | 90.74 |
| 1D CNN | 89.13 | 98.45 |
4. Conclusion
With the rapid development of e-commerce, the security of mail is particularly important. THz-TDS technology, with its unique characteristics, has the potential for rapid and convenient mail identification. Many scientific research institutions have studied drugs and explosives under different packages and covers to analyze the feasibility of the detection of hidden hazardous substances. During the detection process, due to the reflection and scattering of THz radiation caused by the irregular gaps between a sample and a parcel, the noise and interference increase significantly. This reduced the recognition accuracy. To address this issue, a spectral reconstruction method based on Voigt and AsLS fitting was proposed. This method can reconstruct the absorption peak to the greatest extent and reduce the spectral fluctuations and interference. The results of PCA analysis indicated that the reconstructed spectral data were easier to identify. The RMSE of quantitative analysis was minimized, and the content distribution obeyed the Beer–Lambert law. Two intelligent algorithms were employed to classify the antibiotic samples before and after spectral reconstruction. After spectral reconstruction, the recognition accuracy of PCA-SVM increased by 7%, and that of 1D-CNN improved to 98.45%. This fully demonstrated the effectiveness of the spectral reconstruction in reducing interference in mail detection.
In this study, while the spectral reconstruction method has attained some results, it still has several limitations. First, during the spectral fitting process, smaller characteristic absorption peaks were prone to being misidentified as noise. This can lead to the loss of crucial information, thus influencing the accurate analysis of sample components. Second, complex samples possess multiple overlapping characteristic absorption peaks, which raises the fitting error. Moreover, due to the constraint of THz radiation power, the thickness of the mail being detected is restricted. Subsequent research will concentrate on optimizing spectral fitting algorithms to improve the capacity to identify and fit small characteristic absorption peaks. Concurrently, efforts will be actively made to seek breakthroughs in THz technology. High power and a high signal-to-noise ratio are the cornerstones of THz technology for nondestructive testing.
Conflicts of Interest
The authors declare no conflicts of interest.
Funding
This study was funded by the National Key Research and Development Program of China: 2022YFC2302700, Science and Technology Planning Project of Guangdong Province: 2021A1515220084, 2022B1111020001, Handan Science and Technology Research and Development Plan: 23422901083, 21422901176, 23422402150ZC.
Open Research
Data Availability Statement
The data that support the findings of this study are available from the corresponding authors upon reasonable request.


