Two-Dimensional Imaging of the Ionospheric Vertical Total Electron Content Over East Africa
Abstract
Total electron content (TEC) is a crucial parameter for monitoring space weather effects, typically obtained from a network of Global Navigation Satellite System (GNSS) receivers. However, the uneven distribution of the available GNSS receivers in East Africa results in limited TEC data coverage. To address this challenge, a novel hybrid approach was introduced that combined the finite element method (FEM) with the ensemble Kalman filter (EnKF) technique to construct detailed vertical total electron content (VTEC) maps from limited observations. This innovative method enhanced the spatial and temporal resolution of TEC maps, offering a significant improvement over existing methods by capturing local VTEC variations with higher precision. The study investigated VTEC characteristics over East Africa during high (2014) and low (2018) solar activity years, revealing notable diurnal and seasonal VTEC variations, with peak values during equinoxes and significant disruptions during geomagnetic storms. The developed VTEC maps were validated against GNSS receiver data, showing a strong correlation (0.98–0.99) with actual measurements. This suggested that the FEM-EnKF approach provides a reliable and accurate tool for estimating VTEC over the East African region, particularly in areas with sparse data coverage, thereby supporting global navigation and space weather monitoring applications.
1. Introduction
The ionosphere, spanning 60–1000 km above Earth’s surface, significantly influences the propagation of radio signals in satellite communication and navigation systems [1–3]. Its ionized particles enable the reflection and refraction of signals, facilitating over-the-horizon communication and extending the reach of radio waves. However, the ionosphere introduces challenges such as signal delays and dispersions, impacting the precision of Global Navigation Satellite Systems (GNSS) like Global Positioning Systems (GPS). GNSS heavily relies on satellite-transmitted signals for accurate positioning, making it crucial to account for ionospheric effects. The ionosphere, despite its advantages, was subject to constant variations driven by space weather phenomena like solar flares, geomagnetic storms, and ionospheric scintillation. These fluctuations posed a significant risk to satellite systems, making it crucial to monitor and understand these variations thoroughly.
Total electron content (TEC) is an essential parameter for monitoring ionospheric variations. TEC quantifies the electron density throughout the ionosphere by measuring the total number of electrons in a unit cross-sectional area from a receiver at the Earth’s surface to a satellite transmitter at the ionosphere’s top. Due to the path’s geometry, TEC varies with the elevation angle of observation. To standardize this measurement, TEC is often converted into vertical total electron content (VTEC), which represents the electron content in a vertical column directly above a specific point on Earth. This conversion allows for a consistent frame of reference by neutralizing path-dependent effects and focusing solely on the ionospheric electron content directly overhead [4].
The VTEC data used in this research which are basically obtained from low-cost dual-frequency GNSS receivers are essential for applications like aviation, navigation, and communication. However, current methods for obtaining VTEC data, primarily through a network of GNSS receivers, have significant limitations. The uneven distribution of GPS receivers in East Africa results in spatial and temporal gaps in VTEC data, impacting real-time ionospheric information. Additionally, the widely used global ionospheric maps (GIMs) offer a low spatial and temporal resolution (2.5° × 5° and 1 h), which posed challenges in capturing local variations and rapid changes in VTEC, particularly in regions like East Africa [5–8]. Previous studies have utilized models like empirical orthogonal function (EOF), artificial neural network (ANN), and spherical harmonic mapping techniques such as SSM-T1 for calculating TEC, though these models often face challenges in capturing variations, particularly in regions with sparse data [9, 10].
Efforts to overcome these limitations include generating regional VTEC maps using methods like spherical cap harmonic analysis (SCHA) and Bayesian filtering. While SCHA improved precision in specific regions, challenges persisted in addressing local variations. Bayesian filtering, incorporating measurements from various GNSS receivers, enhances VTEC map accuracy by considering spatial and temporal correlations. However, studies using this method highlighted the importance of continuous refinement and alternative approaches [10–17].
Few VTEC maps have been constructed in the East African region, with some utilizing inverse distance weighted interpolation [18] and Kriging methods [19]. These approaches, while revealing ionospheric characteristics, had limitations such as reduced spatial resolution and increased processing time [20]. Therefore, an alternative method balancing accuracy and computational efficiency is needed for high-resolution ionospheric VTEC maps, especially for applications requiring up-to-date information.
Recent studies continue to explore ionospheric phenomena with advanced techniques and broader datasets. For instance, Ogwala et al. [21] provided an updated assessment of VTEC variations across equatorial and low-latitude regions, comparing multiple ionospheric models like NeQuick-2, IRI-2016, and IRI-2020. Their findings underscored the ongoing need for model refinement, especially during the transition between solar cycles.
This study introduced a novel approach to constructing two-dimensional VTEC maps over East Africa using the finite element method (FEM) combined with the ensemble Kalman filter (EnKF). This hybrid method addressed the limitations of existing methods by offering higher spatial and temporal resolution, improving the accuracy of VTEC maps. The FEM allowed for a detailed discretization of the ionospheric region, capturing local variations more effectively. The EnKF technique, by integrating prior information and running multiple filters in parallel, enhanced the robustness and reliability of the VTEC estimates. This method ensured that the VTEC maps provided a precise and detailed representation of the ionosphere, supporting applications that relied on accurate and uninterrupted ionospheric information.
2. Data and Methods
2.1. Data Sources and Processing
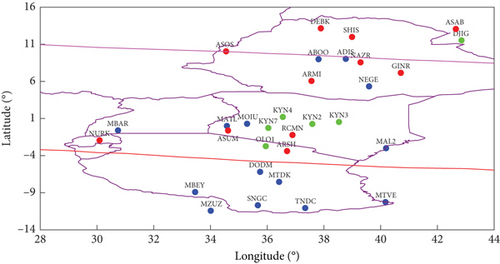
The study utilized GNSS data obtained from a network of 31 receivers in East Africa for the years 2014 and 2018, sourced from the Crustal Dynamics Data Information System (CDDIS) website.1 The selection of these years was based on distinct solar activity profiles, with 2014 representing high solar activity (HSA) and 2018 characterized by low solar activity (LSA). The aim was to investigate ionospheric behavior under different solar conditions, contributing to a comprehensive understanding. The ground receiver locations, shown in Figure 1 and Table 1, were marked based on data availability in 2014 and 2018. Additionally, the disturbance storm time (Dst) index data was retrieved from the OMNIWeb Data Explorer website.2 The TEC data for GIMs were obtained from the Center for Orbit Determination in Europe (CODE) website,3 using a 15th-order spherical harmonic function. These maps had a temporal resolution of 1 h and a spatial resolution of 2.5° × 5°. The CODE GIM transformed slant total electron content (STEC) to VTEC, assuming a thin-shell height at 450 km with an elevation cut-off angle of 10° [22]. This height is applicable to the F2 region of the ionosphere, which is the highest electron density region and typically ranges from about 250 to 450 km above the Earth’s surface [23]. The daily final products of global VTEC data from CODE GIM were accessed and inferred to the regional scale (for the East African region), specifically within latitudes −14° to 16° N and longitudes 28°–44° E [24]. The study also utilized VTEC data from International Reference Ionosphere (IRI), specifically the IRI-2020 model, following the approach applied by Andima et al. [9]. This data was accessed via the Community Coordinated Modeling Center (CCMC) Instant Run System.4 Accessing the IRI VTEC data involved navigating to the provided link using a web browser. Specific parameters, including the IRI version, geographical location, date, and time, were input into the graphical user interface. Once these parameters were provided, the request for the IRI VTEC data was submitted, triggering the system to process the request. Subsequently, the requested data was made available for download in various file formats such as txt or CSV, allowing for utilization.
| Geographic | Quasidipole/magnetic | Date availability | |||||
|---|---|---|---|---|---|---|---|
| Station names, country | Station code | Long (°) E | Lat (°) N | Long (°) E | Lat (°) N | 2014 | 2018 |
| Abobo, Ethiopia | ABOO | 37.81 | 8.99 | 111.51 | 0.78 | ✓ | ✓ |
| Addis Ababa, Ethiopia | ADIS | 38.77 | 9.03 | 112.43 | 0.95 | ✓ | ✓ |
| Dodoma, Tanzania | DODM | 35.75 | −6.19 | 109.22 | −16.21 | ✓ | ✓ |
| Malindi, Kenya | MAL2 | 40.19 | −3.00 | 113.64 | −12.16 | ✓ | ✓ |
| Matola, Tanzania | MATL | 34.58 | −9.59 | 107.73 | −19.95 | ✓ | ✓ |
| Mbarara, Uganda | MBAR | 30.74 | −0.60 | 104.80 | −10.89 | ✓ | ✓ |
| Mbeya, Tanzania | MBEY | 33.46 | −8.91 | 106.76 | −19.39 | ✓ | ✓ |
| Moi University, Kenya | MOIU | 35.29 | 0.29 | 109.15 | −9.24 | ✓ | ✓ |
| Matadek, Tanzania | MTDK | 36.42 | −7.54 | 109.71 | −17.55 | ✓ | ✓ |
| Mt. Mererani, Tanzania | MTVE | 40.17 | −10.26 | 112.89 | −19.96 | ✓ | ✓ |
| Mzuzu, Malawi | MZUZ | 34.01 | −11.43 | 106.92 | −21.92 | ✓ | ✓ |
| Negēle, Ethiopia | NEGE | 39.59 | 5.33 | 113.27 | −3.06 | ✓ | ✓ |
| Sanane Ngc, Tanzania | SNGC | 35.67 | −10.69 | 108.60 | −20.95 | ✓ | ✓ |
| Tandil, Tanzania | TNDC | 37.34 | −11.06 | 110.12 | −21.13 | ✓ | ✓ |
| Djibouti, Djibouti | DJIG | 42.85 | 11.54 | 116.35 | 4.46 | — | ✓ |
| Kyambo, Kenya | KYN2 | 37.59 | 0.27 | 111.42 | −8.74 | — | ✓ |
| Kianyangi, Kenya | KYN3 | 38.53 | 0.53 | 112.31 | −8.31 | — | ✓ |
| Kitale, Kenya | KYN4 | 36.55 | 1.21 | 110.46 | −7.85 | — | ✓ |
| Kilifi, Kenya | KYN7 | 36.04 | −0.27 | 109.94 | −9.56 | — | ✓ |
| Olori, Tanzania | OLO1 | 35.95 | −2.73 | 109.76 | −12.26 | — | ✓ |
| Armilla, Ethiopia | ARMI | 37.56 | 6.06 | 111.33 | −2.53 | ✓ | — |
| Arusha, Tanzania | ARSH | 36.70 | −3.39 | 110.33 | −13.06 | ✓ | — |
| Asmara, Eritrea | ASAB | 42.65 | 13.06 | 116.05 | 5.93 | ✓ | — |
| Asosa, Ethiopia | ASOS | 34.55 | 10.05 | 108.35 | 1.50 | ✓ | — |
| Assumption, Kenya | ASUM | 34.62 | −0.62 | 108.49 | −10.34 | ✓ | — |
| Debark, Ethiopia | DEBK | 37.89 | 13.15 | 111.44 | 5.44 | ✓ | — |
| Ginir, Ethiopia | GINR | 40.71 | 7.15 | 114.32 | −0.88 | ✓ | — |
| Nazaré, Ethiopia | NAZR | 39.29 | 8.57 | 112.94 | 0.51 | ✓ | — |
| Nurka, Rwanda | NURK | 30.09 | −1.95 | 104.13 | −12.45 | ✓ | — |
| Ruiru, Kenya | RCMN | 36.89 | −1.22 | 110.62 | −10.67 | ✓ | — |
| Shigatse, Ethiopia | SHIS | 38.99 | 11.99 | 112.54 | 4.29 | ✓ | — |
RE represents the Earth’s radius in kilometers, α represents the elevation angle, and h represents the ionospheric height (assumed to be 350 km [29]).
2.2. Methods
2.2.1. Characterization of VTEC
In this study, VTEC characterization in the low-latitude East African region was conducted, utilizing data from the stations ADIS, MAL2, ABOO, MTDK, SNGC, NAZR, MBAR, DJIG, and TNDC. The analysis focused on diurnal and seasonal, as well as the investigation of VTEC behavior during geomagnetic storms. The VTEC data for each station were binned in 20-min intervals to detect changes within a day. To study diurnal variations, the mean VTEC for each bin was plotted against time (UT) for 24 h on a quiet day of year (DOY). The seasonal fluctuations were investigated by analyzing monthly average VTEC data for each bin during the March equinox, June solstice, September equinox, and December solstice from stations ABOO, MBAR, and MTDK. The findings were then presented on a bar graph. The impact of geomagnetic storms on VTEC in the East African equatorial region was investigated using data from GPS stations ABOO and DJIG, located at the dip equator (equatorial ionization anomaly (EIA) trough region), and MAL2, situated near the southern EIA crest region. According to [30], the minimum value of Dst index is used as a criterion to classify the intensities of magnetic storms. They categorized geomagnetic storms as minor (−50 ≤ Dst ≤ −30 nT), moderate (−100 ≤ Dst ≤ −50 nT), strong (−250 ≤ Dst ≤ −100 nT), and severe (Dst ≤ −250 nT). According to the National Oceanic and Atmospheric Administration (NOAA) scale, the geomagnetic storm is classified into five classes, namely, G1 (Kp = 5), G2 (Kp = 6), G3 (Kp = 7), G4 (Kp = 8), and G5 (Kp = 9) (https://www.swpc.noaa.gov/). For this study, strong storms were chosen to comprehend the ionospheric response in the East African equatorial region to geomagnetic disturbances. The analysis focused on a 3-day period encompassing the strong storm day to observe short-term effects on VTEC. Graphs were generated to illustrate the Dst index, storm time VTEC (VTEC during stormy periods), and quiet time VTEC (VTEC data on the quietest day before the storm onset), providing insights into how the ionosphere responds to geomagnetic disturbances during strong storms in 2014 and 2018. During a geomagnetic storm, positive (VTEC increase), negative (VTEC decrease), and nonsignificant ionospheric responses can be observed. The VTEC increase results from augmented ionization in the ionospheric E and F layers due to heightened solar and geomagnetic activity. Perturbations in the magnetosphere alter the thermospheric composition, dynamics, and ionospheric electrodynamics, leading to reduced electron density and VTEC in specific ionospheric regions. Nonsignificant responses indicate an absence of consistent VTEC changes during a storm, influenced by the intricacies of ionospheric reactions, regional variations, and storm characteristics [31].
2.2.2. Construction of 2D Maps
This section focused on generating ionospheric VTEC images using a combination of observation models, state estimation techniques, and Bayesian inference. The methodology involved discretizing the ionospheric region, estimating observation matrices, determining VTEC estimates using Kalman filtering, and employing an ensemble of Kalman filters to handle uncertainty in the model parameters.
2.2.2.1. Observation Model
Here, yk[i] denotes the VTEC measurements at time step k, Θj(ui(k)) represents the basis function value at node ui(k), xk[i] signifies the VTEC coefficients associated with each node, and vk[i] accounts for the uncertainty introduced by numerical approximations and ionospheric disturbances. This equation effectively captures the linear combination of basis functions, which in turn contributes to the determination of the VTEC measurements. Consequently, the coefficients of Hk are derived from these basis function values, establishing the observation matrix crucial for the estimation process [32].
2.2.2.2. VTEC Estimation
These are the Kalman filter equations used to recursively estimate the state of the system and its covariance at a given time step (iteration). The discrete Kalman filter was employed to integrate instantaneous VTEC measurements with prior information, enabling the estimation of high-resolution ionospheric VTEC images at each time step. Equation (10) calculates the mean of the state estimate based on the predicted state from the previous time step and the measurements at the current time step. Equation (11) calculates the covariance matrix based on the predicted covariance from the previous time step, the measurement noise covariance, and the process noise covariance.
The disturbance term ε ∈ ℝN was assumed to be zero-mean Gaussian with covariance U = γ−1IN, where γ is a tuning parameter and IN is an identity matrix of size N [32, 33]. According to Murphy [35], the matrix L was defined as L = IN − A−1B, where A ∈ ℝN×N is a diagonal matrix with diagonal elements , and B ∈ ℝN×N is a matrix with nonzero elements Bij = −(1/bij) if nodes i and j are connected (e.g., with a vertex). Otherwise, Bij = 0 and Bii = 0. Here, bij represents the longitude/latitude distance between ionospheric nodes.
2.2.2.3. Initial Conditions
The state estimate and the posterior covariance matrix were initially set equal to zero. That is . From Pk|k − 1 = Qk + Pk−1|k − 1, ⇒P1|0 = Qk + P0|0 = Qk. The noise terms Qk = αpIN, where αp is the variance of the difference of consecutive observations corresponding to the same satellite–receiver link, while , αv being the variance of the errors between observations at neighboring IPPs ui(k) (≤1° in latitude and longitude) given time k.
2.2.2.4. Ensemble of Kalman Filters
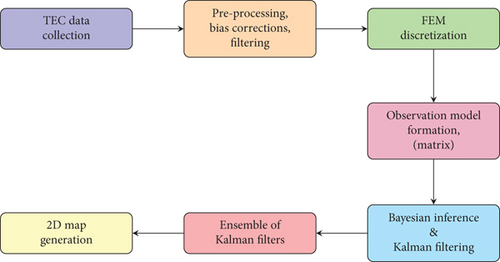
The process is summarized in the flowchart shown in Figure 2.
2.2.3. Validation
The validation of the constructed VTEC maps (FEM VTEC maps) involved a comparative analysis with GIMs from CODE (CODE’s VTEC map). This process examined discrepancies between the FEM-generated VTEC and established GIMs, assessing their ability to accurately represent ionospheric electron density. Validation further included comparing VTEC data from FEM maps, GIMs, the IRI-2020 model, and specific ground-based GPS stations at select coordinates.
3. Results and Discussions
3.1. Diurnal Variation of VTEC
Diurnal VTEC variations were analyzed using VTEC data from stations ADIS and MTDK, selected due to their distinct geomagnetic positions relative to the EIA. Observations were recorded on typical quiet days (16th March 2014 and 13th March 2018). As shown in Figure 3, VTEC values reached minimums around 03:00 UT, increased during the morning, and peaked around 12:00–13:00 UT before declining after sunset. This pattern reflects the influence of daytime ionization and nighttime recombination processes on electron density, which aligns with low-latitude ionospheric behavior [23, 39, 40].
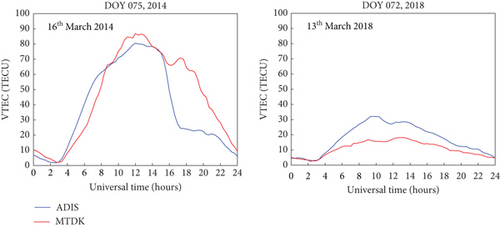
The peak VTEC was higher in 2014 than in 2018, demonstrating the impact of solar cycle variations in VTEC [25, 41–43]. Notably, nighttime enhancements were more pronounced at MTDK (approximately 70 TECU) and occurred 1–2 h earlier than at ADIS, potentially due to MTDK’s closer proximity to the magnetic equator. The observed nighttime VTEC enhancement may be associated with prereversal enhancements (PREs) in the ionospheric zonal electric field, influenced by both station location and magnetic latitude [44–47].
3.2. Seasonal Variation of VTEC
Seasonal variations in VTEC were assessed by analyzing monthly average VTEC data for March equinox, June solstice, September equinox, and December solstice, as illustrated in Figure 4. The results show semiannual patterns, with higher VTEC values during equinoxes than solstices, likely due to the subsolar point’s alignment near the equator, which enhances the fountain effect and ionization [48]. However, the seasonal pattern was less defined in 2018, likely due to reduced solar activity, which leads to lower electron densities and less pronounced VTEC variations [49, 50].
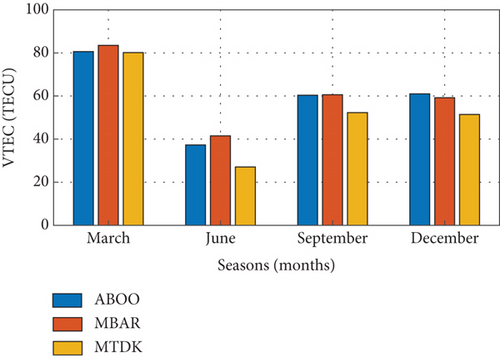
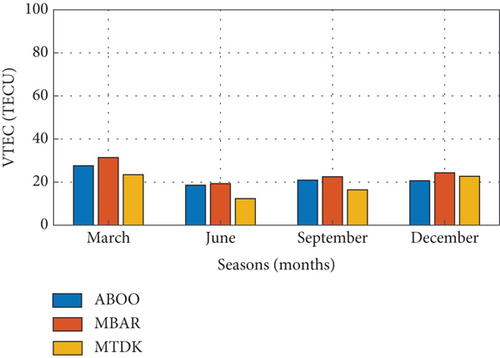
The equinoctial asymmetry observed, with March showing higher VTEC values than September, is likely due to global thermospheric circulation differences during the transition between solstices and equinoxes, resulting in thermospheric imbalance and ionospheric asymmetry [51–53]. Additionally, the asymmetry during solstices, with December showing higher values than June, can be attributed to the equatorial shift in the subsolar point during solstices, affecting photoionization and fountain effect intensity [54].
3.3. Variation of VTEC During Geomagnetic Storms
To investigate storm time VTEC behavior, strong geomagnetic storms from 2014 and 2018 were examined at GPS stations ABOO, DJIG, and MAL2, focusing on VTEC differences over a 3-day period. As shown in Figure 5, VTEC generally increased at the magnetic equator while decreasing at the crest regions during geomagnetic storms, indicative of ionospheric disturbance and electron redistribution from electric field penetration and wind perturbations [55–57].
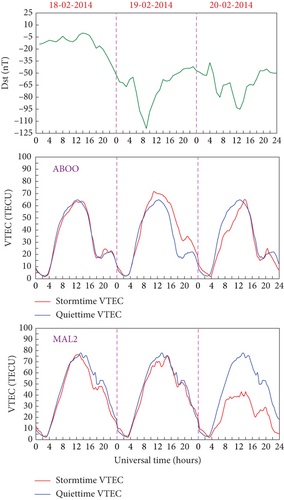
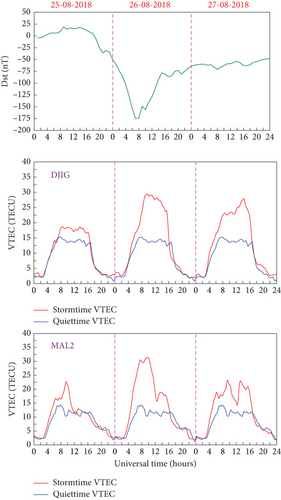
For instance, during the 2014 storm on 18th February, the initial Dst index decrease did not significantly affect VTEC in the EIA trough region, but a subsequent drop on 19th February resulted in increased VTEC near the equator with a simultaneous decrease at the crest. This pattern is attributed to enhanced electric fields and ionospheric disturbances during geomagnetic storms, which elevate electron density near the magnetic equator [19, 39, 58–61]. In 2018, VTEC levels during storm periods exceeded quiet time values, a phenomenon attributed to ionospheric plasma upflow replenishing the plasmasphere [62, 63]. The positive effects of geomagnetic storms on the ionosphere can cause increased plasma densities, as observed during the storm on 25th August 2018, reflecting intensified magnetospheric electric fields and subauroral processes that increase plasma density in equatorial regions [64, 65].
3.4. Construction of VTEC Maps
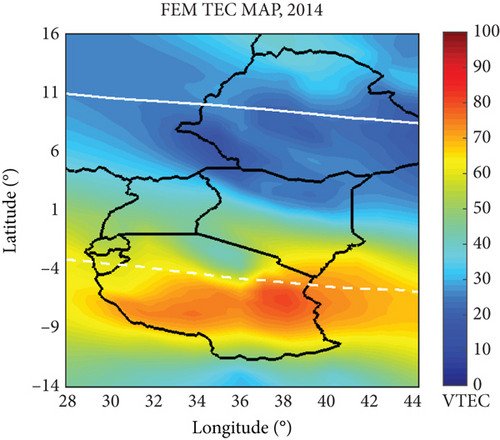
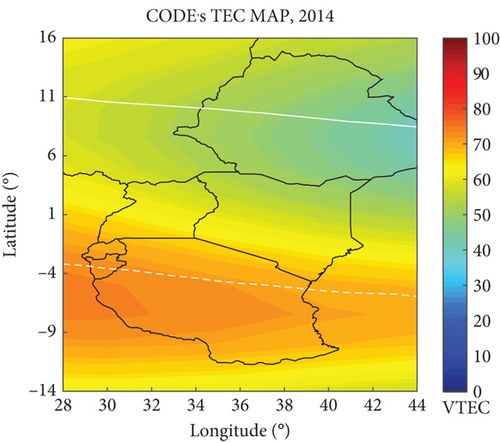
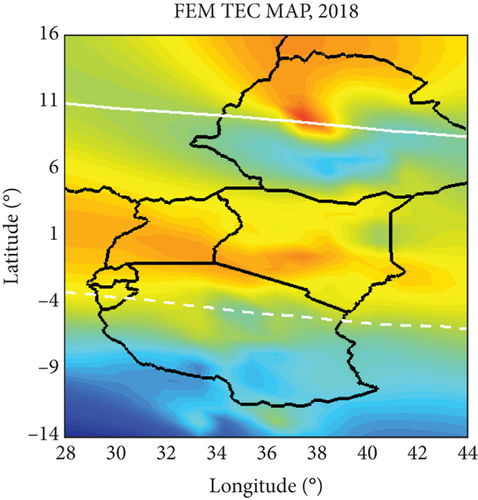
The study of VTEC variation in the low-latitude equatorial region is crucial for several reasons. Firstly, the equatorial ionosphere is highly dynamic and subject to unique influences such as equatorial electrojet, plasma bubbles, and irregularities. Understanding VTEC variation allows for the identification and characterization of these phenomena, which are essential for accurately modeling and mapping the electron density distribution. Additionally, VTEC variation studies provide insights into the temporal and spatial dynamics of the ionosphere, helping to capture diurnal, seasonal, and solar cycle–dependent changes. This information is fundamental for improving the accuracy of VTEC maps, ensuring that they reflect the true ionospheric conditions in the low-latitude equatorial region. Furthermore, VTEC variation studies aid in identifying anomalies or disturbances that may affect communication and navigation systems relying on ionospheric modeling, enabling the development of more robust and reliable VTEC maps for practical applications. The VTEC maps were constructed with a spatial resolution of 1∘ × 1∘ utilizing data from 31 GNSS receivers and employing a temporal resolution of 1 min, facilitating the capture of local characteristics and short-term ionospheric variability. For simplicity purposes, the constructed maps were referred to as FEM VTEC maps and the GIMs were indicated as CODE’s VTEC maps. Thus, the FEM VTEC maps were compared with the GIMs from CODE on DOY 075 at 18:00 UT, both during LSA and HSA years, as depicted in Figure 6. From Figure 6, the FEM VTEC maps provided a clear representation of small-scale features and variations in VTEC within the East African region. This enhanced representation is attributed to the FEM VTEC maps’ high spatial and temporal resolution of 1° × 1° and 1 min, respectively. In contrast, the CODE’s VTEC maps did not capture these small-scale features as effectively, due to their lower spatial and temporal resolution of 2.5° × 5° and 1 h, respectively. Additionally, GIMs commonly employ temporal smoothing techniques to reduce the impact of short-term fluctuations and provide a universal overview. While this approach is advantageous for gaining a general understanding of ionospheric behavior, it may fail to account for the rapid changes and small-scale structures that characterize the equatorial ionosphere. This means that the intricate dynamics and localized phenomena specific to the equatorial region might not be adequately represented. Therefore, the FEM VTEC maps are considered superior or more favorable when compared to the CODE’s VTEC maps in their ability to offer a more precise and detailed depiction of VTEC in the East African region. In other words, the FEM VTEC maps are believed to provide a more accurate and finely grained representation of the ionospheric conditions specific to East Africa when compared to the CODE’s maps.

3.4.1. VTEC Maps for Monitoring Diurnal and Storm Time Variations
The latitude, UT, and estimated VTEC data for each triangular node were arranged into a matrix format, with each row representing a specific node and columns detailing latitude, UT, and estimated VTEC values. Using this matrix, 2D VTEC maps displaying latitude versus time, as shown in Figure 7, were constructed to analyze diurnal variations and to observe how the ionosphere responds to geomagnetic storms.
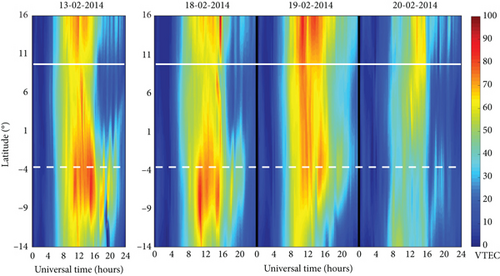
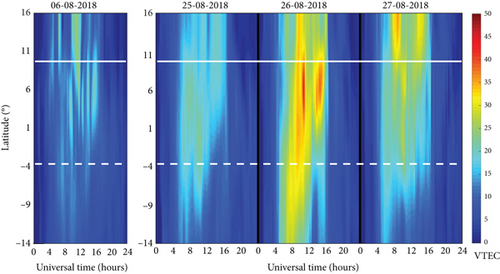
Diurnal, or daily, variation in VTEC is primarily driven by the sun’s ionizing influence on the ionosphere, resulting in predictable changes throughout the day. As solar radiation increases with sunrise, the ionosphere undergoes ionization, generating free electrons and resulting in a gradual rise in VTEC levels across East Africa. The VTEC reaches its peak around midday, typically between 10:00 and 14:00 UT in equatorial and low-latitude regions, when solar intensity and ionization are highest. Following this peak, VTEC levels begin to decline in the late afternoon as solar energy decreases, eventually reaching their lowest values in the early morning hours due to reduced ionization and increased recombination of electrons with ions as the atmosphere cools. In equatorial and low-latitude regions, TEC does not simply decline steadily after sunset. Instead, it often experiences a noticeable enhancement, peaking between 18:00 and 21:00 UT, before gradually tapering off toward the early morning hours. These nighttime TEC enhancements are more pronounced during solar maximum periods, when the ionosphere is more heavily ionized and dynamic. The patterns shown in Figure 7 were able to depict the diurnal features discussed above and also in Section 3.1.
During geomagnetic storms, TEC in equatorial and low-latitude regions typically fluctuates due to a complex interaction of processes. Enhanced electric fields from storm activity can increase TEC through the fountain effect, pushing ionized particles to higher altitudes. At the same time, changes in the neutral composition and altered thermospheric winds can reduce TEC by promoting recombination. These storms may also cause the EIA to expand, increasing TEC peaks at higher latitudes. Additionally, storms often induce TEC irregularities known as scintillations, causing rapid fluctuations that can disrupt communication and navigation systems. The result is a dynamic mix of TEC enhancement and depletion across the region. The maximum VTEC values at the EIA trough and crest regions on February 13, 2014 (quiet day), were approximately 70 and 93 TECU, respectively. During the initial phase of the storm on February 18, the VTEC values were around 63 and 90 TECU for the trough and crest regions, respectively. On the main storm day (February 19), the VTEC values were approximately 90 and 67 TECU, and on the recovery phase day (February 20), the observed VTEC values were about 60 and 40 TECU. From these observations, it is evident that the East African low-latitude equatorial region responded positively and negatively to the geomagnetic storm on February 19 at the trough and crest regions, respectively. This aligns with previous observations when analyzing the storm’s impact by comparing GPS Storm VTEC values of three storm days with the quiet VTEC values of the quietest international day of the month (Figure 5a) in Section 3.3. This confirms the capability of the constructed VTEC maps to effectively characterize the variations in VTEC across the East African low-latitude region during the geomagnetically disturbed day of February 19th, 2014. For the 2018 geomagnetic storm (Figure 7b), the VTEC values during the main phase (26th August) were higher than those during the initial phase (25th August), consistent with the observations discussed in Section 3.3. As observed in Figure 7, a decrease in VTEC during the recovery phase following a geomagnetic storm indicates the restoration of ionospheric stability, to normal ionospheric conditions after the disturbance caused by the storm. From the above observations, the created VTEC maps were able to reveal VTEC variability over the East African low-latitude region during geomagnetically disturbed conditions.
3.4.2. VTEC Maps for Seasonal VTEC Variation
The VTEC maps in Figure 8 show the variations in VTEC across the East African low-latitude region for different seasons in 2014 and 2018. The maps were generated at 13:00 UT for specific dates representing each season. As observed, the VTEC maps reveal that equinox months had the highest levels of VTEC, while solstice months had the lowest levels. In 2014, there was more prominent EIA formation during the equinoctial months, with March exhibiting the most pronounced EIA development. These findings confirm the effectiveness of the constructed VTEC maps in predicting the local structures in VTEC variations across different seasons in the east African sector.


3.4.3. Validation of VTEC Maps
The FEM VTEC maps were validated by comparing them with observed VTEC data from GNSS receivers and alternative models, including CODE’s VTEC maps and the IRI-2020 model, using the Pearson correlation coefficient and RMSE as statistical metrics, as introduced in Section 2.2.3. This comparison is aimed at assessing how well the FEM VTEC maps captured ionospheric VTEC dynamics in the East African low-latitude region.
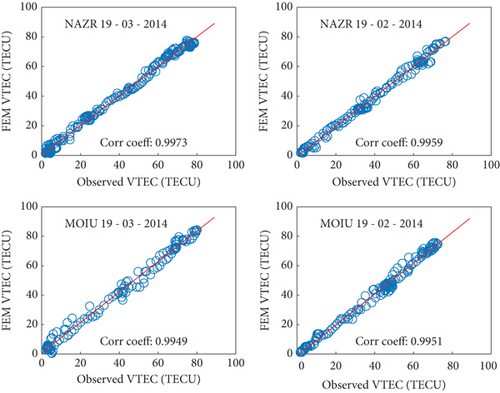
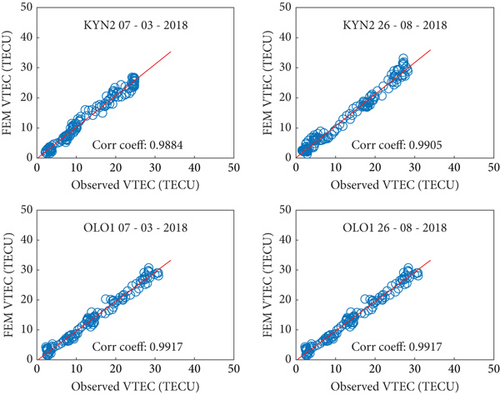
Figures 9 and 10 present correlation and RMSE analyses, respectively. The FEM VTEC maps demonstrated high correlation coefficients (ranging from 0.98 to 0.99) with observed VTEC data across both quiet and disturbed geomagnetic conditions. Figure 9 illustrates this strong linear relationship at various stations (e.g., NAZR, MOIU, KYN2, and OLO1) during quiet days (March 19, 2014, and March 7, 2018) and disturbed days (February 19, 2014, and August 26, 2018), exhibiting the FEM model’s accuracy in capturing VTEC fluctuations despite geomagnetic disturbances.
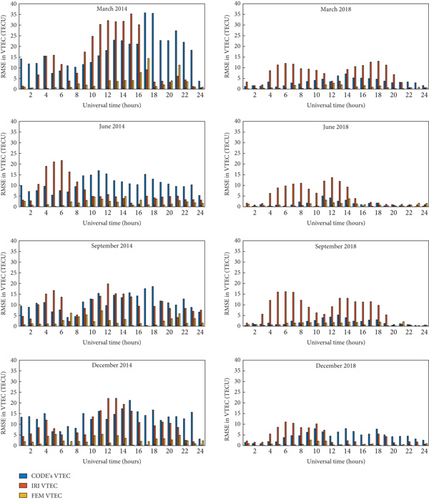
In Figure 10, RMSE values reveal a significant reduction in error for the FEM VTEC maps compared to CODE’s and IRI-2020 models. Notably, FEM VTEC maps consistently recorded the lowest RMSE values during both HSA and LSA years, reflecting the model’s capacity to minimize prediction errors across diurnal variations and seasonal changes. For example, during the HSA year (2014), the FEM VTEC model maintained minimal RMSE values, even in the challenging 10:00–18:00 UT interval when the ionosphere experiences rapid fluctuations. This period showed higher errors for CODE’s VTEC and IRI-2020 models, underscoring FEM’s advantage in accuracy during peak ionospheric activity.
These observations indicate that FEM VTEC maps provide a detailed and precise representation of VTEC, outperforming CODE’s GIM and IRI-2020, particularly in regions with rapid and localized ionospheric changes. The FEM maps offer enhanced reliability for East Africa’s low-latitude ionospheric studies, making them a valuable tool for applications in navigation, communication, and space weather monitoring.
4. Conclusions
This study developed a method to construct high-resolution ionospheric VTEC maps over East Africa using data from a network of GNSS receivers. By combining the FEM with the EnKF, the research successfully generated accurate and up-to-date VTEC maps, providing critical insights into ionospheric behavior in the region. The study confirmed typical ionospheric patterns, such as diurnal variations with minimum VTEC around 03:00 UT and maximum around 12:00–13:00 UT, as well as seasonal changes with peak VTEC during the March equinox and troughs during the June solstice. Additionally, postsunset VTEC enhancements and heightened sensitivity to geomagnetic storms were observed, particularly in the EIA region.
The generated maps demonstrated a strong positive correlation with observed VTEC values, establishing them as reliable tools for understanding ionospheric dynamics and predicting space weather impacts. Integrating these maps into TEC monitoring and space weather forecasting systems could enhance precision and improve resilience against disruptions caused by space weather events.
Despite the promising results achieved with the hybrid approach combining the FEM and the EnKF techniques in predicting TEC over the East African region, several limitations should be acknowledged. Firstly, the model’s performance is heavily dependent on the quality and density of GNSS data. In regions with sparse data coverage, the accuracy of the VTEC predictions may be compromised. Additionally, the computational complexity of the FEM-EnKF method, particularly in real-time applications, could limit its practicality in scenarios where rapid responses are required. The process of tuning parameters, essential for optimizing the model’s performance, adds another layer of complexity, especially when dealing with time-varying ionospheric conditions. Furthermore, while the Bayesian inference and Kalman filtering techniques help manage uncertainties, the predictions inherently carry some level of uncertainty, particularly under unusual or extreme ionospheric conditions. These limitations highlight areas for further research to enhance the robustness and generalization of the model across different regions and ionospheric scenarios. Future research should focus on the underlying mechanisms that drive storm-induced VTEC fluctuations, especially in the EIA region. Understanding these processes will improve space weather monitoring and prediction capabilities, which are crucial for mitigating the impact of geomagnetic storms on communication and navigation systems. To gain a more comprehensive understanding of ionospheric behavior and dynamics, future studies should explore the construction of three-dimensional VTEC maps. These maps would offer more detailed spatial information, which could significantly enhance the accuracy of ionospheric modeling and predictions. Continuous validation and refinement of the FEM VTEC maps are essential, and future work should incorporate data from other sources, such as satellite-based measurements, to improve the robustness and reliability of the models. Cross-comparisons with different datasets will help identify and address any discrepancies, ensuring the models remain accurate and up-to-date. Additionally, developing techniques for real-time TEC mapping in East Africa could provide more immediate and actionable data for applications in navigation, communication, and space weather forecasting. This would require advancements in both data collection and processing methodologies, as well as the integration of real-time GNSS data streams.
Conflicts of Interest
The authors declare no conflicts of interest.
Funding
No external funding was received for this study.
Endnotes
1https://cddis.nasa.gov/archive/gnss/data/daily/
2http://omniweb.gsfc.nasa.gov/form/dx1.html
3https://cddis.nasa.gov/archive/gnss/products/ionex/
Open Research
Data Availability Statement
The findings of this study can be supported with data, which are accessible from the corresponding author upon request.


