Characterizing Hydrocarbon Reservoirs in Kenya’s Lamu Basin Leveraging Petrophysical and Rock Physics Approaches
Abstract
The characterization of Lamu offshore reservoirs remains limited due to the absence of integrated studies combining petrophysical analysis and rock physics modeling. This study aims to enhance reservoir characterization, reduce exploration risks, and provide a framework for similar geological settings. Log data from three wells were analyzed to determine key petrophysical properties and evaluate rock physics models for lithology and fluid discrimination. Reservoir zones were delineated based on petrophysical parameters, including clay volume, porosity, hydrocarbon saturation, and gamma ray and resistivity responses. The selected reservoirs exhibited favorable characteristics, with low shale volume (0.07–0.26), high effective porosity (0.12–0.25), low water saturation (0.23–0.56), and a net thickness (18.95–43.22 m). Rock physics cross-plots (mu-rho vs. density, acoustic impedance vs. lambda-rho, and Vp/Vs ratio vs. acoustic impedance, among others) effectively distinguished hydrocarbon-bearing zones from brine-saturated sands and shales. Color-coded cross-plots further validated fluid discrimination, showing low water saturation and gamma ray values with high porosity in hydrocarbon zones. Gassmann fluid substitution analysis confirmed that replacing water with hydrocarbons significantly reduced density and had a more pronounced effect on compressional velocity than shear velocity. These findings highlight an integrated approach to minimizing hydrocarbon exploration risks, particularly in avoiding dry wells, and offer valuable insights for future exploration efforts in Lamu offshore and similar basins.
1. Introduction
Exploring hydrocarbons entails significant risks, particularly in pinpointing potential drilling locations [1, 2]. Integrating petrophysics and rock physics models serves as a valuable tool in subsurface modeling to precisely depict reservoir lithology and fluid content, thereby mitigating exploration risks [3]. Petrophysics and rock physics focus on interpreting logs for formation evaluation and understanding the relations between geophysical measurements and rock properties, respectively [4]. Integrated techniques involving rock physics and petrophysics, along with pseudo–post-stack simultaneous inversion, were successfully applied to assess hydrocarbon probability and predict the lithology of the Mishrif Formation in southern Iraq’s Kumaite and Dhafriyah oil fields [5]. Similarly, in characterizing upper shallow marine sandstone reservoirs in South Africa’s Bredasdorp offshore basin, the integration of rock physics, petrophysics, and fluid substitution modeling was employed [6]. Furthermore, in the characterization of the Niger Delta’s Sokab field in Nigeria, 3D seismic, rock physics, and petrophysics analyses were utilized to define reservoir geometry in terms of flow and structural properties [7].
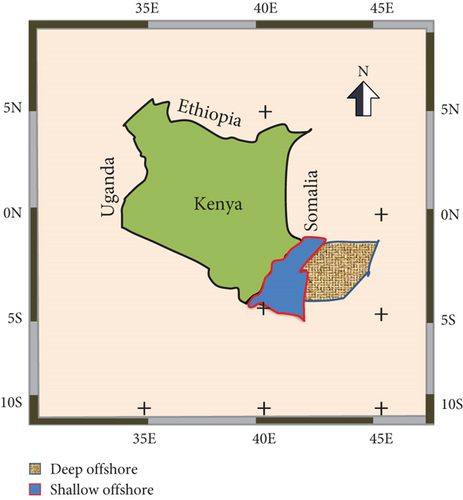
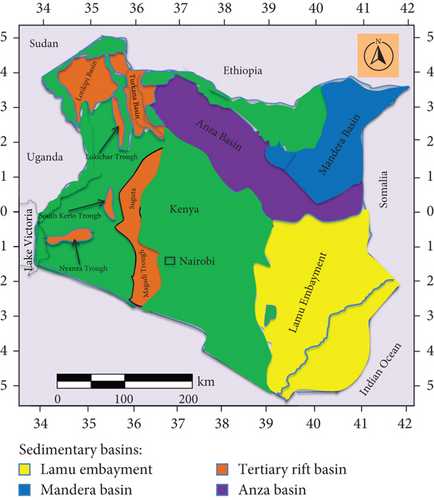
The Lamu Basin, situated in southeastern Kenya, forms part of the passive continental margin of Kenya, encompassing both onshore and offshore areas [8, 9] (Figure 1). This basin shares geological similarities with continents like Madagascar, Antarctica, Australia, India, and America, which separated during the Jurassic rifting [11]. Notably, significant discoveries of oil and gas in Mozambique, Tanzania, and Madagascar’s heavy oil deposits indicate similar potential in East Africa’s conjugate margin [12]. However, despite these prospects, several drilled wells have yielded dry results. Thus, ascertaining the presence, types, and volumes of hydrocarbons before drilling is essential for reducing investment risk. A study on the petroleum prospects of the Lamu Basin concluded that the location of drilled wells along the reservoirs appears to be characterized by both faults (structural lead features) and geothermal highs (subsurface stratigraphic elements), highlighting the need for an integrated approach to improve reservoir characterization and effectively locate wells before drilling [8].
Previous work in the Lamu Basin focused on sedimentological characteristics such as texture and grain size, neglecting other petrophysical properties like clay volume, hydrocarbon saturation, and water saturation, as well as rock physics models for lithology delineation, reservoir fluid discrimination, and the prediction of reservoir elastic properties using Gassmann fluid substitution results [13]. While previous studies may have focused on individual aspects of reservoir analysis, this research brings together petrophysical analysis and rock physics models to provide a comprehensive understanding of reservoir properties and behavior. Therefore, this paper aims to apply an integrated approach utilizing petrophysical analysis, rock physics models, and fluid substitution results to enhance reservoir characterization and minimize hydrocarbon exploration risks, such as drilling dry holes.
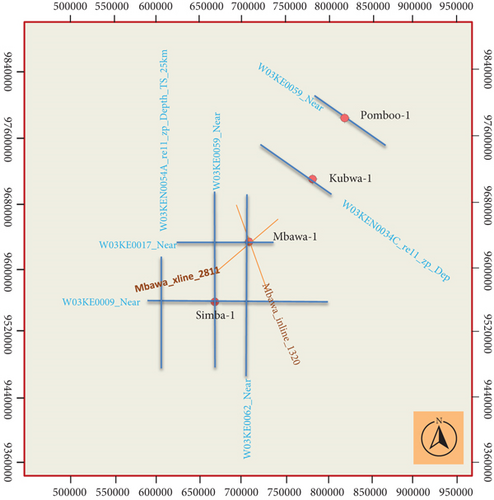
This study examines three offshore wells (Kubwa-1, Mbawa-1, and Pomboo-1) based on their geological diversity and representation of typical reservoir characteristics in the Lamu offshore region. Out of the 63 gazetted petroleum exploration blocks in the Lamu Basin, there are 13 discoveries to date. The outcomes in the play fairway analysis, indicating hydrocarbon shows in Mbawa-1 (Block 8) with gas discovery, Pomboo-1 (Block 7), and Kubwa-1 (Block 5) which turned dry wells, highlighted the variability in hydrocarbon presence and the need for detailed analysis. These wells were strategically chosen from different sections/blocks of the basin, offering a range of lithologies, fluid types, and depths that are commonly encountered in ongoing exploration projects [14].
The selection was informed by historical data and their proximity to known hydrocarbon-bearing zones, making them suitable for a comprehensive assessment of reservoir properties [15]. Correlating stratigraphically, the Pomboo-1 well drilled in the deepwater Lamu Basin intersected key stratigraphic sequences. Kubwa-1 and Mbawa-1 wells provided data on sedimentary sequences, aiding in establishing stratigraphic continuity across the basin. Structural and tectonic analysis was enhanced by leveraging gravity data to develop gravity anomaly maps that indicated subsurface structures near these wells, essential for understanding the Lamu Basin architecture [10].
The findings from these wells are expected to be applicable across the broader Lamu Basin due to the geological similarity between the selected wells and other known reservoirs in the region. For example, the depositional environments and lithological patterns observed in the wells are consistent with regional trends identified in recent geological surveys [16]. As such, the integrated approach applied here can serve as a model for evaluating other offshore reservoirs in the basin, providing insights into reservoir zones, fluid discrimination, and exploration risk mitigation [17]. The innovation of this research lies in its comprehensive and integrated approach to reservoir characterization, which aims to minimize exploration risks and improve the success rate of hydrocarbon exploration in the Lamu offshore basin.
2. Study Area and Geological Setting
The Lamu Basin covers onshore and offshore and extends to more than 169,000 km2. It forms part of the passive continental margin of Kenya and has sediments ranging in thickness from 3 km onshore to 13 km offshore, respectively (Figure 1b) [8, 10, 18].
The tectonic activities that led to the dismemberment of Gondwana during the Jurassic and rifting of Anza in the Cretaceous control the geology of the Lamu Basin [10, 16]. The Lamu Basin is classified under the passive continental margin, unusually positioned transitionally between the northern rifted margin and the southern transform margin [19]. The constituent sediments are mainly marine sandstones, shale, and carbonates [20]. The focus of this study is the region outlined in red in Figure 1a, which is the shallow offshore section bounded by 39°–43° E and by 2°–6° S [10]. Most of the wells drilled in the study area were dry, with some having hydrocarbon shows of noncommercial significance. This study considers some of the wells shown in Figure 1c.
3. Materials and Methods
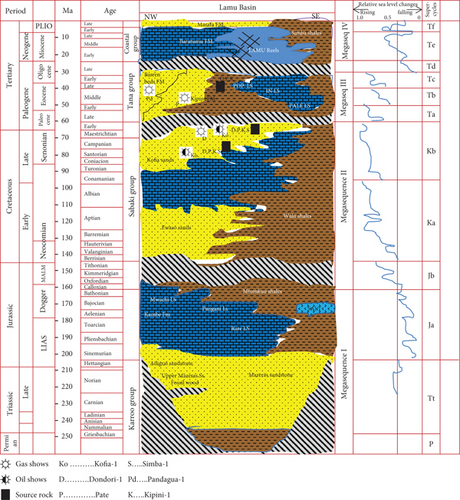
Well log data used in this study were collected by Schlumberger Service Company and obtained from the National Oil Corporation of Kenya (NOCK). The three offshore wells considered include Kubwa-1, Mbawa-1, and Pomboo-1. All the wells are vertical wells with depths ranging from 3150 to 5887 m. The Kubwa-1 and Mbawa-1 data were in LAS format, while the Pomboo-1 data was in DLIS format. The other information provided included the geological reports, well completion reports, well lithology, and Lamu Basin lithostratigraphic column as shown in Figure 2. Based on the geological and geophysical well data and outcrop studies, the stratigraphic section was divided into four significant sequences, which range from Triassic to the Tertiary age [20, 21].
The presence and quality of the required logs together with their families and units were checked from the log view display in Schlumberger’s Techlog Version 2015 software. The environmentally corrected triple combo logging suite was used to delineate target reservoirs in the three wells.
The logs include gamma ray (G.R.) in API units, resistivity (R.T.) in Ohm-m, sonic (Vp) in meters per second (m/s), density (RHOB) in grams per cubic centimeter (g/cm3), and neutron log (NPHI) in fraction. The main workflows include petrophysical analysis and rock physics cross-plots and models in the Techlog software. Schlumberger’s Petrel Version 2017 was used in Gassmann’s fluid substitution analysis.
G.R. logs combined with neutron and density logs and neutron-density cross-plots were applied in discriminating lithologies [3, 22]. R.T. logs were utilized to characterize the delineated reservoir’s fluid content [23].
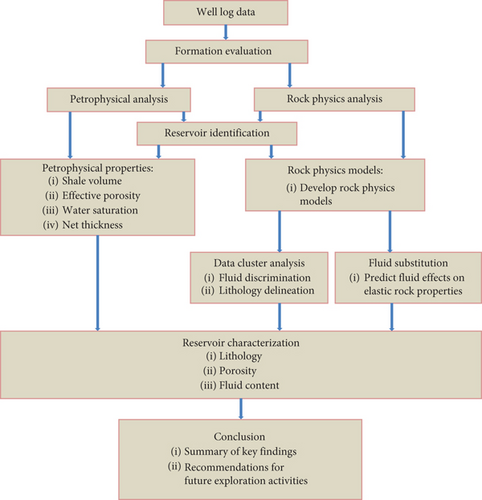
The flowchart represented by Figure 3 outlines the main steps involved in the study, from data collection to conclusion and recommendations. Each step represents a key process or analysis conducted during the study.
3.1. Petrophysical Analysis
Petrophysical analysis was carried out to determine various parameters such as formation temperature, water R.T., volume of shale, effective porosity, water saturation, and hydrocarbon saturation using empirical petrophysical relations [1]. The separation in the combined neutron-density logs indicates the lithology, whereas the average indicates porosity [24]. Crossing-over of neutron-density logs with high R.T. responses concurrently indicates hydrocarbon-bearing zones at low G.R. section. The separation in a reservoir zone indicates the presence of a gas (gas effect) [25].
The Upper Qishn clastic reservoir petrophysical properties, such as the saturation and porosity, were evaluated utilizing well log data in Sharyoof oilfield, Sayun-Masilah Basin, Yemen. The findings from the porosity reservoir tested for six wells indicate an overall average porosity of 14.62%–24.2%, while the relative permeability is 11.98%–18.2%. Nevertheless, the water saturation of the reservoir varies from about 50%–84.1% [26].
An integrated approach for saturation modeling applied petrophysical analysis to enable the definition and calculation of the hydrocarbon reserves within the key reservoir units of the Upper Messinian reservoir, Nile Delta area [27].
3.2. Rock Physics Modeling
Rock physics cross-plotting and modeling were carried out to characterize the hydrocarbon reservoir [28]. The various well-based rock physics parameters, such as velocity ratio, lambda-rho, acoustic impedance, and mu-rho, were computed using standard rock physics equations [29]. Cross-plotting the elastic parameters of the reservoir was appropriately color-coded with density and petrophysical parameters such as Vsh and Sw. The objective of cross-plotting was to discriminate lithology and identify reservoir fluid content type [30]. Lambda-rho is a measure of incompressibility; therefore, low values indicate hydrocarbon-saturated zones since hydrocarbon density and velocity are lower than other geofluids such as water [31]. Mu-rho is a measure of rigidity; therefore, it will be higher in reservoir zones since sands that make up reservoirs have generally higher acoustic impedance than lithologies such as shale [25]. The mu-rho and acoustic impedance values are expected to decrease in hydrocarbon-charged or saturated sands.
3.2.1. Fluid Substitution
Fluid substitution is used to estimate changes in the elastic properties of porous media caused by changes in pore fluids [32]. Gassmann fluid substitution is a commonly used technique in rock physics that allows you to predict the changes in the elastic properties (such as compressional velocity, shear velocity, and bulk density) of a rock when its fluid content changes [33]. This is crucial for understanding how different fluid types (e.g., brine, oil, and gas) will affect the seismic properties of a reservoir and for interpreting subsurface data [34].
The fluid substitution process employs Gassmann’s relations [35] in predicting saturated rock properties from dry rock properties [36], which gives the relationship between bulk modulus of saturated rock, dry rock modulus, pore fluid, and solid matrix [37, 38].
Ksat = effective bulk modulus of the porous rock with fluid (oil, gas, or water)
Kdry = effective bulk modulus of the dry porous rock
Kmin = bulk modulus of the minerals which compose the rock
Kfluid = effective bulk modulus of the fluids contained in the porous rock
∅ = rock porosity
μsat = effective shear modulus of the porous rock with fluid
μdry = effective shear modulus of the dry porous rock
This equation assumes that the rock frame is rigid and that the fluid saturates the pores without altering the rock matrix. Gassmann’s equation is applied on the assumption that the rock is isotropic and homogenous with a complete pore system connection [39]. Its results are reliable when applied in the clean sand zone with high effective porosity. The model required the acoustic properties (Vp, Vs, and bulk density) as the input parameters, while the rock shear modulus (μ), frame or dry rock modulus (Kdry), and matrix bulk modulus (Kmin) remain constant during the fluid substitution modeling process [6].
The shear modulus (μ) and frame or dry rock modulus (Kdry) are generally obtained from well logs and can be derived from the elastic modulus logs (e.g., P-wave and S-wave velocity logs). If the rock properties are not directly available from well logs, they can also be estimated using a combination of mineralogy (e.g., from core samples or other geophysical techniques) and rock physics models [40].
The fluid bulk modulus (Kfluid) depends on the type of fluid filling the pore space, and it can be calculated from standard fluid properties. For brine, the bulk modulus can be obtained from standard fluid tables or equations that account for pressure and temperature effects on fluid compressibility. For oil and gas, similar fluid property equations or empirical relationships can be applied, taking into account the specific fluid’s compressibility, temperature, and pressure [23]. Fluid saturation is a key parameter that affects the Gassmann model, and it is calculated based on petrophysical analysis. Water saturation (Sw) can be derived using Archie’s equation or more advanced models if complex fluid distributions are present. For accurate fluid substitution, it is critical to properly calculate the proportion of each fluid [6] present in the reservoir. This can be done by utilizing cross-plotting methods or well log interpretation [41]. If the reservoir contains multiple fluids, such as a mixture of gas, oil, and water, then the fluid substitution model must be applied iteratively for each fluid type, or weighted averages can be used to calculate an effective fluid bulk modulus for mixed-phase reservoirs [42]. For heterogeneous reservoirs, fluid substitution might need to account for varying porosity and saturation across different zones of the reservoir. This means that the model needs to be calibrated at multiple points across the reservoir to reflect its variability [43].
In the case of the Lamu Basin, well logs were derived from P-wave and S-wave velocities, from which effective bulk modulus of the dry porous rock (Kdry) and effective shear modulus (μ) of the dry porous rock were calculated. In the analysis of a gas reservoir, fluid properties specific to gas, such as effective bulk modulus of the fluids (Kfluid) contained in the porous rock for gas (e.g., calculated using gas compressibility at the specific depth, temperature, and pressure conditions) were used. Based on the petrophysical analysis, it was found that the fluid saturation in the target zone is 70% brine, 25% oil, and 5% gas. This then could be applied in the Gassmann equation iteratively or using a weighted average for fluid moduli to simulate the substitution of brine with oil and gas. The calibration yielded changes in elastic properties such as compressional velocity, shear velocity, and bulk density that would be input into the seismic models to predict the behavior of the reservoir under different fluid scenarios.
In this study, an integrated approach combining petrophysical analysis and rock physics modeling was applied to characterize offshore reservoirs in the Lamu Basin. While standard methodologies have been widely used in similar studies, these techniques were adapted to address the unique geological challenges presented by Lamu’s complex reservoir systems. Specifically, the heterogeneous lithologies, varying fluid types, and complex pore structures in the basin required modifications to traditional models. For instance, an adjusted shale volume calculation method was introduced to better distinguish between shale and hydrocarbon-bearing zones in Lamu’s offshore deposits, where traditional models often fail to differentiate between brine and oil reservoirs. Furthermore, a localized fluid substitution model tailored to account for the unique fluid properties observed in Lamu’s reservoirs was developed, enabling more accurate predictions of elastic rock properties.
Additionally, the cross-plotting techniques were customized to enhance fluid zone discrimination, using the novel mu-rho and lambda-rho cross-plots, which allowed for a clearer differentiation between hydrocarbon-bearing zones, brine-saturated sands, and shale deposits. This innovation was especially critical given the diverse lithological environments found within the Lamu Basin. The integrated approach also offered valuable insights into minimizing exploration risks, as it provided a more detailed understanding of reservoir quality and fluid content than conventional methods, significantly improving the potential for successful hydrocarbon exploration.
4. Results
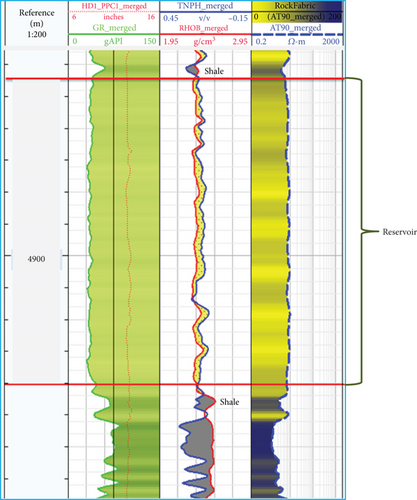
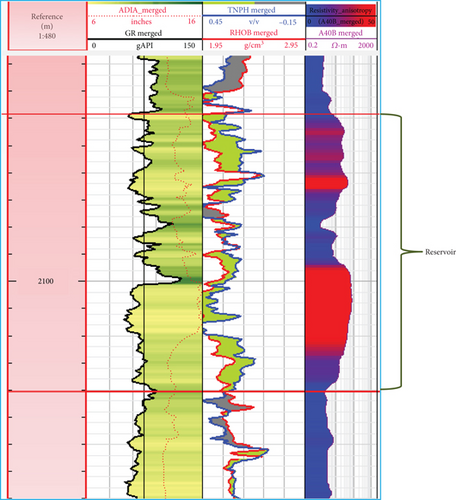
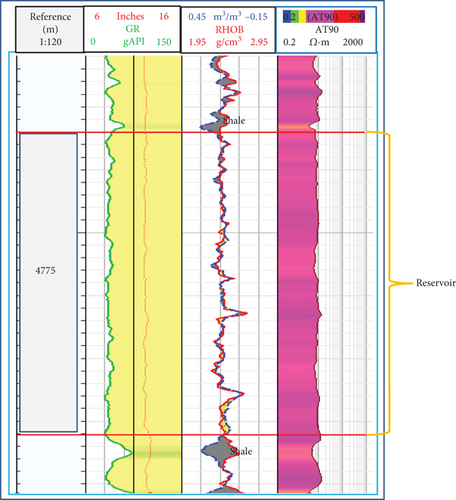
The analysis of G.R. and R.T. logs is a common method for lithology and fluid discrimination in reservoir characterization studies. In this study, it was utilized in delineating lithology and discriminating fluid. High G.R. values with low R.T. values signified shale lithology. Conversely, low G.R. values with high R.T. values indicated a hydrocarbon-bearing zone, as supported by previous studies [3]. The summary of the petrophysical properties (porosity, shale volume, and water saturation) of the studied reservoirs presented in Table 1 provides essential insights into the reservoir characteristics, allowing for comparisons and further interpretation. Quantitative analysis of the well logs shows a high porosity hydrocarbon reservoir with moderate thickness, low shale volume, and water saturation, as seen in Table 1.
| Well | Top (m) | Bottom (m) | Thickness (m) | VShale (%) | ΦEff (%) | Sw (%) |
|---|---|---|---|---|---|---|
| Kubwa-1 | 4884 | 4910 | 25.38 | 7.1 | 18.8 | 43.6 |
| Mbawa-1 | 2068 | 2120 | 43.22 | 22.2 | 25.2 | 22.8 |
| Pomboo-1 | 4767 | 4791 | 18.95 | 26.4 | 11.8 | 55.7 |
The hydrocarbon-bearing zone reflects possibly coarse-grained friable sandstone in Kubwa-1 and Mbawa-1 and calcareous sand in Pomboo-1 having low shale volume and water saturation with high porosity (Figure 4).
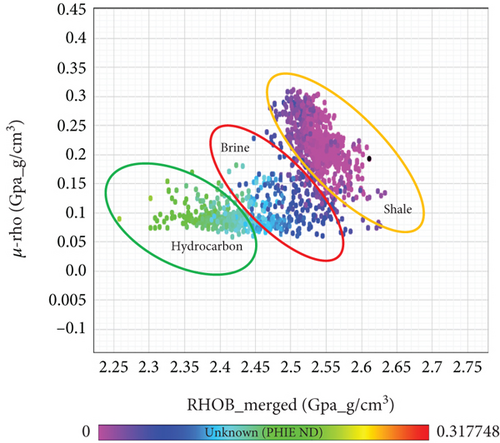
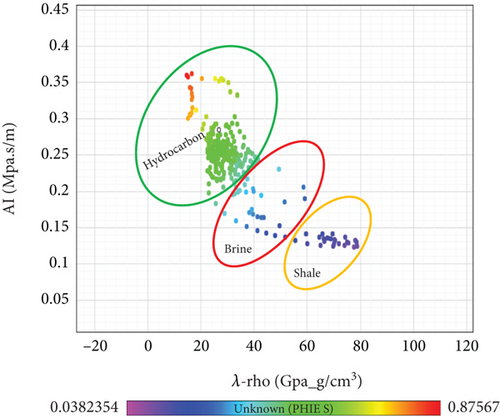
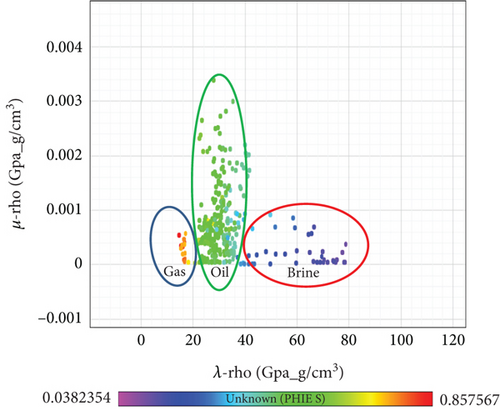
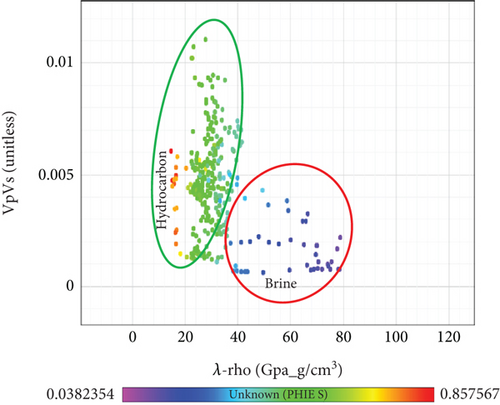
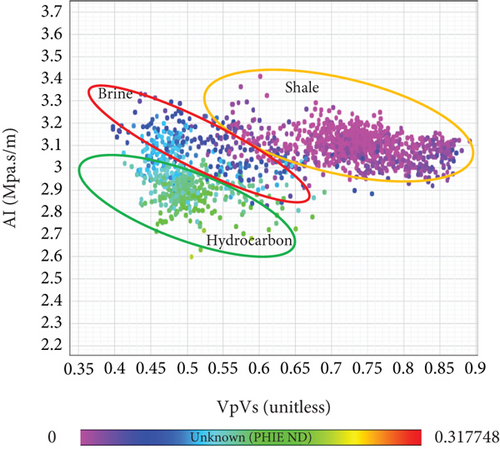
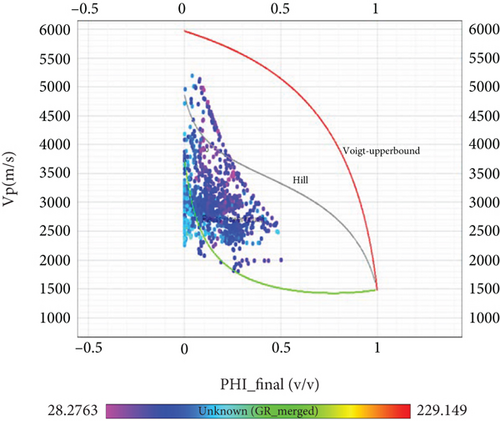
Figures 5, 6, 7, 8, 9, and 10 reveal the results for cross-plotting various petrophysical parameters. In the mu-rho against density cross-plots, data was separated into three zones: hydrocarbon sand, brine sand, and shale (Figure 5). Acoustic impedance against lambda-rho cross-plots indicated hydrocarbon zones having lower acoustic impedance and lambda-rho compared to brine-saturated sand and shale (Figure 6). The presence of gas-saturated sand was shown on the mu-rho against lambda-rho cross-plots (Figure 7). In the lambda-rho against Vp/Vs cross-plots, it was demonstrated that lambda-rho is more robust in discriminating fluid types and lithology (Figure 8). Lithology discrimination along the acoustic impedance axis was evident in the Vp/Vs against acoustic impedance cross-plots (Figure 9). The cross-plots of velocity against porosity indicated friable sandstones in the reservoir (Figure 10). Hydrocarbon-saturated zones were characterized by low density, acoustic impedance, mu-rho, and lambda-rho, while brine-saturated regions had low acoustic impedance and mu-rho values but higher lambda-rho values. Shale zones had high values of density, acoustic impedance, mu-rho, and lambda-rho.
Gassmann fluid substitution was performed to model seismic velocity and density at different water saturation levels. Rock frame properties were obtained from the well log data and were kept constant during the fluid substitution process. The properties for the three wells (Kubwa-1, Mbawa-1, and Pomboo-1, respectively) are summarized in Table 2. The porosity was determined from both well log data and core data analyses.
| Well name | Reservoir zone | Kdry (Gpa) | Kmin (Mpa) | Kfluid (Gpa) | Φ (%) | ||
|---|---|---|---|---|---|---|---|
| Top (m) | Bottom (m) | Quartz | Clay | ||||
| Kubwa-1 | 4884 | 4910 | 14.56 | 35,981 | 35,000 | 2.39 | 18.8 |
| Mbawa-1 | 2068 | 2120 | 13.85 | 35,981 | 35,000 | 2.26 | 25.2 |
| Pomboo-1 | 4767 | 4791 | 15.13 | 35,981 | 35,000 | 2.87 | 55.7 |
The rock frame properties were used as input to calculate the effects of fluid substitution on seismic elastic properties in the three wells (Kubwa-1, Mbawa-1, and Pomboo-1) when subjected to the various model scenarios. Tables 3, 4, and 5 show the input parameters and effects on the elastic rock properties under different saturation scenarios.
| Input | Scenarios | Output | ||||||||
|---|---|---|---|---|---|---|---|---|---|---|
| Elastic rock properties | Elastic rock properties | |||||||||
| VP (m/s) | 3511 | Oil | Gas | Brine | ||||||
| VS (m/s) | 2084 | VP (m/s) | 3763 | 3640 | 3740 | |||||
| ρ (g/cm3) | 2.42 | VS (m/s) | 2040 | 2052 | 2017 | |||||
| ρ(g/cm3) | 2.32 | 2.29 | 2.37 | |||||||
| Mineral data | ||||||||||
| Mineral | % | Kmin (Mpa) | ρ (kg/m3) | |||||||
| Quartz | 93 | 35,981 | 2640 | |||||||
| Clay | 7 | 35,000 | 2680 | |||||||
| Initial fluid data | Final fluid data | |||||||||
| % | % | Oil | Gas | |||||||
| Water | 44 | Sw | 25 | 25 | ||||||
| Oil | 28 | So | 70 | 5 | ||||||
| Gas | 28 | Sg | 5 | 70 | ||||||
| The water scenario is always 100% | ||||||||||
| Input | Scenarios | Output | ||||||||
|---|---|---|---|---|---|---|---|---|---|---|
| Elastic rock properties | Elastic rock properties | |||||||||
| VP (m/s) | 2462 | Oil | Gas | Brine | ||||||
| VS (m/s) | 1488 | VP (m/s) | 1883 | 1606 | 2152 | |||||
| ρ (g/cm3) | 2.58 | VS (m/s) | 1463 | 1476 | 1452 | |||||
| ρ(g/cm3) | 2.34 | 2.26 | 2.49 | |||||||
| Mineral data | ||||||||||
| Mineral | % | Kmin (Mpa) | ρ (kg/m3) | |||||||
| Quartz | 77 | 35,981 | 2640 | |||||||
| Clay | 23 | 35,000 | 2680 | |||||||
| Initial fluid data | Final fluid data | |||||||||
| % | % | Oil | Gas | |||||||
| Water | 22 | Sw | 25 | 25 | ||||||
| Oil | 39 | So | 70 | 5 | ||||||
| Gas | 39 | Sg | 5 | 70 | ||||||
| The water scenario is always 100% | ||||||||||
| Input | Scenarios | Output | ||||||||
|---|---|---|---|---|---|---|---|---|---|---|
| Elastic rock properties | Elastic rock properties | |||||||||
| VP (m/s) | 3274 | Oil | Gas | Brine | ||||||
| VS (m/s) | 2292 | VP (m/s) | 3560 | 3480 | 3654 | |||||
| ρ (g/cm3) | 2.46 | VS (m/s) | 2202 | 2240 | 2160 | |||||
| ρ (g/cm3) | 2.32 | 2.24 | 2.38 | |||||||
| Mineral data | ||||||||||
| Mineral | % | Kmin (Mpa) | ρ (kg/m3) | |||||||
| Quartz | 73 | 35,981 | 2640 | |||||||
| Clay | 27 | 35,000 | 2680 | |||||||
| Initial fluid data | Final fluid data | |||||||||
| % | % | Oil | Gas | |||||||
| Water | 56 | Sw | 25 | 25 | ||||||
| Oil | 22 | So | 70 | 5 | ||||||
| Gas | 22 | Sg | 5 | 70 | ||||||
| The water scenario is always 100% | ||||||||||
Tables 3, 4, and 5 show changes in seismic properties under different fluid saturation scenarios.
5. Discussion
The analysis of petrophysical properties demonstrated the effectiveness of using G.R. and R.T. logs for lithology and fluid discrimination. High G.R. and low R.T. values indicated shale, while low G.R. and high R.T. values pointed to hydrocarbon zones.
Cross-plot analysis of petrophysical parameters and rock properties is a powerful tool for lithology and fluid discrimination. Different property pairs were found to be sensitive to lithological and fluid changes, aiding in detailed reservoir characterization. Using selected color codes, the cross-plotted petrophysical parameters and pairs of rock properties reflected the various litho-units and fluid types with varied sensitivity. This is because elastic parameters such as shear and bulk modulus, density, P-wave impedance, and S-wave impedance are routinely used to discriminate lithology since they are sensitive to lithological changes. Conversely, Vp/Vs ratio, Lamé constants, elastic wave velocity, and Poisson’s ratio are leveraged in discriminating fluids in hydrocarbon reservoirs since they are sensitive to fluid changes. The best property pairs were preferred for the present study analysis. Cross-plotting mu-rho against density separated the data clusters into three zones (hydrocarbon sand, brine sand, and shale) since shale has a higher density than sand and brine is denser than hydrocarbon. Mu-rho and density are good at discriminating lithology, with density being good at discriminating fluids as well. Therefore, the orange ellipse indicates shale, the red shows brine-saturated sand, and the green represents the hydrocarbon-bearing zone (Figure 5). From the cross-plot of acoustic impedance against lambda-rho, the hydrocarbon zone shows a low acoustic impedance of about 8500–10500 g.ft/cm3.s and low lambda-rho compared to brine-saturated sand and shale regions, as confirmed by the effective porosity color code (Figure 6). Data cluster analysis in the lambda-rho against mu-rho cross-plot suggests the presence of gas-saturated sand as it occupies the lower values of lambda-rho, a measure of incompressibility (Figure 7). Lambda-rho against Vp/Vs cross-plot signifies that lambda-rho is more robust in discriminating the fluid type and lithology than the velocity ratio. The hydrocarbon zone likely to be gas is shown by low values of lambda-rho and Vp/Vs (Figure 8). The Vp/Vs ratio against the acoustic impedance cross-plot discriminates the lithology, especially along the acoustic impedance axis. The acoustic impedance value is highest in the shale zone and lowest in the hydrocarbon-bearing sand region, with the lowest and highest effective porosity values, respectively (Figure 9). Cross-plotting velocity against porosity indicates that the reservoir consists of friable sandstones given the velocity and final effective porosity range values (Figure 10). From the data cluster analyses of the models, it can be noted that, generally, hydrocarbon-saturated zones have low density, acoustic impedance, mu-rho, and lambda-rho. Brine-saturated regions are associated with low acoustic impedance and mu-rho values and relatively higher lambda-rho values. Shale zones are indicated at high values of density, acoustic impedance, mu-rho, and lambda-rho. When the reservoir properties, water saturation (Sw), porosity (φ), and G.R. response, are used as color codes in the cross-plots, hydrocarbon-bearing zones indicate relatively low Sw and G.R. with high porosity values compared to brine-saturated regions and shale zones (Figures 5, 6, 7, 8, 9, and 10). Cross-plot analysis of petrophysical parameters and rock properties is a powerful tool for lithology and fluid discrimination. Different pairs of properties are sensitive to changes in lithology and fluid content, as explained in the text. These interpretations are supported by the principles of rock physics and have been widely used in reservoir characterization studies.
Gassmann fluid substitution was performed on the shallow marine reservoirs in the three studied wells to model the seismic velocity and density at different water saturation levels. Equation (1) was used within Petrel software to calculate the effects of fluid substitution on seismic elastic properties using the rock frame properties. The input parameters, such as the dry porous rock frame’s bulk modulus (Kdry), the pore fluid’s bulk modulus (Kfluid), the mineral matrix’s bulk modulus (Kmin), and the porosity of the rock (∅), were determined from the well log data and remained constant during the fluid substitution process. The porosity was determined from both well log data and core data analyses. The primary inputs consisting of the compressional slowness (1/Vp), shear slowness (1/Vs), and bulk density (ρ) represented the saturated rock properties.
Tables 3, 4, and 5 show the changes observed when saturation levels were varied in the three model scenarios. In the oil case, 70% oil, 25% water, and 5% gas saturations were used. For the gas case, 70% gas, 25% water, and 5% oil saturations were used. In the water scenario, 100% water and 0% oil and gas were used. Rock frame properties shown in Table 2 were used in the three wells, respectively. Compressional velocity (Vp) is higher when the rock is water saturated than when dry or saturated with gas in Kubwa-1 and Pomboo-1, while in Mbawa-1, it is highest in dry rock. Conversely, shear velocity, with slight changes, indicated a higher value in the dry or gas-saturated case than in the oil-saturated or water-saturated case in Kubwa-1 and Mbawa-1. Generally, there is a notable decrease in compressional velocity in Mbawa-1 and a notable increase in Kubwa-1 and Pomboo-1 when brine saturation increases. The density was reduced in the three wells when saturation was increased. Shear velocity in the three wells indicated slight changes, with the highest values seen when the rock is dry than when fluid was saturated in all the wells. Gassmann fluid substitution modeling allowed for the evaluation of the effects of different fluid scenarios on elastic rock properties. By simulating fluid substitution scenarios, the study assessed how changes in fluid content impacted seismic properties such as velocity and density. This provided valuable insights into reservoir behavior and fluid dynamics. The interpretation of fluid substitution results provides detailed insights into how seismic properties vary under different saturation scenarios. Analyzing changes in compressional velocity, shear velocity, and density helps understand the effects of fluid saturation on reservoir properties. These interpretations are supported by the results presented in Tables 3, 4, and 5 and contribute to a deeper understanding of reservoir behavior.
Integrating petrophysical analysis and rock physics models offers a comprehensive understanding of lithology, fluid content, and reservoir behavior, enhancing the overall reservoir characterization process.
The integrated approach is applicable in hydrocarbon exploration and production since it can aid in identifying potential oil and gas reservoirs as well as determining the viability of extraction. The understanding of the petrophysical properties and rock physics of the basin can be used by energy companies to develop more efficient field development plans, optimizing the production of hydrocarbons. The findings of this study can be applied in mitigating the risk of drilling dry wells. The study contributes to the creation of more accurate geological models of the Lamu Basin. These models can be used not only for hydrocarbon exploration but also for understanding the geological history and structure of the region.
This study leverages advanced petrophysical and rock physics approaches, contributing to the development and application of cutting-edge technologies in geological studies and hydrocarbon exploration. The study adds to the scientific understanding of the Lamu Basin, which has been relatively underexplored compared to other regions. This can lead to new insights into the geology and potential resources of the area. Findings from the study could have implications beyond Kenya, providing data that might be relevant to neighboring regions with similar geological settings. The study is vital for making informed decisions regarding hydrocarbon exploration, production, and management in the Lamu Basin, with broad implications for Kenya’s economic development, energy security, and environmental sustainability.
While the study on characterizing hydrocarbon reservoirs in Kenya’s Lamu Basin is crucial, it is constrained by limitations related to data quality, geological complexity, technological and financial constraints, and inherent uncertainties in interpretation [14]. Addressing these limitations would require additional data acquisition, advanced modeling techniques, and possibly further exploration to validate the study’s findings. The accuracy of the study heavily relies on the availability and quality of subsurface data, including well logs, seismic data, and core samples. In regions like the Lamu Basin, where exploration may be relatively new, the available data might be sparse, outdated, or of varying quality.
6. Conclusions
The target reservoirs intercepted in the wells were delineated and characterized by integrating the petrophysical analysis and rock physics model results using the triple combo logging suite.
The delineated reservoirs, which are mainly turbidite sand and calcareous sand, exhibited good reservoir characteristics: low shale volume (0.07–0.26), low water saturation (0.23–0.56), high effective porosity (0.12–0.25), and a net thickness (18.95–43.224 m).
These findings compare well with the Upper Qishn clastic reservoir petrophysical properties whereby the overall average porosity of 14.62%–24.2% and the water saturation of about 50%–84.1% were found. Both petrophysical and rock physics analyses were applied in delineating reservoir zones.
Cluster analyses from the rock physics cross-plot models aided in the lithology delineation and the reservoir fluid discrimination. The integrated approach of utilizing petrophysical analysis and rock physics models can be leveraged to predict reservoir lithology and fluid content even away from the wells when used together with other rock attributes. Gassmann fluid substitution was used to calculate the fluid effect on elastic rock properties from the rock frame properties. The behavior of clean reservoir zone saturation scenarios resulting from the brine, oil, and gas fluid substitution models was measured. The values indicate that fluid substitution has a greater effect on compressional velocity than on shear velocity and density (ρ) significantly decreased when hydrocarbons replaced water saturation in the wells. Shear wave velocity (Vs) indicated a slight change in all the wells.
This study provides results that can be used to mitigate the hydrocarbon exploration risks of drilling dry wells by increasing the chances of hitting the reservoir targets in the Lamu offshore basin, which has a limited number of drilled wells, most of which are dry holes.
A related study conducted in the North Sea, particularly in areas known for turbidite deposition such as the Norwegian continental shelf, employed integrated approaches combining petrophysical analysis and rock physics models to characterize reservoirs and minimize exploration risks [44]. The study concluded that an integrated approach including the use of fluid substitution models provided results that could contribute to reducing exploration risks and improving the success rate of drilling operations in areas with limited well data or a history of dry wells.
Conflicts of Interest
The authors declare no conflicts of interest.
Funding
This research is financially supported by the authors.
Acknowledgments
We appreciate the National Oil Corporation of Kenya (NOCK) for providing the data required for this study and a chance to use the workstations and software within their premises.
Open Research
Data Availability Statement
The well log data used to support the findings of this study have not been made available because it is classified as confidential. However, requests for access to these data should be made to the National oil Cooperation of Kenya Datacenter via the National Oil Corporation of Kenya. KAWI house—South C, Popo Lane, Off Red Cross Road PO Box 58567—00200 Nairobi, Kenya.


