Sustainable Development and Flood Risk Assessment in Haripur District: A Multicriteria Analysis Using AHP and Geospatial Techniques
Abstract
Extreme flooding is becoming a more serious hazard to the world’s infrastructure, especially in high-risk locations, and is linked to global warming and human activity. This research employs an analytical hierarchy process (AHP) model and geographic information system (GIS) analysis to delineate flood risk zones. An eight-factor multiparametric method to flood risk susceptibility mapping includes precipitation, distance to river, the slope, elevation, land use/cover, topographic wetness index, type of soil, and curvature. An urban flood risk index (UFRI) is established based on vulnerability mapping, revealing that approximately 33% of Haripur District, Khyber Pakhtunkhwa, Pakistan, is prone to floods. Additionally, land use cover analysis indicates that 23% of the crop area in Haripur District is at risk from flood disasters. Recognizing the potential for costly damage to infrastructure, flood hazard mapping serves as a valuable tool to prioritize risk areas for urban and agricultural development. The outcomes of this study are anticipated to significantly contribute to predisaster flood control management in the studied area.
1. Introduction
Many countries now feel more vulnerable because of the rising frequency and intensity of extreme weather events connected to global climate change, such as storms and extreme weather [1–3]. Climate change manifests through various impacts such as increased floods, rising sea levels, glacier melting, wildfires, and droughts. With considerable uncertainty in some regions, the intensity of floods is anticipated to escalate globally [4, 5]. It is interesting to note that, between 1993 and 2004, floods affected around 2.5 billion people and accounted for 43% of all documented natural disasters [6]. The main causes of the rise in flooding incidents are population growth, climate change, and changes in land use [7, 8].
Pakistan faces major challenges as its population, currently the fifth highest in the world, is expected to increase to 250 million by 2025. The nation has seen about 19 major flood catastrophes in the last 60 years, which influenced 166,075 locations, flooded over 594,701 km2, caused damages of roughly $30 billion, and lost 10,669 lives [9, 10]. Although it is not possible to completely prevent floods, there are ways to reduce the risks they bring with them through careful planning and mitigation techniques. Studies indicate that by identifying flood-prone areas and implementing complete risk reduction strategies both structural and nonstructural, it is possible to significantly reduce losses [11].
Mapping flood hazards is an essential first step in strategic development for places that are susceptible to flooding [12]. These maps play a crucial role in quickly identifying susceptible regions and in prioritizing mitigation and response measures. Flood hazard mapping is crucial for the monitoring and forecasting of flood risks, which are necessary for the effective management of floods and the environment. Flood danger maps have an impact on city spatial design and development, which goes beyond crisis management and emphasizes the importance of drainage systems and stringent construction requirements. Plans for land use in flood-prone areas are also influenced by them [13–15].
To assess flood susceptibility, researchers employ a range of models, as demonstrated in Bangladesh, India, and Turkey [16–22]. Conventional methods of mapping flood hazards are often tested by a lack of data, which may be costly and time-consuming to collect, particularly in poor countries. For hazard management, prediction, and flood zoning, however, satellite imagery and geographic information systems (GISs) are dynamic tools that offer a range of data [23, 24]. GISs are particularly helpful for managing the vast volumes of geographical data required for flood simulation since natural disasters are multidimensional [25].
Researchers frequently rely on GIS, artificial intelligence, and the analytical hierarchy process (AHP) to estimate flood risk [26]. Studies indicate that the integration of AHP and GIS is effective in assessing and mapping flood risk. One such research was conducted by Ouma and Tateishi in Kenya [25] which outlines a method for assessing urban flood risk by integrating AHP with GIS tools, demonstrating its effectiveness through a case study to improve flood management and preparedness. Through this research, several elements that affect floods have been found, including cumulative runoff, distance from water drainage networks, elevation, land use, rainfall density, and geology [27–29].
Turkey’s second most frequent source of overall impacts is flooding, which emphasizes how important it is to effectively analyze and manage flood risk. Catastrophic flooding has also caused significant losses in terms of money lost and lives lost in other countries, including Bangladesh. For instance, the 2017 floods in Bangladesh affected millions of people and claimed many lives [30]. Simultaneously, India has experienced horrific floods that have severely damaged communities and infrastructure, particularly in the states of Kerala in 2018 and Assam in 2020 [31].
The current study looks into flood risk assessment and creation of susceptibility maps by a multicriteria analysis model AHP at Haripur District, Khyber Pakhtunkhwa State, in Pakistan implemented using geoinformation technologies for sustainable agriculture, urban expansion, and infrastructure development. To lessen socioeconomic losses and enhance flood management strategies, the study is aimed at establishing an urban flood risk index (UFRI) using ArcGIS and AHP, constructing a hierarchical structure for flood risk analysis, using theme maps to identify potential flood zones in Haripur District, and creating flood hazard maps.
2. Material and Methods
2.1. Study Area
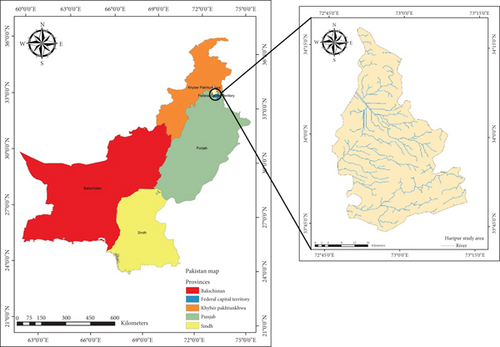
In Pakistan’s Khyber Pakhtunkhwa region, the intriguing Haripur District is situated next to the well-known Tarbela Dam. Situated in the northwest of the country, Haripur borders the picturesque Tarbela Lake to the east and the rocky Tarbela Hills to the west. Poking about the center of the district yields its precise geographic coordinates, which are roughly 33.9946° N and 72.9106° E as shown in Figure 1. Haripur’s climate is a balanced combination of mild summers and brisk winters. May through September is considered summer, when temperatures range from 25 to 36°C. Winter, on the other hand, with temperatures between 5 and 15°C is from November to March. The average yearly rainfall of Haripur is around 700 mm.
The Tarbela Hills claim the greatest altitudes in Haripur’s topographical tapestry, which has a mixture of plains and hills. Notable summits include Indus Bluff (3800 m), Ghazi Hill (4200 m), and Tarbela Peak (4500 m). A network of passes runs through this area, including the Ghazi Pass (2000 m) to the southward, the Khanpur Pass (1100 m) to the east of the region, and the Tarbela Pass (2800 m) to the west of the area.
From a hydrological perspective, Haripur moves in time with the Indus River and its tributaries. The river meanders across the district after rising from the highlands to the north and joining the powerful Indus. The district’s water resources are essential economic pillars that enable agriculture and hydroelectric power production.
Haripur’s geological nature is woven together with a rich history of deposits of metamorphic, sedimentary, and igneous rocks that span the Paleozoic to the Cenozoic eras. Rocks that are sedimentary, such as limestone, sandstone, and shale, reveal hints about a shallow marine environment that existed in the Paleozoic. Concurrently, the Himalayan orogeny’s turbulent tectonic activity is attested to by metamorphic rocks including marble, gneiss, and schist. The Cenozoic era’s intrusions of granite and diorite give this geological tale further complexities.
With aquifers primarily tucked away in porous, unconsolidated sedimentary rocks, Haripur’s hydrogeological canvas is a complex work of art. Like underground reservoirs, these aquifers are fed by the seasonal cycle of precipitation and melting snow. The district’s geography and geological structure direct the flow of groundwater, which is expressed through wells, both simple and manually drilled, to suit agricultural and home demands. Springs are nature’s fountains, undiscovered treasures nestled in the hills’ embrace that add to the mosaic of irrigation and drinking water.
Notwithstanding this wealth of nature, Haripur is not without its problems. Groundwater’s pure purity and plentiful supply are belied by the encroaching urbanization, the silent demise of woods, and the sneaky march of pollution. With Haripur starting the process of creating a flood danger map, the urgent need for efficient management solutions is more important than ever. This project is aimed at protecting the very essence of Haripur’s groundwater resources in addition to mapping any hazards. It is closely related to the region’s distinct geographic and climatic characteristics.
2.2. Data Collection and Model Setup
We examine factors that influenced the production of AHP–GIS-based maps in this work, together with morphometric and topographic components. It is important to recognize that the selection of variables for the multiparametric AHP model is heavily influenced by the characteristics of the flood. The factors that were chosen for vulnerability analysis are listed in Table 1, along with the related risk categories and each one’s proportional relevance. A key component of multicriteria decision analysis is spatially referenced criteria [30]. The AHP makes it easier to choose projects, activities, plans, or alternatives based on quantitative criteria by fusing objective assessments with empirical facts. Decisions can be made analytically or intuitively; according to Saaty [32], analytical judgments entail formulating an opinion, weighing alternatives, or comparing each option to an ideal; intuitive conclusions, on the other hand, are completely subjective and without logical foundation. The latter supports the study’s choices as it is consistent with the AHP.
| Unit | Class | Class ranges/flood probability | Class ratings | Percentage weight | |
|---|---|---|---|---|---|
| Topographic wetness index | Level | −5.2 to 2.2 | Very low | 1 | 5 |
| 2.3–5.2 | Low | 2 | |||
| 5.3–7.3 | Moderate | 3 | |||
| 7.4–9.8 | High | 4 | |||
| 9.9–20 | Very high | 5 | |||
| Slope | % | 0–8.5 | Very high | 5 | 16 |
| 8.5–20 | High | 4 | |||
| 20–34 | Moderate | 3 | |||
| 34–47 | Low | 2 | |||
| 47–65.8 | Very low | 1 | |||
| Elevation | Meter (m) | 420–580 | Very high | 5 | 13 |
| 580–810 | High | 4 | |||
| 810–1100 | Moderate | 3 | |||
| 1100–1500 | Low | 2 | |||
| 1500–8110 | Very low | 1 | |||
| Distance from river | Meter (m) | 0–140 | Very high | 5 | 23 |
| 140–290 | High | 4 | |||
| 290–430 | Moderate | 3 | |||
| 430–570 | Low | 2 | |||
| 570–791 | Very low | 1 | |||
| Soil type | Level | 23 | Very low | 1 | 3 |
| 27 | Moderate | 3 | |||
| 41 | Very high | 5 | |||
| LULC | Level | Water | Very high | 5 | 9 |
| Trees | High | 4 | |||
| Crops | High | 3 | |||
| Built area | Low | 2 | |||
| Clouds | Low | 2 | |||
| Bare lands | Very low | 1 | |||
| NDVI | Level | −0.0029 to 0.0663 | Very high | 5 | 3 |
| 0.0663–0.0898 | High | 4 | |||
| 0.0898–0.1120 | Moderate | 3 | |||
| 0.1120–0.1473 | Low | 2 | |||
| 0.1473–0.3302 | Very low | 1 | |||
| Curvature | Level | Concave (−10 to 1) | Very low | 1 | 1 |
| Flat (−0.9 to 0.54) | Very high | 5 | |||
| Convex (0.55–11) | Moderate | 3 | |||
| Rainfall | mm/year | 2138–2196 | Very low | 1 | 27 |
| 2197–2255 | Low | 2 | |||
| 2256–2313 | Moderate | 3 | |||
| 2314–2371 | High | 4 | |||
| 2372–2430 | Very high | 5 | |||
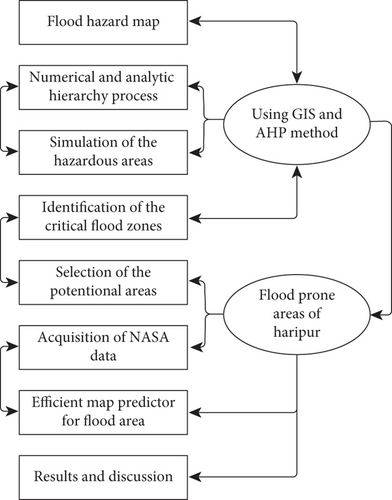
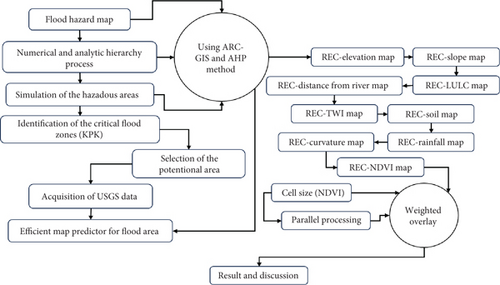
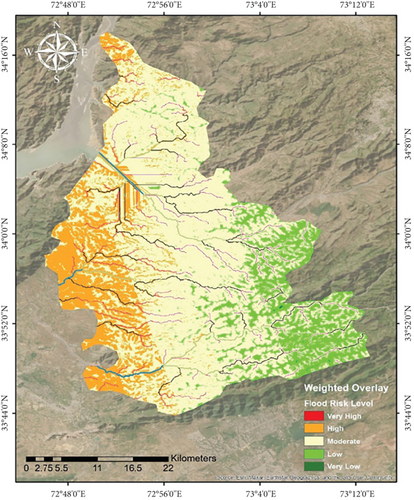
The significance of the research components for causing floods in the studied region was taken into consideration while choosing them. The following factors were considered: land use and land cover (LULC) data, yearly rainfall distribution, elevation and slope, soil types, and the topographic wetness index (TWI) [33]. The flood hazard map of Haripur is based on United States Geological Survey (USGS) methods to reveal and classify the risks using NASA Earth data along with Environmental Systems Research Institute (Esri) LULC data combined in ArcGIS software. The AHP was then utilized for weighted overlay analysis, resulting in the production of the final flood danger map, which is seen in Figure 2.
2.3. Elevation and Slope
Slope acts as a very important factor in managing direction while directing surface or subsurface drainage is directed an exit point. The relationship of lithology, structure type of soil, and drainage is controlled by the slope angles which in turn are influenced through being determined based on overall geometry. While flatter surfaces deal with water collection, steeper slopes present problems with greater surface runoff. Local depressions are more prone to pluvial floods; these are depicted by digital elevation model (DEM) cells with elevations lower than adjacent areas. This emphasizes how vital it is to comprehend how ground elevation and flood dangers are related [33].
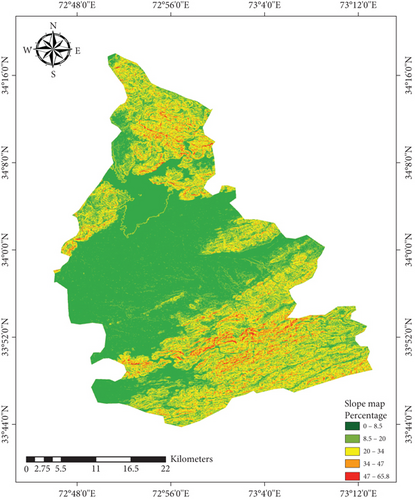
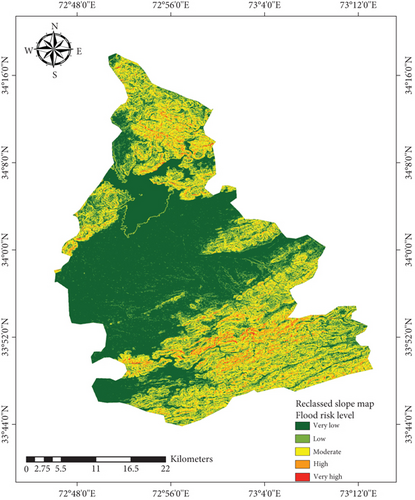
For this analysis, a slope map was developed using the DEM generated from ArcGIS and with various slope-producing tools. This approach was based on the DEM for the research region, which was obtained from the USGS (https://www.usgs.gov/). There is an intricate relationship between runoff speed and slope that influences the frequency of disastrous floods. Water-penetrating speed decreases for steeper slopes, and the water flow rate and velocity are more likely to increase. This is because water builds up as it runs downslope, and floods normally arise in low-lying areas. Therefore, slope length affects both the potential for flooding and actual flooded areas.
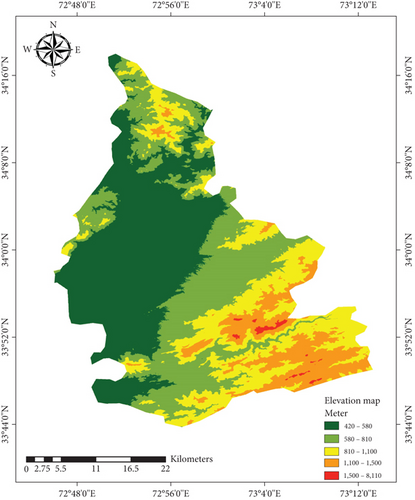
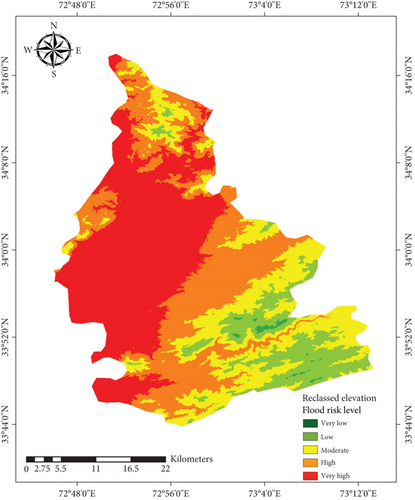
Elevation and flood danger are correlated, with cells located at lower altitudes experiencing more flooding risk [25]. Five classifications were created based on the elevation, which ranged from 420 to 8110 m. Likewise, the natural break technique was used to divide the research area’s slope range (0°–65.8°) into five classes, with percentages assigned to the following categories: “0,” “0–8.5,” “8.5–20,” “20–34,” “34–47,” and “47–65.8.” Figures 3(a), 3(b), 3(c), and 3(d) display the preliminary and reclassified elevation and slope maps for the Haripur District.
2.4. Land Use Types
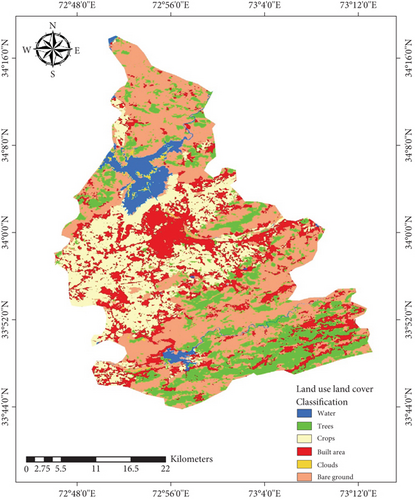
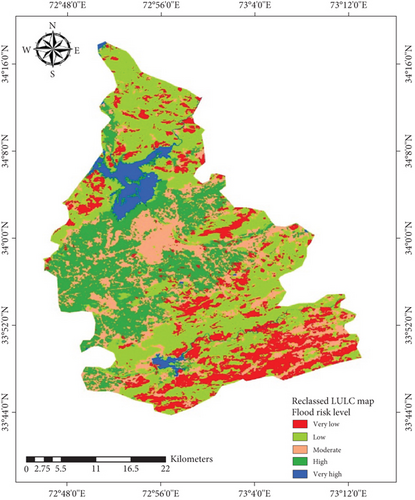
The amount of rainfall and runoff generated is directly correlated with various kinds of land use. Because vegetation absorbs precipitation, land cover has a significant influence on how frequently floods occur. Since high-resolution land use data specific to the research region were not accessible, the land cover information was taken from the Esri land cover dataset (https://www.esri.com). The division of the land uses into five different classes was highly influenced by vegetation cover. Understanding the various ways that different locations contribute to rainfall–runoff and possible floods depends on the choice of land use categories. The study attempts to evaluate the influence of these categories on the frequency and intensity of floods in the Haripur region by using the Esri land cover dataset, which offers detailed information on several land cover types. It is important to remember that the specifics of the research region and the granularity of the information impact the selection of land use categories. These categories include, as shown graphically in Figure 4, (i) water bodies, (ii) trees, (iii) crops, (iv) built area, (v) clouds, and (vi) barren land.
2.5. Distance From Streams
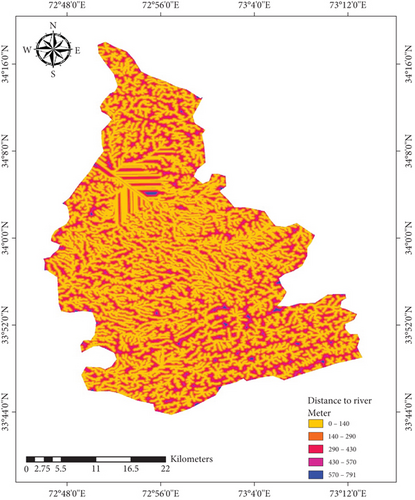
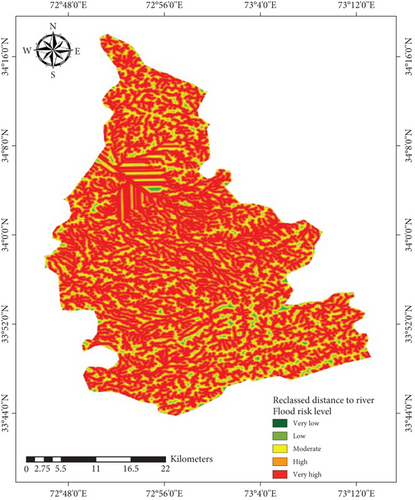
The evaluation of potential risks in a region may be ascertained by analyzing its closeness to adjacent bodies of water. The D8 method and the STRAHLER methodology allow for calibration of streams based on data extracted from satellite imagery, which places first-order label to linkages without tributaries in the STRAHLER technique [34]. Insights for hazard management in the Haripur region are gained from the practical method of classifying distances into danger zones and evaluating the chance of floods. Five danger zones were identified from cells that were located at different distances from streams. Figure 5 shows these zones graphically.
2.6. TWI
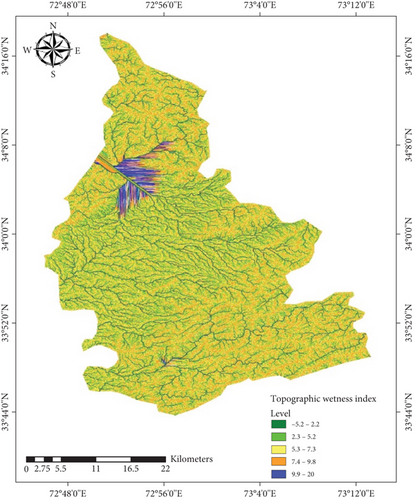
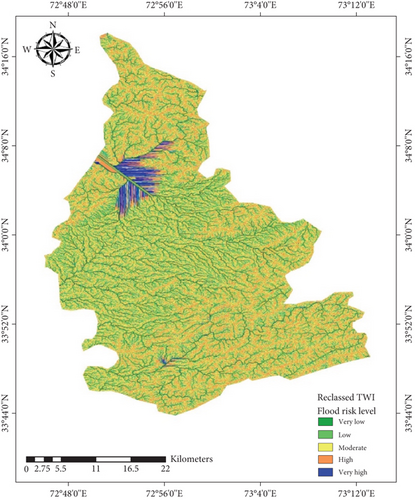
The TWI serves as an indicator measuring the potential accumulation of water, with a higher index reflecting a greater depth of water, particularly in areas with lower slopes, as illustrated in Figure 6. This index provides valuable insights into the water retention capabilities of the terrain. The infiltration process, integral to the generation of rainfall–runoff, is influenced by the hydrolithological formations present in the landscape. TWI, as depicted in Figure 6, offers a visual representation of the terrain’s water accumulation potential. Higher TWI values suggest areas with lower slopes, indicating a propensity for increased water depth due to reduced runoff. Understanding TWI becomes crucial in assessing the landscape’s ability to retain water and the subsequent impact on the rainfall–runoff process. Additionally, the interaction between TWI and hydrolithological formations emphasizes the importance of considering geological and hydrological factors in flood risk assessments within the Haripur region.
2.7. Soil Types and Precipitation
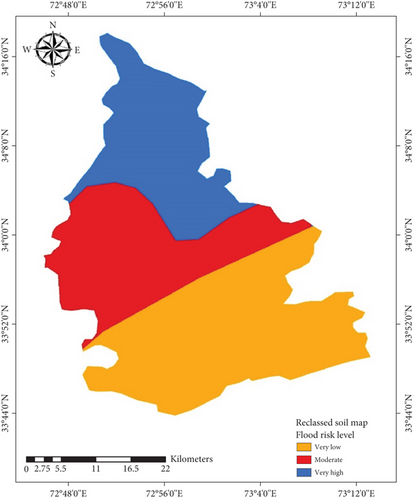
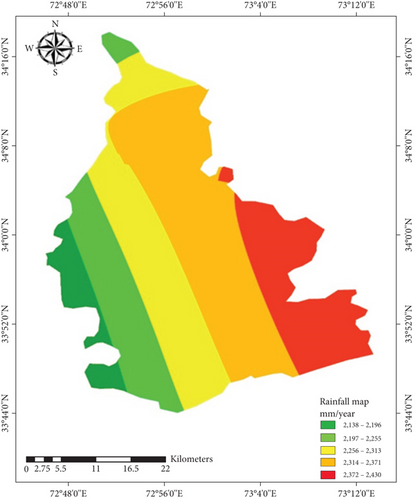
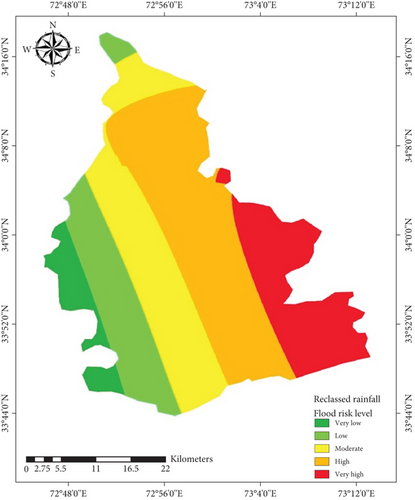
The kind of soil has a significant impact on floods, especially because sandy and clay soils differ greatly in certain aspects. Sandy soils are known for their quick absorption of water and poor drainage. On the other hand, locations with clay soils are more vulnerable to floods because clay soils are less permeable and absorb water for longer periods of time. When precise measurements are not available, the soil’s look and texture can serve as a good indicator of its moisture content. As a critical interaction between the atmosphere and the land surface, the distinction is essential for classifying precipitation into runoff and groundwater storage. Rainfall has a major impact on soil moisture content, which is necessary for stabilizing slopes, promoting crop and plant development, and reducing soil erosion. The soil types in the area greatly influence the amount of water that seeps into the earth and, in turn, determine the direction in which water flows. The ability of a soil to hold water and act like sponge depends upon its structure as well as infiltration capacity; different soils have dissimilar capacities. When there is more surface runoff, floods become inevitable due to low soil penetration. On sloping terrain, runoff happens when water supply rates are higher than the soil’s infiltration capacity, which might result in flooding.
Figure 7 presents the maps showing the research area’s classified soil cover and precipitation. This illustration provides important new information for flood risk assessments in the Haripur area by helping to comprehend the distribution of various soil types and precipitation patterns.

2.8. Curvature and Normalized Difference Vegetation Index (NDVI)
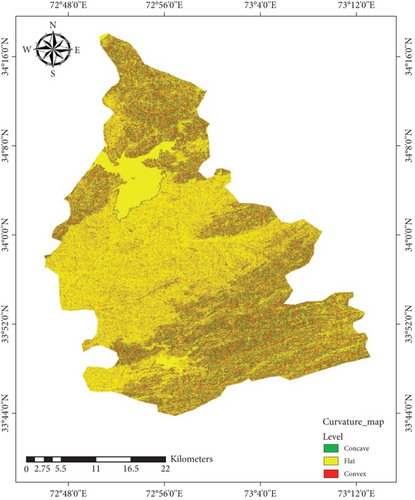
By emphasizing the contour and curve of the slope, the curve feature sheds attention on its profile. This is accomplished by using curve-tracking computations to determine the surface’s concavity or convexity. The second derivative of the surface is used to calculate the curvature. Figure 8 displays the outcomes of the curvature function. The classification of the curvature classes was established through a combination of academic literature and insights obtained from previous flood research [35]. A three-grade scale was employed to standardize the classes, with each class being assigned a positive whole number. The normalizing method ensures a consistent representation of curvature variations across the landscape. Put more simply, the curvature attribute helps determine whether a slope is convex or concave in nature. The categorization method offers a measurable framework for comprehending the curvature patterns and is based on both empirical and scholarly sources. Assessing the terrain’s vulnerability to floods in the Haripur area requires this knowledge.
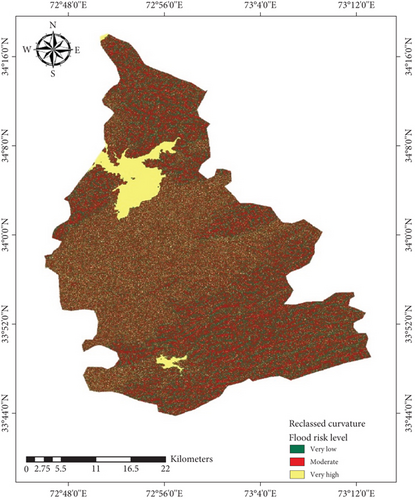
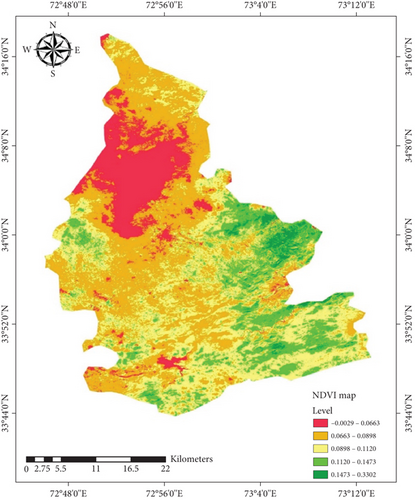
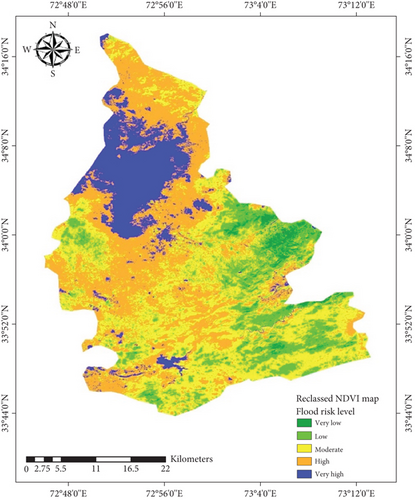
The NDVI is used to assess plant density and health. By using satellite information, the amount of photosynthesis occurring in a region is determined. The NDVI is calculated using satellite sensors to collect visible and near-infrared light.
The NDVI has a range of −1 to +1, where a number near +1 denotes high and healthy vegetation, and a value around −1 denotes low and unhealthy vegetation. Drought, other environmental conditions that may have an impact on plant health, and the development of vegetation are frequently tracked using NDVI measurements. Figure 8 displays the results of the curvature function. First-hand experience from past studies on flood events combined with scholarly literature helped to construct the categories.
2.9. AHP
The analytical process, or AHP, is a key instrument for decision-making in a variety of fields, including business, finance, politics, education, and engineering. It was developed in the 1970s by Thomas L. Saaty, who introduced this method to assist decision-makers in setting priorities and making optimal decisions that involve both qualitative and quantitative factors. Since its inception, AHP has become one of the most widely used approaches in this domain [36].
Extensibility allows AHP to integrate both quantitative and qualitative elements in decision-making that is targeted on determinant basis by users or implementing entities, composed of preference. In AHP, the comparison matrix is transformed into a priority vector; nevertheless, there is an enforced consistency ratio (CR) through the use of any arbitrary index. The decision hierarchy in AHP is structured from the top level (the overall goal) down to the lowest level, which includes specific criteria and alternatives. This hierarchical approach ensures that pairwise comparisons are consistently applied to accurately assess and rank each criterion. The comparison matrix is transformed into a priority vector, with a CR used to verify the reliability of the comparisons. The method integrates both quantitative and qualitative elements, and the results are systematically interpreted to support robust decision-making. The application of AHP with many criteria is easily achieved, and once the hierarchy is established, this method performs a mutual comparison between various criteria. An AHP pairwise comparison matrix provides a comparative analysis; and values approach criteria derived from numbers 1 to 9 whereby number 9 means that it is the most important factor.
A weight-point scale designed for the purpose of assigning weights or priorities to criteria through their importance is referred as relative importance in literature from AHP. For the current study, Table 2 shows details about this scale.
The decision matrix is a factor for comparison of alternatives in accordance with criteria and defining their relative importance according to Table 3. The pairwise assessment matrix, pictured as a 9 × 9 square in Table 4 with the diagonals set to one, computes ratings by means of comparison from each row and all rows. For example, rainfall intensity is more influential than land use represented by one on the corresponding scale. The row shows the impact of land use for this case.
| Intensity | Definition |
|---|---|
| 1 | Equal value |
| 2 | Relative value |
| 3 | Moderate value |
| 4 | Relative value |
| 5 | Strong value |
| 6 | Relative value |
| 7 | Very strong value |
| 8 | Relative value |
| 9 | Extreme value |
| Category | Type | Priority | Rank | (+) | (−) |
|---|---|---|---|---|---|
| 1 | Precipitation | 27.9% | 1 | 11.6% | 11.6% |
| 2 | River’s distance | 23.7% | 2 | 7.8% | 7.8% |
| 3 | Slope | 17.6% | 3 | 8.4% | 8.4% |
| 4 | Elevation | 6.4% | 5 | 4.3% | 4.3% |
| 5 | LULC | 10.0% | 4 | 5.1% | 5.1% |
| 6 | TWI | 5.7% | 6 | 2.3% | 2.3% |
| 7 | NDVI | 3.4% | 7 | 1.2% | 1.2% |
| 8 | Soil | 3.0% | 8 | 1.4% | 1.4% |
| 9 | Curvature | 2.2% | 9 | 1.5% | 1.5% |
| Criteria | Rainfall | Distance to river | Slope | Elevation | LULC | TWI | NDVI | Soil type | Curvature |
|---|---|---|---|---|---|---|---|---|---|
| Precipitation | 1 | 2 | 3 | 3 | 4 | 5 | 6 | 7 | 9 |
| River’s distance | 0.50 | 1 | 2 | 4 | 4 | 6 | 6 | 8 | 8 |
| Slope | 0.33 | 0.5 | 1 | 1 | 3 | 6 | 7 | 7 | 9 |
| Elevation | 0.33 | 0.25 | 1 | 1 | 1 | 1 | 1 | 1 | 1 |
| LULC | 0.25 | 0.25 | 0.33 | 1 | 1 | 2 | 4 | 7 | 8 |
| TWI | 0.20 | 0.17 | 0.17 | 1 | 0.5 | 1 | 2 | 3 | 5 |
| NDVI | 0.17 | 0.17 | 0.14 | 1 | 0.25 | 0.50 | 1 | 1 | 2 |
| Soil type | 0.14 | 0.13 | 0.14 | 1 | 0.14 | 0.33 | 1 | 1 | 2 |
| Curvature | 0.11 | 0.13 | 0.11 | 1 | 0.13 | 0.20 | 0.50 | 0.50 | 1 |
| CFR: 8.1% | |||||||||
After values have been assigned as on a decision matrix, priorities can be calculated and added to the ArcGIS weighted overlay function. These results are then depicted on a map, as in Figure 9.
RI stands for the random consistency index. If the value is below 0.1, then CR reflects an appropriately consistent comparison matrix; otherwise, a participant in this decision-making process repeats until convergence on consistency occurs can be traced towards telling people how well they are doing and why it now matters what one does with another identity that was chosen by one’s choice as to whether or not something should happen when you use both identities. Zero point in the CR interpretation means a perfect consistency.
Where CR = 5%, the fact that AHP using a decision matrix is acceptable within these bounds suggests its accuracy in correlation. A CR value less than 10% implies satisfactory levels.
Although AHP is widely used in the development of reliable hazard maps, its results depend on expert judgment and create conditions for errors that could occur when defining weight criterion. This research incorporates sensitivity analysis to evaluate how variations in the weights of individual criteria impact flood hazard mapping. Sensitivity analysis involves systematically altering the weights assigned to each criterion to assess their influence on the final results. This method helps in understanding how changes in the input parameters affect the overall flood risk predictions.
In this study, we applied the one-at-a-time (OAT) method to adjust the weights of single elements across a range of percentages. This approach allows us to observe how the model’s outcomes change with different weighting scenarios. For instance, we varied the weights of key criteria such as precipitation, slope, and distance to rivers, examining how these changes influenced the flood risk maps.
The results of these modifications are illustrated in Figure 9, which shows the impact of weight variations on flood risk predictions. By analyzing these outcomes, we can identify which criteria have the most significant effect on the results and ensure that our decision-making process remains robust under different conditions. This detailed sensitivity analysis not only reinforces the reliability of our model but also highlights potential areas for improvement in future studies.
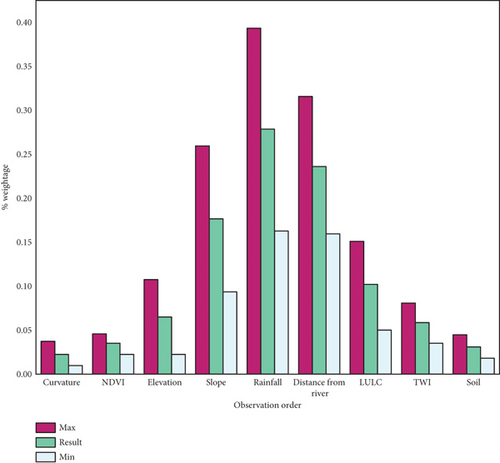
In this study, ranging percent change (RPC) was applied to all criterion weights, integrating an IPC (increase in the percent change) value of 5%, equal to the plus or minus five percentage points from a 20% initial weight.
Calculations of the weights for primary criterion at different levels in percent change involved using Equation (5) are displayed in Figure 9. An interpolation had been applied to each criterion for assigning the mean value in between specified boundaries ensuring accuracy and a standard evaluation procedure as displayed on Figure 10.
W(Cm, 0) denotes the primary criterion’s weight, Cm in the case of a base run, and pc denotes the percent change’s level.
The RPC has a maximum value of RPCmax and a minimum value of RPCmin, with n total criteria (Figure 11).
2.10. Data Acquisition
The maps in this research were created using GIS software, specifically ArcGIS 10.8 developed by Esri. The data sources utilized for this analysis are detailed in Table 5.
| Sr. no. | Data type | Description | Source |
|---|---|---|---|
| 1 | Rainfall data | High-resolution monthly precipitation CRU TS datasets with 0.5 × 0.5° resolution | Climate Research Unit (CRU) Data for UAE [37] |
| 2 | LULC data | Sentinel-2 10-m LULC | Esri Land Cover–ArcGIS Living Atlas [38] |
| 3 | DEM | ASTER Global DEM with 30-m cell size | Earth Data Search, NASA [39] |
| 4 | NDVI sata | Level 1 Landsat Collection 2 (Landsat 8–9 OLI/TIRS C2 L1) | USGS Earth Explorer, United States Geological Survey [40] |
| 5 | Soil data | Global digital soil map: Esri shapefile format with 5 × 5 pixel resolution | FAO Map Catalog, Food and Agricultural Organization of the United Nations [41] |
3. Results
The study’s findings demonstrate the significant influences that elevation, slope, rainfall, and the vicinity of rivers have on the risk of flooding in the investigated region. A closer look at the elevation chart shows that because of the water’s natural tendency to flow towards these lower elevations, areas that are lower lying are more susceptible to flooding. When it rains a lot, this vulnerability is more apparent. The map of the slope shows that areas with a higher degree reveal themselves as more prone to flash flood risk. These conclusions are supported by rainfall data, which shows that severe monsoon season precipitation is the main reason behind floods. Along the plain areas next to rivers are more prone towards flooding as it is shown in Figure 11.
The other parameters, which include soil type, curvature, NDVI, TWI, and LULC, have less of an effect on floods. Based on the curvature map, locations that are concave have a higher probability of flooding due to their ability to hold water. These regions typically have little vegetation or appear to be barren ground, and because of unregulated water flow, they show negative values on the NDVI map and are more susceptible to floods. Soil erosion and landslides might happen in such circumstances.
Consequently, higher TWI values indicate retention of water and hence increase the likelihood for flooding. According to a LULC study, surfaces with vegetation and water close to rivers are more prone. In addition, clayey soils drain at a much slower rate than other types of soil implying that water accumulation in the case of flooding takes longer and increases home chances.
3.1. Factors Affecting the Flood Hazard Assessment
Nine factors were used to create the flood danger map: distinct soils, NDVI rate, TWI score, LULC features, heightening, elevation, grade, rainfall, and river proximity. There, the AHP process was over for them. It was possible to achieve CR = 8.1% < 10% at acceptable limits. Table 1 shows the suggested scores and weights for each of these criteria. The five flood threat levels, namely, very low, low, moderate, high, and very high, are arranged in the rising order of severity.
GIS–AHP on the other hand was given a greater weight value over NDVI, TWI, etc. A flood hazard map was recast for every parameter. Combining the two inputs after superimposing yielded extreme flood risk of 0.01% very high and 19.39% high for that area, while its moderate and low sections were, respectively, estimated to be 68.03% or medium 12.52%or mild and finally just a mere measly 0.04%, under which it became too small an amount even the table classifies the area under different danger zones as shown in Table 6.
| Criteria (flood risk) | Area (ha) | Percentage |
|---|---|---|
| Very high | 17.22 | 0.01% |
| High | 25,691.84 | 19.39% |
| Moderate | 90,121.41 | 68.03% |
| Low | 16,591.86 | 12.52% |
| Very low | 50.02 | 0.04% |
| Total | 132,472.35 | 100% |
3.2. Map of Potential Flooding Hazards
Using the flood hazard assessment methods discussed in previous sections, flood hazard maps were created. To classify the maps, the standard deviation method was utilized. The flood hazard assessment of the study region has divided it into five categories, which are “very high,” “high,” “moderate,” “low,” and “very low” flood risk zones. That can be observed in Figure 11. The study area’s northwest and southwest, which is the most populous region in the Haripur District, are covered by the high flood risk zone. In the center of the map, there is either a moderate or low flood danger. The southwest and northwest sides have a significant danger of flooding since they are prone to flash floods.
Rainfall is the main element determining a region’s vulnerability to floods. A major factor in the amount of damage caused by flooding is the downstream water flow velocity. Since gravitational forces are the primary cause of flooding in the area under investigation, slope and elevation are important factors in determining the velocity and path of water movement over the research area. The water builds velocity down the hill with more frequent rainstorms, increasing the peak speed.
The utilization of various approaches and strategies to create the danger map has the benefit of providing a thorough depiction. The outcome is a danger map that is easy to understand and use, making it an excellent choice for use in areas where source data is scarce. Flood risk zones, which vary from high to low, are displayed in Tables 7 and 6 based on the category area predictions.
| Study area (district) | Total area (ha) | Area under high risk (ha) |
|---|---|---|
| Haripur | 172,500.93 | 132,472.35 |
Over 19.39% of the region is at high danger of flooding, according to Table 7. Planned building should be done in certain regions to reduce the negative consequences of floods. Everything that has encroached should be destroyed, especially the areas close to the riverbank. In areas where it will lessen the risk, a wall protecting against flooding should be built.
3.3. Methodological Constraints and Recommendations
The feasibility of the selected method and its challenges on it stands undiminished factually adopted by developing a tailored flood susceptibility map for Haripur District, which proves to be an irreplaceable tool for development planning and decision-making. In particular, the use of medium-resolution images (SRTM (Shuttle Radar Topography Mission) 30 m) and subjective assignment of coasts to individual parameters is presented by natural problems. Although these limitations are recognized, the results that were generated in this map matter for administrative powers and also to decentralized communities. A third level of complexity is added by the trade-off between accuracy in the study and the medium-resolution image (SRTM 30 m). Together with subjective attribution to coastal areas, it increases uncertainty. However, there is optimism that this flood vulnerability map for a densely populated area could contribute to enhancing living conditions. The investigation’s results not only shed light on the existing issues with sanitation and environmental management but also present viable solutions. It is crucial to note that the development of the flood susceptibility map heavily relied on onsite observations, providing a practical foundation for the research. While recognizing the need for improvement, future studies should address identified discrepancies and explore alternative models to enhance accuracy and minimize error margins. This innovative assessment of flood susceptibility in the Haripur District watershed marks a significant milestone, considering global trends and incorporating various environmental variables such as rainfall, geology, and SRTM data. These insights empower development stakeholders, governmental organizations, and decentralized communities to better coordinate their efforts, laying the groundwork for addressing flooding issues. Moving forward, it is recommended to refine the process using insights gained from this study and experimenting with alternative models. This iterative approach is aimed at aligning the technique with the dynamic character of the region, ultimately improving the accuracy of flood vulnerability assessments. Consequently, this research contributes to advancing our understanding of flood risk and provides a comprehensive grasp of the biological dynamics within the Haripur District watershed.
3.4. Model Validation
Model validation is an essential step in which the results from a model to independent real-world observations are systemically compared. This detailed assessment seeks to measure the preciseness and reproducibility of model projections from a quantity and quality standpoint. In the domain of flood susceptibility assessment, researchers make use of various kinds of models to assess various regions’ vulnerability to flood. Nevertheless, it is mandatory to verify these models through comparison of their results against real experimental data or truth observations. First, by calibrating and validating the model with observable data, researchers guarantee its viable integrity towards actual conditions that increased the model’s reliability for later risk assessments. In July 2011, a project for disaster risk mapping was launched in the Haripur District led by the National Rural Support Program (NRSP) and Diakonie as a German international nongovernmental organization (INGO). The goal was to evaluate the susceptibility of 11 chosen villages in the district against flooding documented following serious damage during the 2010 event [42]. This event was devastating, as a flash flood washed away a major bridge, cutting off 50 small villages in the remote mountainous region from the rest of the district, exacerbating the disaster’s impact. Additionally, in August 2015, the district experienced another severe flooding event, which caused widespread damage to infrastructure, reinforcing the accuracy of the flood hazard assessments. Superimposing the mapped geographical positions of these villages on our current flood hazard map from this study indicates that all selected villages were in moderate- to high-risk zones agreeing with observational field data. Another research named “Flood Disasters and Land Use Planning in Haripur District” by Atta-ur-Rahman Shaw [43] was focused on the concept of analysis of flood disasters along with the efficiency of land use planning, formulating a flood hazard zonation map through elements of GIS tools. A comparison of their flood hazard zonation map with the one that was developed in the present study was done. Results were consistent even though their focus was on land use analysis. On the other hand, the present study combined nine parameters in creating its flood hazard map which made it more realistic. The fact that both hazard maps were compared showed the reasonableness of the results obtained in this study [44]. Figure 12 illustrates the geographic locations of these villages and the areas affected by floods, highlighting the moderate to high-risk zones identified in the study, which align with field observations.

3.5. Restrictions Associated With the Approach and Suggestion
Despite the limitations in using a midresolution image (SRTM 30 m) and subjectivism associated to classifying coastlines to parameter types, the resulting map of flood vulnerability for Haripur District Khyber Pakhtunkhwa watershed proves fundamental in use by administrative authorities as well as decentralized local communities regarding development planning and decision-making. This resource has an opportunity to address environmental management and sanitation issues by improving the quality of life in an overcrowded area. In order to recognize the limitations and mismatches that should be addressed in future research, it will be vital to bring them into analysis and identify more efficient models with reduced margins of error. This is the first attempt at determining the potential vulnerability of Haripur District Khyber Pakhtunkhwa watershed to flood within a changing global framework from several environmental parameters in the form of SRTM, rainfall, and geology Thus, these results could be considered as a milestone in determining flood problems of the Haripur District in Pakistan. Further, the findings of this research are envisioned to promote harmony in working between the central government, decentralized communities, and other development partners as they work together to avert losses from floods. As a scientific perspective, this campaign contributes to the ecology of Haripur District Khyber Pakhtunkhwa watershed. It helps in identifying and assessing factors that affect the extent of flood risk, which is an integral part in controlling a framework to eliminate or minimize challenges emanating from flooding.
4. Discussion
For the evaluation of the risk zone in urban flooding watershed Haripur District, Khyber Pakhtunkhwa, Pakistan, from a representation point of view, this study shows also that AHP and GIS technologies are quite effective. The AHP analysis presents the three elements that impact on flood risk as elevation, slope, and rainfall. As a parallel effort, maps of flood hazard were generated and displayed based on GIS technologies. One of the most interesting is that, with a big number of people living in the Khyber Pakhtunkhwa watershed which realize there is significant risk for flooding, very few have taken any preventive measures. GIS maps further show the highest risk from floods as they also showcase areas that are low lying and have many impermeable surfaces such as roads and even buildings.
Recurrent urban flooding catastrophes are a result of the increasing frequency and intensity of heavy rainfall events, which are linked to climate change and rising urbanization. Due to its geological features and geographic position, the most populated area in Pakistan, Haripur area, is especially vulnerable to flash floods and urban floods. It was decided to be the main focus of this investigation. The extent of each risk zone fluctuates with an increase in the rainfall component, according to the statistics. Flood intensity rises with precipitation; however, the rainfall peak coefficient parameter loses significance in determining the location of the largest danger zone as the precipitation return period increases [35].
Table 6 shows that around two-thirds of the territory is located in high-risk zones. Flash floods, which are severe but rare, are caused by the fluvial systems of Haripur, which are mostly made up of swift-moving streams. Floods are also caused in part by small drainage basins and erratic stream behavior. The AHP method improves our comprehension of each component’s distinct functions in the flood process by giving weights to each element or indication [45].
On the other hand, bias may be introduced by combining data from various sources and freezing interpolating and cross-referencing a GIS at consistent resolution. The normalization and appropriate weighting of these attributes are key to reducing bias and uncertainty. The AHP approach’s subjective selection of indicator weights based on arbitrary expert opinions is one of its drawbacks. Overall, good results may be obtained with an integrated strategy that combines AHP and GIS approaches [46].
The suggested method offers a thorough examination of flood-prone locations with consistent methodology [47, 48], providing insightful data useful in a variety of situations.
Notwithstanding these advantages, applying this method is not without its difficulties. We used a simplified approach to flooding modeling by generalizing the network because there was insufficient data on the subterranean drainage system in our investigation. Even though the modeling findings had some mistakes, they had little effect on how flood danger levels were determined [49].
The amount of resolution needed to take into account social, environmental, and physical elements depends on the investigation’s unique goals. The data is given below in raster format that conforms to size of the text to make reading of findings easy. Constancy of spatial resolution should be the object of future research.
It is challenging to regularly assess urban flood risk due to the dynamic nature of several factors, such as precipitation volume and intensity, population density, and building architecture. To better understand the research issue, we restricted our analysis to a selection of essential indicators. The weighting of these indicators must be calculated precisely and thoroughly despite inherent uncertainties, since this will have a substantial influence on the final flood risk estimate. The difficulties encountered during rescue efforts in the wake of natural catastrophes have been well researched. To set scientific standards for urban emergency rescue systems, a thorough study of urban flooding will be required in the future [50].
The study’s findings have several implications for the management of flood hazards in the Haripur District’s watershed and its environs. To reduce the danger of flooding, land use planning and management are crucial, as the research first emphasizes. In the research region, a lot of roads and impermeable surfaces cause more runoff to occur during rainy seasons, which increases the risk of flooding. Thus, minimizing the danger of floods requires making well-informed land use decisions. The study also highlights how crucial it is to maintain and upgrade drainage systems in order to lessen the effects of flooding. To reduce the effects of future floods, improvements in drainage infrastructure and maintenance are required because the study area’s poor drainage system increased the danger of flooding. The report also emphasizes the significance of raising public awareness and teaching people about flood danger and preparedness. Although many individuals in the study area were aware of the high probability of flooding, very few had made any kind of preparation. The public’s awareness of flood risk and preparedness should be raised to mitigate the consequences of floods.
The research’s virtual ramifications are what make it significant. Urban planners, local government officials, and disaster management organizations can benefit greatly from the danger maps generated by our research. They make it possible for these parties to decide on targeted mitigation plans, emergency response plans, and land use planning with knowledge. They may reduce the impact of flood dangers by using these insights to proactively promote sustainable development and strengthen the district’s resilience.
5. Conclusions
The presence of lowlands with moderate slopes, ephemeral streams with torrential behavior, entirely covered streams, and urban centers leads to a high concentration of flood hazards in the northern and southern sectors of Haripur District watershed. These locations have inordinate amounts of areas that fall under extremely high and high flood threat zones. Showcased together alongside the results of uncertainty analysis, an evaluation of flood danger map uncovers the relation between hazard zones and vulnerable areas.
The danger map’s accuracy and dependability have been demonstrated by the validation procedure. It is possible to identify possible places for the development of flood protection measures by examining the present urban flood danger map and conducting a thorough geographical distribution study. The suggested approach is especially helpful in situations when primary data is scarce since it offers a thorough investigation of the field and produces useful, well-founded conclusions. Therefore, scientists, stakeholders, engineers, and decision-makers involved in prospective land use planning initiatives may readily accept and use this strategy. It may be used to build flood mitigation strategies, which will greatly aid in preparing for disasters and postflood management, ultimately increasing overall efficacy.
Ethics Statement
The authors have nothing to report.
Consent
The authors have nothing to report.
Conflicts of Interest
The authors declare no conflicts of interest.
Author Contributions
Conceptualization, Z.J., A.H., and M.W.; methodology, M.W. and A.H.; software, Z.J. and A.H.; validation, M.W., Z.J., and S.A.; formal analysis, M.K.L. and Z.J.; investigation, M.W. and Z.J.; data curation, Z.J. and A.H.; writing original draft, A.H. and Z.J.; writing—review and editing, S.A. and M.W.; visualization, M.K.L., A.H., S.A., and Z.J. All authors have read and agreed to the submitted version of the manuscript.
Funding
This research received no external funding.
Acknowledgments
The Esri and USGS are gratefully acknowledged by the study’s authors for contributing to the digital elevation model and land use and cover data, respectively.
Open Research
Data Availability Statement
The datasets generated and/or analyzed during the current study are not publicly available due to privacy reasons but are available from the corresponding author on reasonable request.


