P- and S-Wave Velocity Structures and the Influence of Volcanic Activities in the East Java Area From Seismic Tomography
Abstract
The tectonic complexity in Indonesia has made it one of the most interesting targets for studies on seismic tomography. The Indian oceanic plate sunk beneath the Eurasian continental plate, forming the subduction zone in Southern Indonesia. This activity led to the formation of volcanoes along the Sunda Arc, including East Java, the research area covered in this study. This research is mainly aimed at identifying the influence of the volcanic activities by tomography analysis. The data of the earthquakes was recorded by 22 seismic stations of the Indonesia Tsunami Early Warning System (InaTEWS) seismic network in the period of 2009–2017. The tomographic image was analysed by exploring the anomalies of primary (P)- and secondary (S)-wave velocities and Vp/Vs ratio. The result shows the presence of a low-velocity zone with a high Vp/Vs ratio found around the volcanic area, which is correlated with the partial melting zone or magma chamber. The low-velocity zone was observed at the depth range of 27–155 km, which was also correlated with the subducted slab beneath Java Island. This leads to an assumption that there is an interlinked volcanic system which extends from west to east of Java.
1. Introduction
East Java is a tectonically active region, as it is a meeting point of two active tectonic main plates, the Indo–Australian oceanic plate and the Eurasian continental plate. The Indo–Austalian oceanic plate sinks under the Eurasian continental plate, forming a subduction system and a volcanic arc that extends from the west of Sumatera to the south of Sumba Island [1]. In East Java, there are Mt. Lawu, Mt. Kelud, Mt. Semeru, Mt. Bromo, and Mt. Ijen, as five of hundreds of active volcanoes in Indonesia. Identifying the magma path orientation of these five volcanoes is a good way to better understand the volcanism as well as the prediction of geothermal sources in volcanic areas.
In previous research, data from over 100 seismic stations were used to construct three-dimensional (3D) models of primary (P)-wave (Vp), secondary (S)-wave (Vs), and Vp/Vs ratios beneath Central Java, revealing a subduction zone with an increasing dip angle and a low-velocity anomaly in the crust, particularly north of the volcanic arc [2–4]. Key findings include a significant low-velocity anomaly in the crust indicating potential fluid and melt content, as well as a dipping low-velocity anomaly in the upper mantle that may suggest fluid ascent paths from the subducting plate [2–4]. Partial melting of existing rock in the subsurface of the Earth leads to magma forming [5], and it can be identified as a seismic low-velocity zone [6], anisotropy [7], or as a high Vp/Vs ratio [8–10]. Study on seismic tomography by using the travel time of P- and S-waves was very useful to visualize the velocity structure beneath the surface. The implementation of tomographic studies has been published to identify slab detachment [11–13], partial melting zone [14–16], thick sedimentary layer [17–19], and rupture zone [2, 20].
This research is aimed at identifying the characteristics of the subsurface in East Java, by performing seismic tomography. The result is visualized in a tomographic map, obtained by analyzing the relocated hypocenters and the seismicity distribution in/from East Java. The subsurface condition was delineated from P- and S-wave modelling and Vp/Vs ratio, to predict the magma pathway (significant decrease of Vs with high Vp/Vs) and its influences to the surrounding area.
2. Materials and Methods
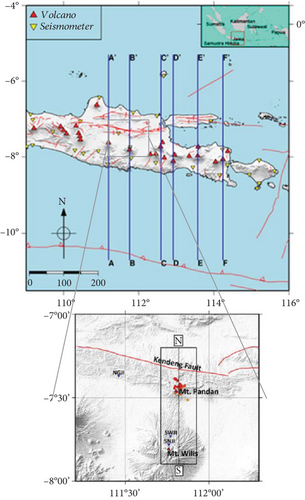
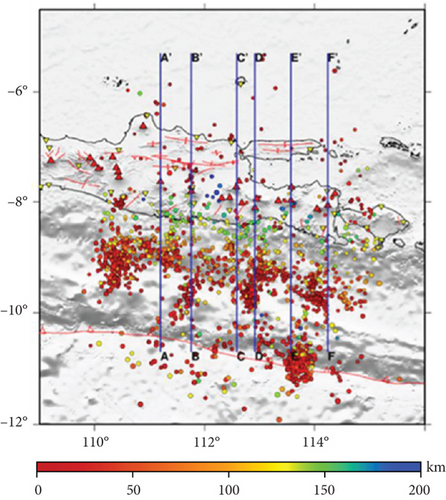
The seismic data was collected from the InaTEWS (Indonesia Tsunami Early Warning System) seismic network of 22 broadband seismic stations (Table 1) developed by the Meteorological, Climatological, and Geophysical Agency of Indonesia (BMKG). From the recorded seismic data with manual picking in the period of 2009–2017, we noted 1372 earthquakes that generated 12,778 P-waves and 4771 S-waves arrival times with only 1298 earthquakes having magnitude M > 3. Earthquakes with magnitude M > 3 were chosen to relocate its hypocenter. There are also more than 74 earthquakes that were discarded because of their large azimuthal gap (< 210°). The distribution of epicenter of the earthquake from 2009 to 2018 according to the BMKG catalog is shown in Figure 1.
| No. | Station code | Latitude (°) | Longitude (°) | Altitude (m) |
|---|---|---|---|---|
| 1 | ABJI | −7.8 | 114.23 | 114.36 |
| 2 | BLJI | −7.75 | 113.59 | 80.85 |
| 3 | BWJI | −5.85 | 112.66 | 57.56 |
| 4 | BYJI | −8.21 | 114.36 | 99.5 |
| 5 | GMJI | −8.27 | 113.44 | 80.13 |
| 6 | GRJI | −6.91 | 112.48 | 97.14 |
| 7 | JAGI | −8.47 | 114.15 | 171 |
| 8 | KMMI | −7.04 | 113.92 | 49.14 |
| 9 | KRK | −8.15 | 112.45 | 330.3 |
| 10 | NBBI | −8.46 | 114.94 | 27 |
| 11 | NGJI | −7.37 | 111.46 | 149 |
| 12 | PCJI | −8.19 | 111.18 | 702.27 |
| 13 | PWJI | −8.02 | 111.8 | 205 |
| 14 | RTBI | −8.46 | 114.94 | 300.7 |
| 15 | SMRI | −7.05 | 110.44 | 203 |
| 16 | SNJI | −7.78 | 111.76 | 1341 |
| 17 | SWJI | −7.73 | 111.77 | 723.33 |
| 18 | TBJI | −6.82 | 111.85 | 54.45 |
| 19 | UGM | −7.91 | 110.52 | 350 |
| 20 | UWJI | −6.42 | 110.95 | 61.52 |
| 21 | WOJI | −7.84 | 110.92 | 183.62 |
| 22 | YOGI | −7.82 | 110.3 | 176 |
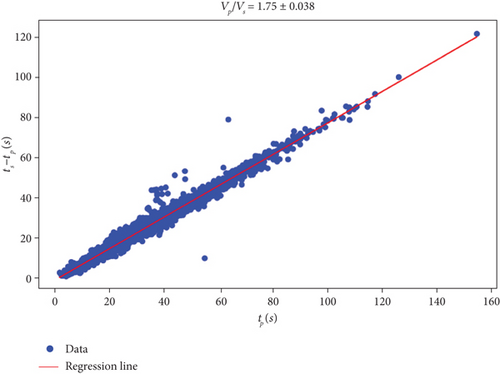
Then, Equation (1) was substituted by linear equation (y = mx), with y = (ts − tp), m = (vp/vs − 1), and x = .(tp − to). The ratio of Vp/Vs can be expressed as the form of a gradient of m + 1. The Vp/Vs ratio in this research was obtained by using the linear regression of the Wadati diagram (Figure 2), which shows the average ratio of Vp/Vs of 1.75 ± 0.038.
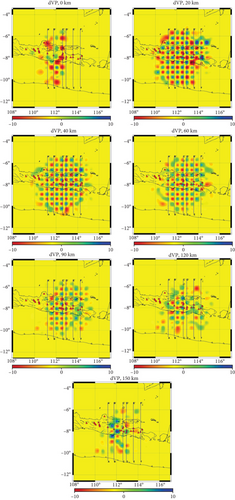
To minimize error in the implementation of seismic tomography, checkerboard tests were run to assess the reliable result. Lévěque, Rivera, and Wittlinger [24] assumed a uniform velocity structure in the whole medium so that the source-to-receiver paths are straight lines. The checkerboard test used an arbitrary model with high and low attenuation zone sizes to the elementary block size. The synthetic data will be computed and inverted using Lanczos’ [25] method to ensure that the inverted model is completely identical to the (true) model.
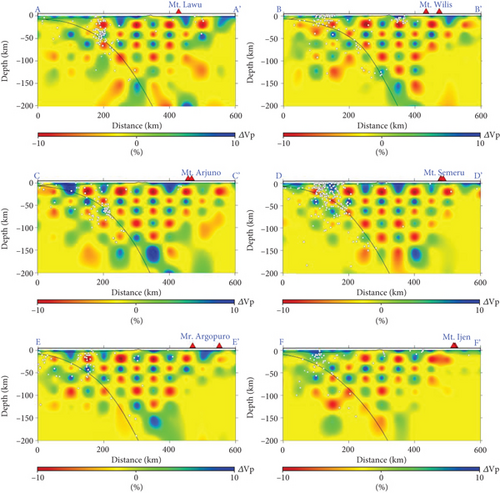
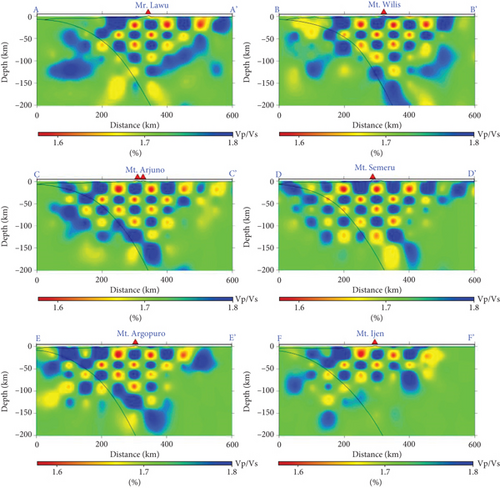
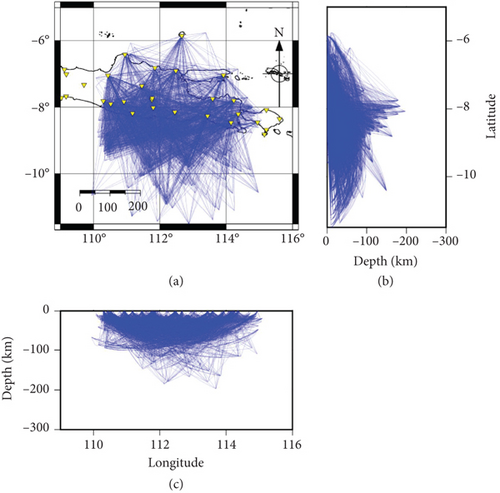
In this study, the model was differentiated into horizontal and vertical profiles with the range of longitude at 1100–1150 E, the latitude at 50–120 S, and the depth at 0–300 km. The model space was discretized by a 17 × 17 grid with intervals 50 × 50 km to represent the model of 3D velocity structure. The checkerboard tests were presented in horizontal (at depths of 0, 20, 40, 60, 90, 120, 160, and 200 km) and vertical profiles, as can be seen in Figures 3 and 4. The ray path of the same source-receiver pairs is shown in Figure 5. The inversion of the seismic image in this research was displayed as the percentage of perturbation from the P-wave 1D velocity model of an average initial minimum value model by Koulakov et al. [2] (Table 2).

| Depth (km) | P-wave velocity (km/s) |
|---|---|
| −3 | 4.3 |
| 0 | 4.9 |
| 20 | 7 |
| 40 | 7.31 |
| 60 | 7.57 |
| 90 | 7.87 |
| 120 | 8.05 |
| 160 | 8.16 |
| 200 | 8.27 |
| 300 | 8.62 |
- Note: Depth in negative shows that the average value is above the mean sea level.
3. Results
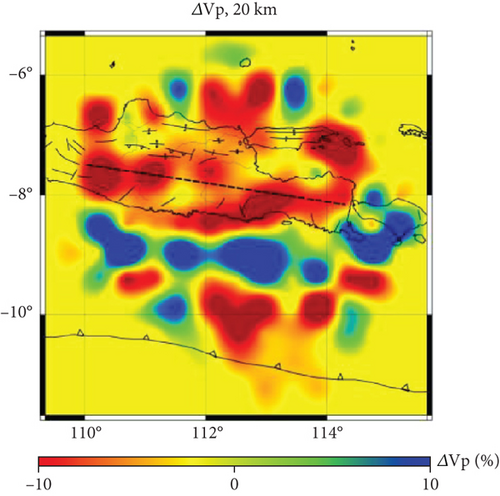
Tomographic maps of horizontal profiles were presented in Figure 6 to show the velocity anomalies at depths obtained in this study. The decrease of P- and S-waves velocities were identified at a depth of 20 km where the anomalies were at the lowest. This implied the presence of low-velocity rocks and they emerged along the volcanic arc of East Java (black-dashed line in Figure 6), where the young volcanic rocks were formed. In contrast, the high anomalies were detected along the forearc (southern part of the research area), which is interpreted as the slab material of the subduction zone. Meanwhile, the tomographic map at depth of 40 km shows that the pattern of velocity anomalies was increased. A relatively high-velocity anomaly appears beneath the volcanic arc toward the basin area (north of Java) at depths of 40 and 60 km. At a depth of 90 km, positive ΔVp were detected in the eastern area of Java. Then, this anomaly pattern disappears at a depth of 120 km but reappears at a depth of 150 km. This occurrence was then interpreted as the exhibited slab materials down deep in that depth.
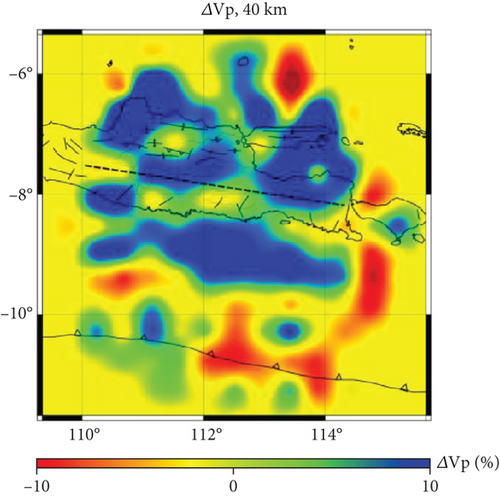
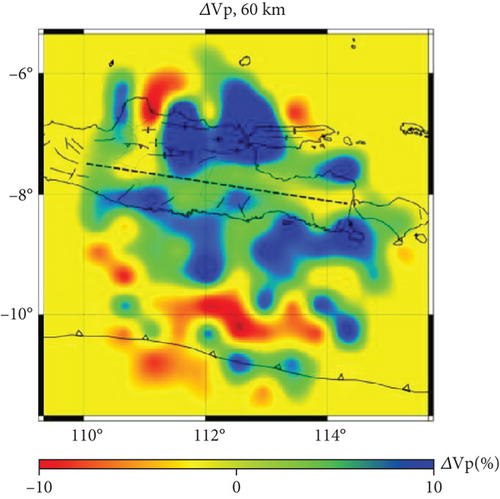
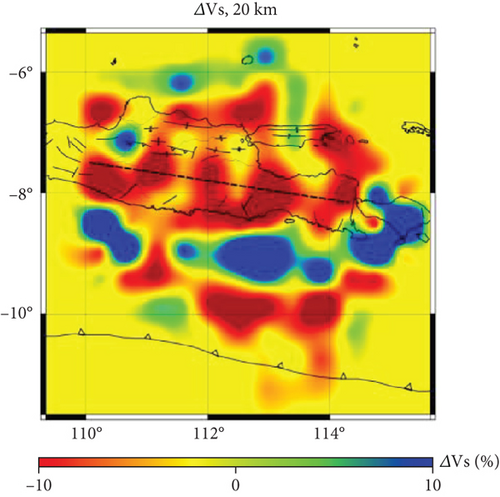
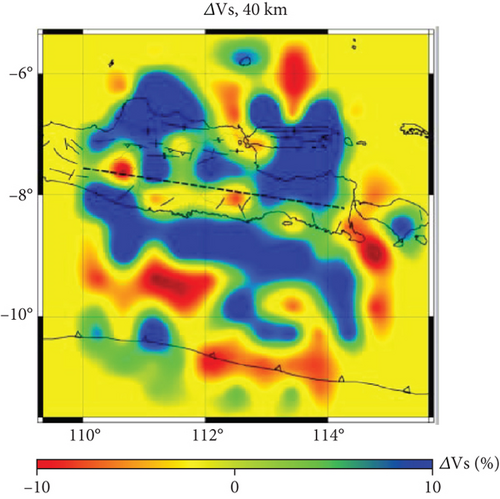
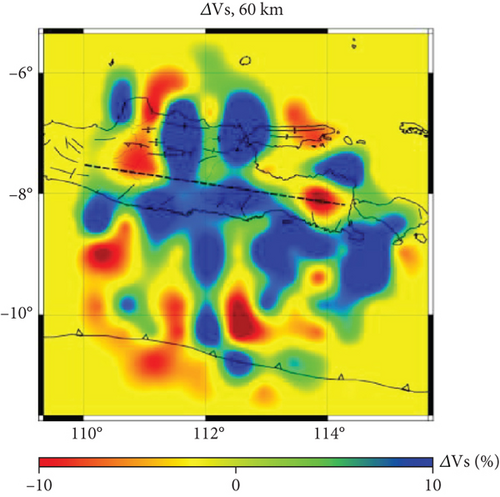
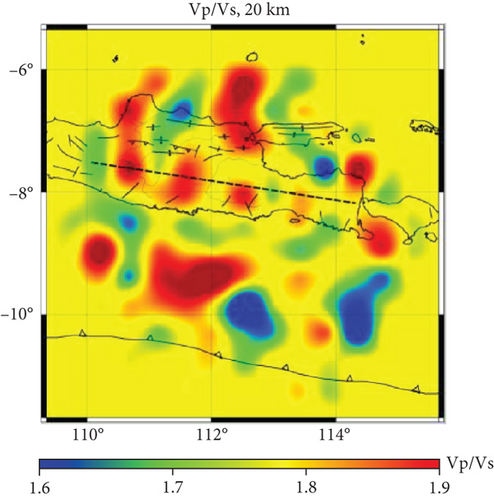
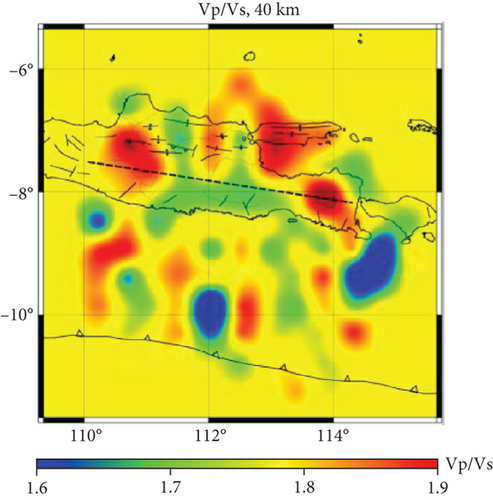
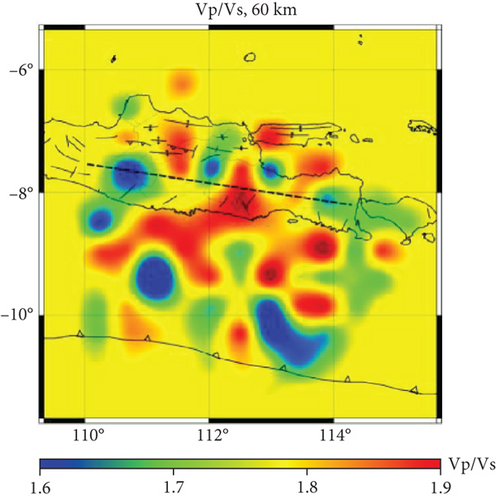
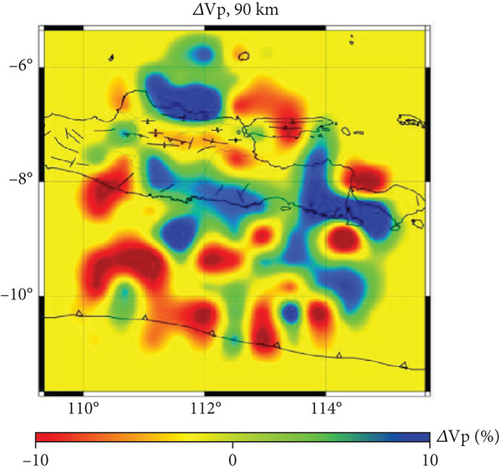
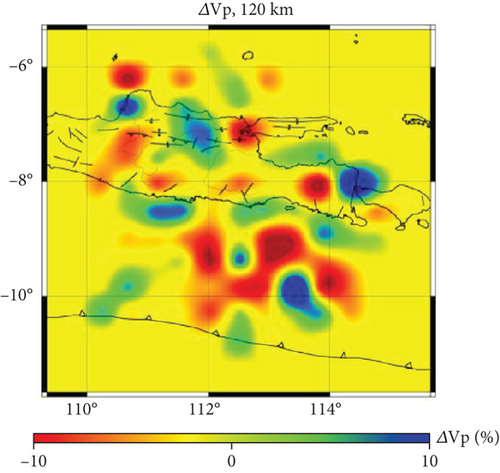
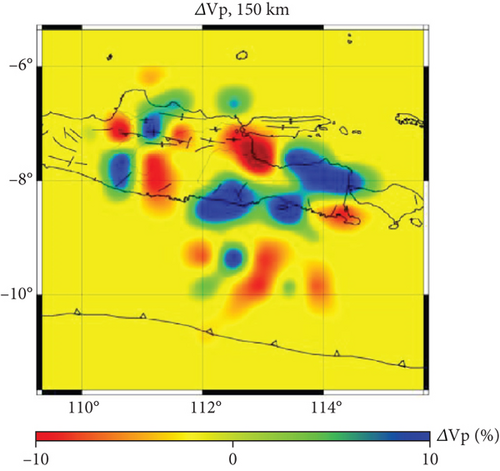
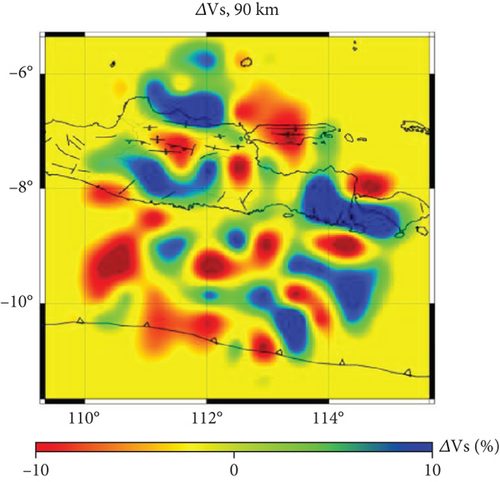
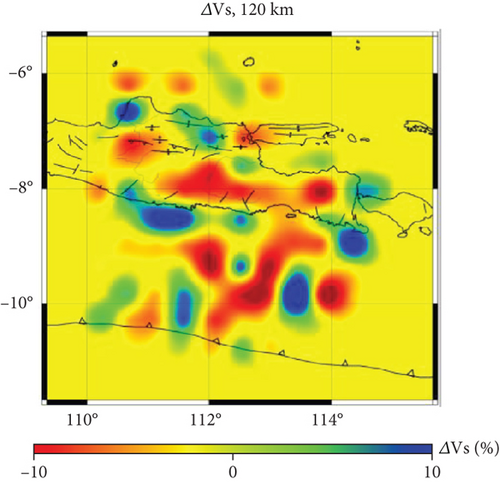
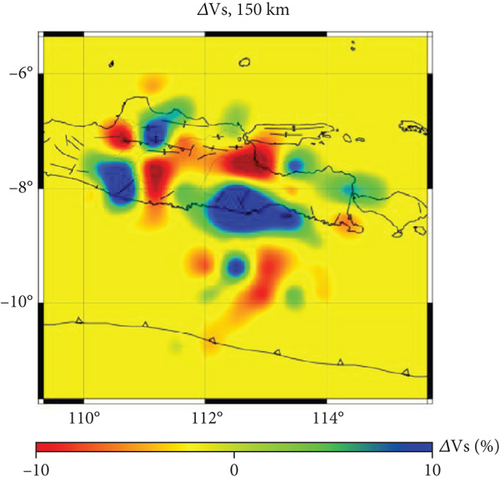
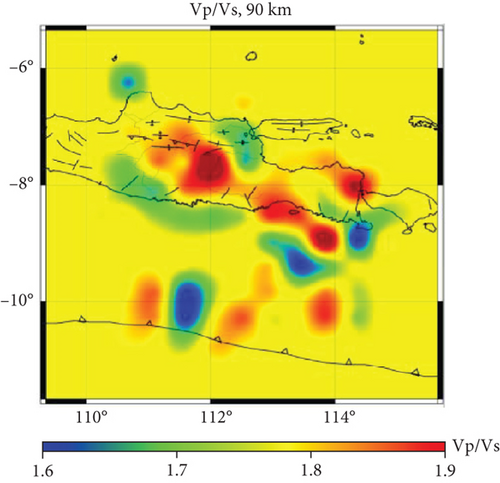
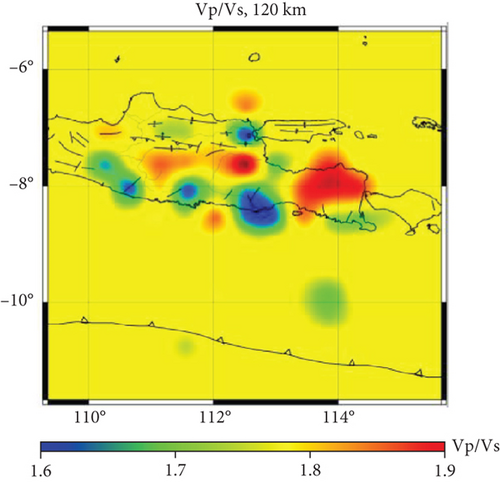
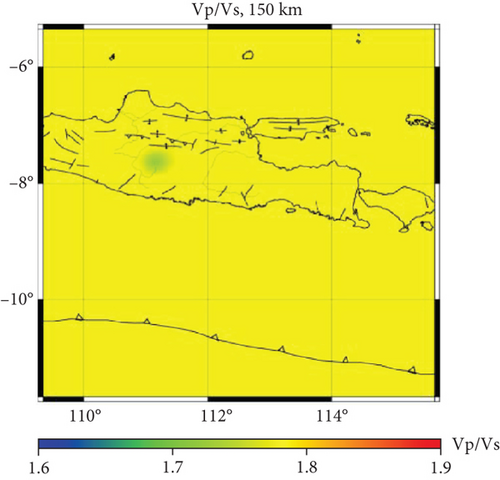
Further investigation toward the distribution of velocity structures based on depths was conducted by drawing six lines slicing the volcanic arc (Figure 1) to create six vertical profiles (A–A ′, B–B ′, C–C ′, D–D ′, and E-E ′). The sliced profiles that show well-images of the distribution of the seismic velocity of the research area are visualized in Figures 5, 6, 7, 8, 9, and 10. Since the earthquake data at depths > 100 km were lacking, the analysis of tomographic maps at those depths was implemented according to the 1D velocity model of Koulakov [2].
3.1. Profile A–A ′ (Mt. Lawu)
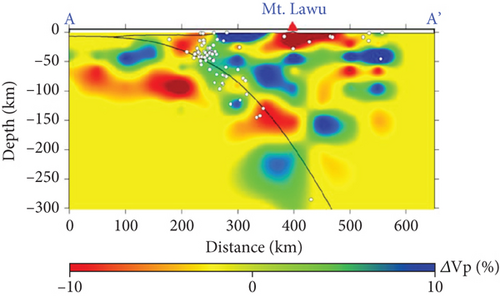
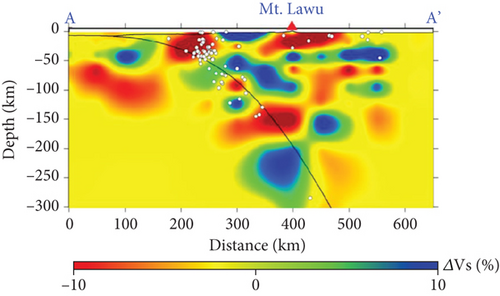
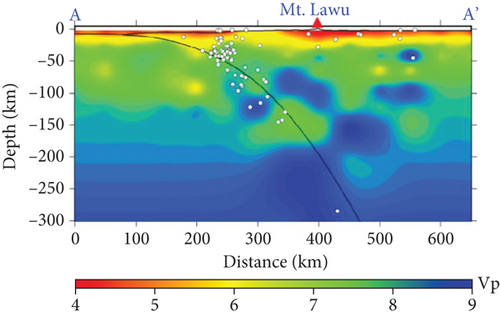
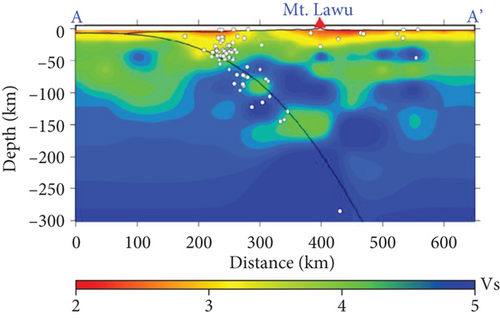
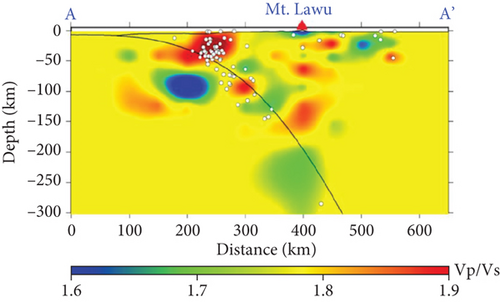
The presence of a low anomaly was observed spreading beneath Mt. Lawu at a depth of about 50 km and spreading to 100 km northward as shown in Figure 7. This anomaly was caused by the volcanic activity of Young Lawu, as shown by the negative Vp and Vs perturbations. Other presence of low anomalies of Vp and Vs perturbations were also observed around the slab of the subducting plate (curved line in Figure 7) at a depth of about 100–190 km. These low anomalies were interpreted as the partial melting of the slab. High anomaly also detected appears along the slab and suggests that this high anomaly represents the material of the slab. This is shown by the positive values of Vp and Vs perturbations.
3.2. Profile B–B ′ (Mt. Wilis)
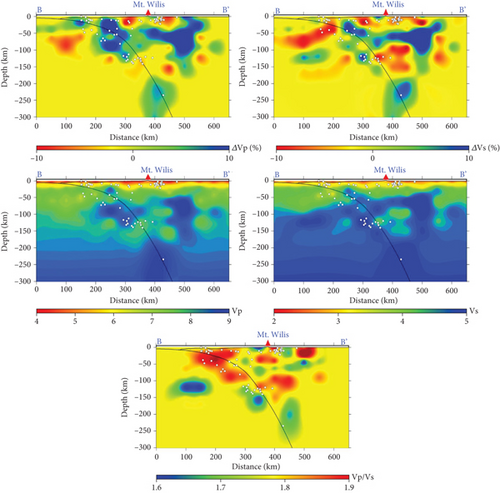
Profile B–B ′ which was drawn crossing Mt. Wilis shows a high-velocity anomaly exhibited from the depth of 25–150 km beneath the mountain as can be seen in Figure 8. The high-velocity zone was first observed at the slab near the surface and going down to a depth of 150 km, which indicates the slab material. Then, these high-velocity patterns spread for about 200 km northward with a thickness of about ~50 km. Another low-velocity zone is also observed at ± 70 km in the southward of Mt. Wilis with ΔVp and ΔVs decreasing to −9.5%. It is suggested that these negative anomalies represent the past activities of the old Southern Mountain Range.
3.3. Profile C–C ′ (Mt. Arjuno, Mt. Welirang, and Mt. Kelud)
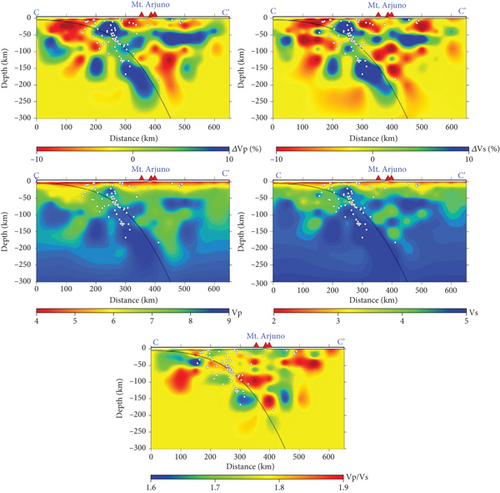
Profile C–C ′ was drawn crossing three neighborhood volcanoes: Mt. Arjuno, Mt. Welirang, and Mt. Kelud, as can be seen in Figure 9. In Figure 9, it is observed that the presence of negative values beneath the three volcanoes with ΔVp and ΔVs is around −10% in the depth of about 100–150 km. This anomaly might indicate partial melting of the slab as indicated by the negative body observed in the upper section (Vp/Vs~1.88). A low-velocity pattern is also observed in the forearc which may represent the partial melting at the southern area. Other low anomalies of Vp and Vs in the northern part of the profile at the surface to a depth of about 50 km may be related to the sediment formation of the basin in the north of East Java. Meanwhile, the high anomaly along the slab (black line) is interpreted as slab material. These positive bodies create a lateral pattern extending northward, possibly representing the Moho.
3.4. Profile D–D ′ (Mt. Semeru)
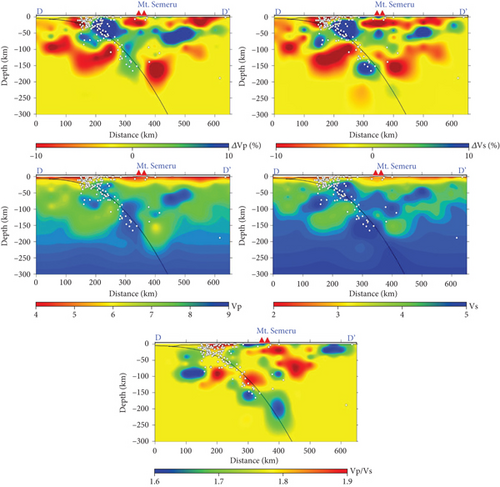
Figure 10 shows the section of Profile D–D ′ which is crossing Mt. Semeru. The low-velocity anomalies exhibit from a depth of 0–50 km and ± 80–200 km. A lateral negative body was observed right beneath Mt. Semeru at the depth of ± 20–30 km, which may be related to the magmatic activity of the volcano (Vp/Vs~1.86), and at a depth of ± 80–150 km, extending through the black line, partial melting is indicated. The low anomaly down to the depth of 150 km in the north of Mt. Semeru indicated the partial melting of the slab which feeds the magmatic system at the upper zone. Then, these low-velocity patterns form a path at 200 km northward with ~30 km thickness, which may be related to the sediment in the basin zone. A positive body was also observed at the forearc and down to the depth of 50–150 km with Vp/Vs~1.87. The high-velocity bodies at the forearc and basin at the depth of ~50 km indicated the slab of the subducting plate (black line) which then elongated a lateral body to the northward and may represent the Moho.
3.5. Profile E–E ′ (Mt. Argopuro)
Profile E–E ′, as can be seen in Figure 11, shows an anomaly of the low velocities that appear right beneath Mt. Argopuro which indicated the magmatic activity of the volcano. Another low-velocity zone is observed at ± 80 km to the northward of Mt. Argopuro where the ΔVp and ΔVs decrease to −10%. This negative anomaly was suggested as representing the sediment formation at the basin in the north of East Java. Meanwhile, high-velocity zones exhibited from the depth of 0–250 km. High-velocity anomalies were also observed at the slab down to the depth of 250 km, which indicated the slab material. However, these high-velocity zones at the slab material are accommodating high Vp/Vs ratio, which the interpretation is still in question and needs further detailed research to conduct for the next tomographic studies. These high-velocity patterns are likely due to the continuity of another positive body at the depth of 100–150 km in the southern part, which elongates up to the depth of 50 km northward with ~50 km thickness.

3.6. Profile F–F ′ (Mt. Ijen)
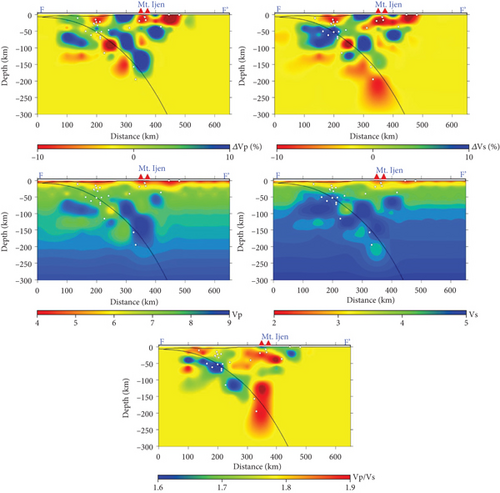
Profile F–F ′ was drawn crossing Mt. Ijen as can be seen in Figure 12. The profile shows high-velocity patterns (positive anomaly) exhibited from the depth of 0–150 km. The positive anomaly is suggested to represent the slab material. Right beneath Mt. Ijen, a negative anomaly exhibits at a depth of 0–30 km, which is likely related to the magmatic system of Mt. Ijen and Mt. Raung as it accommodates a ratio of Vp/Vs~1.87. However, this negative anomaly body is likely forming a continuity in a path toward another negative body 100 km away to the South. This continuity of the negative body was interpreted as related to the sediment formation at the basin. At the depth of 100–200 km beneath the volcanoes, a vertical body with high Vp/Vs (~1.89) was detected, which may represent the partial melting that feeds the magmatic system at the upper part of the subsurface.
4. Discussion
Interpretation of the velocity model involves the input of P-wave and S-wave velocity data. Positive ΔV indicates the acceleration of the P/S wave, which means that the medium it passes through is more rigid. Conversely, the negative ΔV indicates a deceleration of the P/S wave, suggesting that the medium they pass through has a lower viscosity compared to the surrounding rocks. This reduction in viscosity may result from the presence of a liquid fraction, increased temperature, rock fragmentation near the fault axis, or the presence of sedimentary layers, including volcanogenic deposits, especially if the anomaly is situated near the surface of the model. As for the ratio of Vp/Vs, the high value of Vp/Vs means that the Vs is smaller, which implies a lower shear modulus. S-waves move through a medium by shearing the medium’s particles perpendicular to the direction of wave propagation. P-waves move through a medium by compressing the medium’s particles. So even when passing through a liquid, they can still propagate, although their Vp will slow down due to the low shear modulus.
When both P-waves and S-waves pass through a medium with lower viscosity, both experience a slowdown, but the deceleration experienced by Vs is greater than that of Vp. As a result, when the Vp/Vs ratio is calculated, it will show a value higher than the Vp/Vs model. Conversely, when passing through a solid medium, both Vp and Vs values will be higher than the model because acceleration occurs. This is due to the fact that the denser the medium, the greater its shear modulus. When S-waves pass through a medium with lower viscosity, such as water or magma, their speed slows down or can even stop because S-waves require an elastic medium, like a solid, to propagate. Liquid mediums cannot support shear forces because they lack sufficient shear rigidity. As a result, S-waves cannot effectively propagate through liquids, leading to a slowdown or cessation of their propagation.
The tomographic imaging showed the P-wave velocity in the range of 3.37–9.61 km/s from a depth of 0–300 km. Meanwhile, the S-wave velocity obtained is in the range of 1.91–5.59 km/s. The ratio of Vp/Vs of the study area is in the range of 1.45–2.05. The presence of low-velocity zones in the section profile right beneath Mt. Lawu, a Quaternary volcano (Figure 7), suggested that there was an association with the past volcanic activity. This magmatic activity feeds the current geothermal heat source and is composed of most basaltic andesites [26]. The intrusion of lava in the southeastern part of Mt. Lawu is counted as the heat source of the hydrothermal system [27], which then flows the heat through cracks or microcracks surrounding the observed fault zone. High Vp/Vs body at the north of Mt. Wilis, an extinct Quaternary volcano (Profile B–B ′, Figure 8), is suggested as the hydrothermal zone, which sustains the heat source of the geothermal system of Lake Ngebel. Santoso et al. [28] also explained that further to the north, a low-density anomaly was observed beneath Mt. Pandan. This anomaly was suggested as the presence of hot material caused by the hot springs and warm ground. Small earthquakes (M < 4) were also observed concentrated beneath Mt. Pandan at the depth < 10 km dipping southward. Santoso et al. [28] suggested that the small earthquakes, which occurred in 2016, may lead to the Kendeng fault activities located northward of Mt. Pandan.
Fallahi et al. [29] studied an ambient noise tomography along the Mt. Arjuno to Lusi mud volcano. This research found that a low-velocity body was observed at the depth of 4–6 km beneath Mt. Arjuno and Mt. Penanggunan, which indicated the magmatic bodies of both volcanoes. The rock formation of Mt. Arjuno was composed as the result of the eruptions of the Old Arjuno, the Young Arjuno, and Mt. Welirang and might influence the velocity structure beneath Mt. Arjuno itself. Another possible cause of a high Vp/Vs zone is the hydrothermal activity in the geothermal system of Arjuno-Welirang. In agreement with the study of Widiyantoro and Van der Hilst [30] which investigated a high P-wave velocity anomaly as the image of the slab in the upper mantle, the high-velocity zone detected by this study is associated with the slab material due to the subduction zone. The observed lateral high-velocity body within 200–450 km on the C–C ′ profile (Figure 9) indicates the slab subduction, while the Moho’s discontinuity, itself, is estimated at depths of about 39 km [31].
The perturbations of P-wave and S-wave velocity decrease at the forearc, as observed by this study, interpreted as the partial melting zone caused by the collision between the oceanic and continental lithospheres. Furthermore, a high-velocity zone is observed in the north, which may represent either the slab material or the Southern Mountain Range. The Southern Mountain Range itself was composed of old volcanic rocks which were formed in the Tertiary period [32, 33]. Ayu et al. [34] imaged the seismic attenuation of Mt. Semeru and found a high attenuation zone which was interpreted as the magma chamber of Semeru Volcano. Meanwhile, in this study, the high attenuation zone was interpreted as a low-velocity zone right beneath Mt. Semeru (Figure 10). The low-velocity zone was observed at the depth of approximately 10–30 km.
The existence of a geothermal system in Mt. Argopuro consisted of altered rock, reservoir, and hot rock (heat source) strongly influenced by volcanic activity [35]. The geothermal system in this study was interpreted as the low-velocity zone right beneath the volcano as seen in Figure 11. Descatoire [36] also depicted a cross-section of the subduction zone beneath the Java Island. Partial melting was observed as the Indo–Australian plate reaches a depth greater than 100 km, which then creates magma. In Figure 12, a vertical high Vp/Vs body was observed at a depth of approximately 100–140 km and suggested that this high Vp/Vs zone was caused by the partial melting of the slab. We suspect that this partial melting then feeds the magma chamber of Mt. Ijen and Mt. Raung at the depth of approximately 0–20 km. A high-velocity zone was also elongated down at the depth of 50–140 km, which then interpreted the body as the slab material of the subduction zone.
This research interpretation of all profiles is in agreement with the study of Nugraha et al. [16], which found a high Vp/Vs at Sinabung Volcano and the anomalies as associated with the plumbing system of the volcano itself. Martha et al. [19] conducted an ambient noise tomography study along the volcanoes, including Mt. Semeru, Mt. Argopuro, Mt. Raung, and Mt. Ijen, and found low-velocity structures related to the age of the volcanic rocks, which are relatively young and might still be producing magma. The vertical profile of cross sections slicing the volcanoes depicted in this research also exhibited a similar pattern, which is a negative body (low-velocity zone) with high Vp/Vs ratio beneath the volcanoes.
5. Conclusions
The study on seismic tomography in the East Java area was implemented by analyzing the data of 1372 earthquakes, which were recorded by the 22 seismic stations of the InaTEWS network during 2009–2018. The tomographic imaging of Vp and Vs illustrates the subduction zone in depth reached 150 km beneath the eastern part of Java Island and the presence of a volcanic system in this area. The low-velocity zone with a high ratio of Vp/Vs was observed in the volcanic complex and expected to act as a partial melting zone or magma chamber due to the volcanic activities. A low-velocity zone at the depth of 27–155 km was suggested as the partial melting of the slab. Due to the existence of volcanic activities in East Java, it was suggested that there was an influence of the magma chamber, which forms a continuous pathway extending from the Mt. Lawu to the Ijen-Raung Volcano Complex.
Disclosure
The funding sponsor had no role in all the data, materials, analysis, or data interpretation in writing the manuscript or decision to publish the study. A preprint has previously been published at https://www.researchsquare.com/article/rs-438689/v1 [37].
Conflicts of Interest
The authors declare no conflicts of interest.
Author Contributions
Syawaldin Ridha: investigations, formal analysis, software, writing—original draft. Sukir Maryanto: conceptualizations, supervision, writing—review and editing, validation. Agustya A. Martha: formal analysis, validation. Vanisa Syahra: writing—original draft, review and editing, visualization. Muhajir Anshori: data curation, software, resources, validation. Pepen Supendi: supervision, writing—review and editing. Sri Widiyantoro: supervision, writing—review and editing. Sri D. Wuryani: project administration, writing—review and editing. Rendi P. Hab Sari: resources, writing—review and editing.
Funding
This study is partially funded by the Indonesian Ministry of Research and Technology, the National Agency for Research and Innovation, and the Indonesian Ministry of Education and Culture. This research was also partially funded by the Faculty of Mathematics and Natural Sciences, Universitas Brawijaya, in accordance with Rector Regulation Number 15/2019 about Professors and Doctors Research Grants by contract number 25/UN10.F10/PN/2019.
Acknowledgments
The Seedfund Project is carried out through a large group of geophysicists from Brawijaya University, Bandung Institute of Technology (MIRA project), and Meteorological, Climatological, and Geophysical Agency of Indonesia. The authors would like to thank the Meteorological, Climatological, and Geophysical Agency of Indonesia which has provided us with the data and was very cooperative during the study. The authors also thank the reviewers who improved and corrected our manuscript from the first step and gave us constructive reviews as well.
Open Research
Data Availability Statement
The data that support the findings of this study were provided by the Meteorological, Climatological, and Geophysical Agency of Indonesia. All access and availability of data can be obtained through formal correspondence directly to the agency.


