Application of Integrated Geophysical Techniques to Map Groundwater Potential Zones and Geological Structures for Irrigation Purpose at “Humbo-Larena” Plain, Wolaita Zone, Ethiopia
Abstract
Groundwater resource in the “Larena Plain” at the western margins of the Southern Main Ethiopian Rift (SMER) was investigated using integrated geophysical techniques—electrical resistivity and magnetic methods. The objective was to assess aquifer depth, extent, and geological controls in the study area. Vertical electrical sounding (VES) was employed to examine and map aquifer depth and lateral extension, while geological structures and lithological contacts influencing groundwater flow and accumulation were identified using magnetic surveys. Two-stage aquifers were identified: a deeper fractured ignimbrite and a volcanoclastic sediment aquifer covered by shallow weathered ignimbrite. The depths and distributions of these aquifers were mapped, with geological structures generally aligned in the NNE–SSW orientation. Understanding these geological structures and aquifer systems is crucial for effective groundwater management in the “Larena Plain,” providing valuable insights for regional hydrogeological studies.
1. Introduction
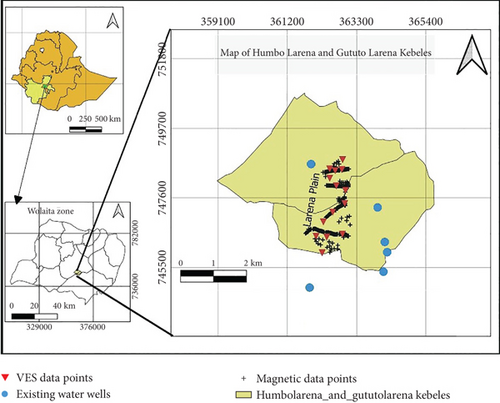
The availability and accessibility of water sources are critical for any development activity. Surface water may not always be available or accessible in all areas. In general, surface water resources remain the primary source of irrigation water supply in Ethiopia. However, where surface water resources are limited and rainfall is inadequate for high-value crop production, the development of groundwater resources is considered a potential alternative for irrigation. This is supported by the Ministry of Agriculture and Natural Resource Management of Ethiopia [1]. Groundwater plays a vital role in the development of arid and semiarid zones [2, 3]. The study area, “Larena Plain,” is located in the Wolaita Zone, southern Ethiopia, on the western margin of the Southern Main Ethiopian Rift (SMER) (Figure 1).
As reported by different scholars, low agricultural productivity was due to natural and human-induced factors, especially climate change and technological factors [4–7]. The researchers in the study area have identified rainfall variability as a key challenge impacting household food security, particularly during critical shortages from April to August. However, there is a need for studies focusing on the role of groundwater irrigation in mitigating these effects and supporting resilient agriculture, including the cultivation of short-season and drought-tolerant crops. Such research would inform targeted interventions to enhance food security during low rainfall reliability.
The Humbo_Larena study area predominantly features a suite of volcanic and volcano-sedimentary rocks, including extensive ignimbrite deposits, welded tuff, rhyolites, and trachyte flows, with lesser basalt occurrences. The volcanic profile is complemented by layers of flood basalts, silicic flows, pumice, and pyroclastic materials [8, 9]. At the surface, a distinctive layer of black cotton soil caps these underlying volcanic and sedimentary formations. The structural framework of the area is marked by a variety of brittle deformation features, including normal and strike-slip faults, and associated fault zones, which are a part of the East African Rift (EAR) System [10]. The mineralogical composition includes key volcanic minerals such as feldspar, quartz, and volcanic glass, indicative of the area’s volcanic origin. Together, these geological and structural attributes, along with the overlying black cotton soil, play a pivotal role in determining the hydrogeological characteristics and groundwater potential of the Humbo_Larena Region [8, 10].
Therefore, the objective of this research work will be to use groundwater for irrigation purposes by identifying potential well sites and determining the general groundwater conditions of the study area using integrated surface geophysical survey methods. More specifically, the study will aim to understand the nature, number, and type of aquifers within the study area to identify potential well sites that could balance demand and supply of water for irrigation. This endeavor is believed to boost agricultural production and income of the farming population, and it will benefit first of all the “Humbo-Larena” community and can be an optimistic project for the other related environments and thereby help the local population attain improved food security. In the study area, the rapidly growing population incorporated with climate change demanded an evaluation of the potential of groundwater for different purposes [4].
2. Geology and Structural Setting
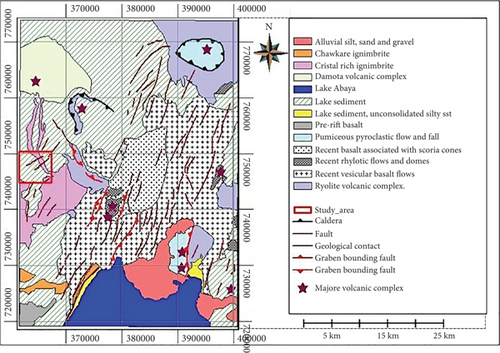
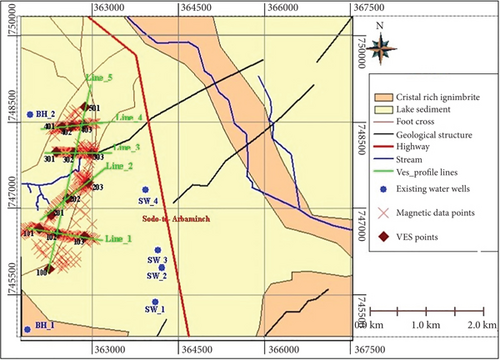
Since the Wolaita area is typically situated on the western margin of the SMER, the geological units of the Wolaita area are associated with the main rifting events of the Main Ethiopian Rift (MER) [10–12]. It primarily consists of volcanic and volcano-sedimentary rocks (Figure 2). Locally, the units include volcanic rocks such as ignimbrite, welded tuff, rhyolites, trachyte flows, and tuff with minor basalt [8]. Flood basalts with minor silicic flows, pumice, and pyroclastic rocks partially cover the area. Some units, including ignimbrite and alluvial silt, sand, and gravel, are exposed in the study area and its surrounding environments (Figure 3).
Various sets of brittle structures are present across the western and eastern escarpments of the SMER, including regional normal faults to strike-slip faults, fault zones [9], and extension joints [13]. Regional faults and fault zones associated with the EAR System significantly influence the geological framework of the area [10, 12].
The Wolaita Zone is bordered by two river basins, the Billate subriver basin and the Omo–Gibe river basin. The Billate subbasin is covered by volcanic rocks that exhibit varying hydrological properties due to differences in their texture, lithology, and primary and secondary geological structures; consequently, the geological formations in this area have different water-bearing capacities [9, 10]. Thus, the hydrogeological condition of the study area is mainly controlled by geology and geological structures.
3. Geophysical Methods and Materials
3.1. The Electrical Resistivity Method
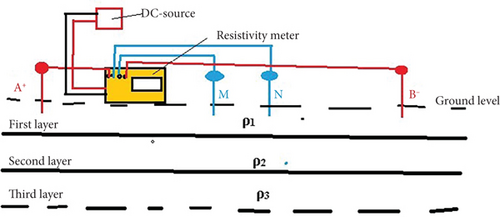
This method is particularly suitable for groundwater studies because hydrogeological properties, such as porosity and permeability, can be correlated with electrical resistivity values [1, 14, 15]. As reported by Teklemariam (preprint) [16], the vertical electrical sounding (VES) method was employed during this research work in the “Humbo-Larena” Plain by using the Schlumberger configuration with half current electrode distance (AB/2) of up to 500 m along five selected traverse lines that are oriented approximately NE–SW and E–W directions. The instrument used for the survey was the PASI-16 GL Earth resistivity unit, along with the P100-3 energizer, and the data were processed and analyzed using Surfer [17], WinRESIST [18], and IPI2win [19] inversion software. According to Kearey, Brooks, and Hills [20], most rocks conduct electricity by an electrolytic process rather than electronic processes; that is, the availability of pore spaces between grains of a rock and the characteristics of the pore fluid are major geological factors that affect the resistivity of rocks and Earth materials. In this work, the Schlumberger electrode configuration (Figure 4) was used [16] where the potential electrodes are placed in the center of the electrode array with a small separation, typically less than one-fifth of the current electrode spacing [21, 22]. The electrical current is injected into the ground by active outer electrodes, and the resistance is measured at various locations along the line by inner potential electrodes. The current–electrode separation is gradually increased during the survey while potential electrodes remain unchanged until the measured voltage becomes too small to be detected.
3.1.1. The Limitations Associated With Using a Limited Number of VES Points
VES is a geophysical method used to investigate subsurface properties by measuring electrical resistivity at various depths. However, using a limited number of VES points presents several limitations and uncertainties. One major limitation is poor spatial resolution, which can lead to significant subsurface features being missed or poorly resolved, resulting in an incomplete or inaccurate subsurface model [20]. Additionally, VES data can produce nonunique interpretations, where different subsurface models can explain the same resistivity data. This issue is exacerbated by a limited number of VES points, as fewer data constraints increase the uncertainty in interpreting subsurface features. Depth penetration is another critical limitation, as the depth of investigation in VES depends on the electrode spacing. With insufficient VES points, coverage may be inadequate to probe deeper subsurface layers, leading to incomplete information about deeper geological structures and creating gaps in the subsurface profile [21]. Furthermore, subsurface conditions can be highly heterogeneous, and a limited number of VES points may fail to capture this variability effectively. This results in an oversimplified model that does not accurately reflect the true complexity of the subsurface, potentially leading to misinterpretations and erroneous conclusions. Data quality and noise also pose significant challenges. The quality of VES data can be affected by factors such as instrument noise, cultural noise, and environmental conditions. With fewer VES points, it becomes more challenging distinguishing between true subsurface features and noise becomes more challenging, increasing the likelihood of misinterpreting noise as geological features or vice versa. These limitations and uncertainties collectively highlight the importance of using an adequate number of VES points to obtain a more accurate and reliable understanding of the subsurface [20, 22].
3.2. The Magnetic Method
In this method, the measured anomalous magnetic field results from the presence of subsurface geological structures or buried targets [20, 23, 24]. The anomaly overlies the background geomagnetic field, and its amplitude and shape depend on the susceptibility, shape, and orientation of the subsurface geological structure [25]. To produce a magnetic anomaly, the data must be corrected to account for the effect of latitude and, to a lesser extent, longitude [23]. As reported by Teklemariam (preprint) [16], more than 240 magnetic data point readings (Figure 5), distributed along the VES lines and at random points, were collected. After various corrections were applied to the raw data, the anomaly was interpreted qualitatively and quantitatively by preparing profile curves and different contour maps to obtain information about the depth of a particular magnetic body, its shape, size, and details about its magnetization. The results were processed and analyzed using Oasis Montaj 2D gridding, contouring, and mapping software [26]. For effective interpretation of magnetic data, further enhancements were performed using various transformations, such as the analytical signal, horizontal and vertical derivative and gradient, reduced to pole (RTP), and tilt angle derivative, as reported by Teklemariam (preprint) [16].

4. Data Acquisition and Processing Methods
A total of 14 VES_points were conducted over five survey lines, and more than 240 magnetic data point readings were collected for mapping and analysis, as well as for profile plots and 2D modeling of the data [16]. Furthermore, six existing water well data from the vicinity of the study area were included to help calibrate the electrical data and facilitate better interpretation (Figures 3 and 5).
While plotting of the VES data on the log–log paper, the curve became segmented due to overlapping measurement when the potential electrode distance (MN/2) increases as the AB/2 lengthened. Therefore, to produce a smooth curve for better interpretation, the segmented curves were shifted to align with the small points of the MN curve [23, 27]. VES data were also preprocessed using the WinRESIST software through close visual examination, selection, and removal of noisy data to obtain the model resistivity sections with better resolution. Two approaches to interpretation—qualitative and quantitative—were used to present the field data [16]. The number of layers and their relative resistivity values were determined by observing the shape of the field data curve using the qualitative interpretation technique. The parameters resulting from the interpretation of VES data using the IPI2win software were used to create the initial model layer parameters for the WinRESIST inversion software. Acceptable error values ranged from 2.0% to 5.0%. The quantitative method, on the other hand, involves obtaining the geoelectric parameters, that is, true resistivity and layer thickness of the layers of the subsurface. To determine the presence and depth of shallow geological structures, such as dikes, faults, fractured zones, and layer contacts, different magnetic maps were constructed using the corrected data and qualitatively interpreted. These maps include the RTP map, regional total magnetic anomaly (TMA) map, analytic signal (AS) map, residual map, horizontal derivative of the tilt derivative (HD-TDR) map, upward continuation (UC) at 500- and 1000-m maps, and Euler deconvolution plots for depth-to-source mapping, as reported by Teklemariam (preprint) [16]. Furthermore, 2D modeling of the data for selected profiles was conducted. Magnetic data analysis and processing were performed using a specialized computer program, Oasis Montaj [26].
5. Results and Discussion
5.1. Interpretation of VES Curves
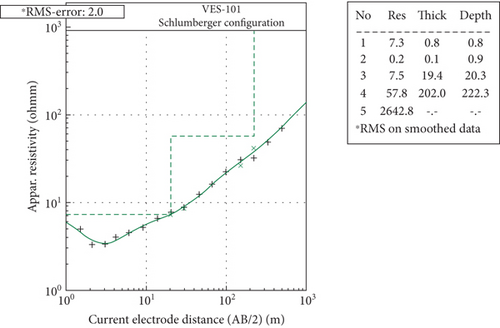
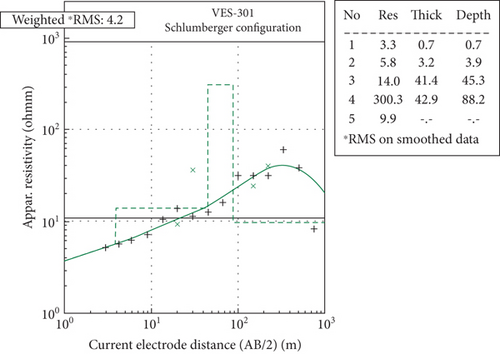
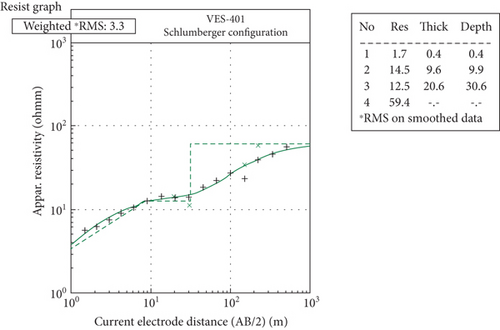
The interpretation of each VES dataset was carried out using a combination of IPI2win and WinRESIST inversion software, which resulted in one-dimensional (1D) models of the VES data. These models were further integrated with the lithological logs to produce the geoelectric sections, using AutoCAD software [28] to draw each section. As reported by Teklemariam (preprint) [16], the 1D models of the VES data were compared with the field data curves plotted on a log–log paper and showed a good correlation between the two for all sounding points with RMS error ranging from 2% and 5% (Figure 6). The additional data (see Appendix S1A to Appendix S1N) provides further insights.

5.2. Pseudodepth Section of the Profiles
The 2D section of the apparent resistivity response shows that the upper part of all three sounding points across all profile lines exhibits low resistivity values (Figure 7).

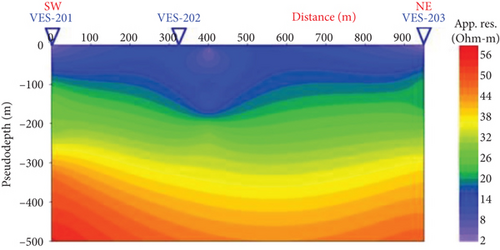
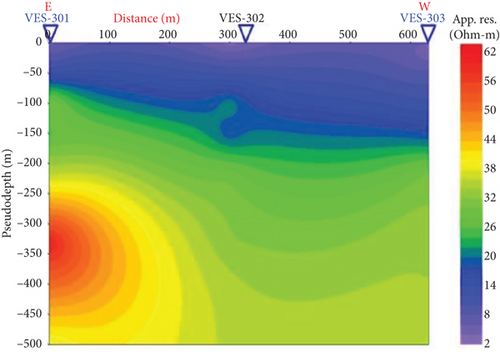
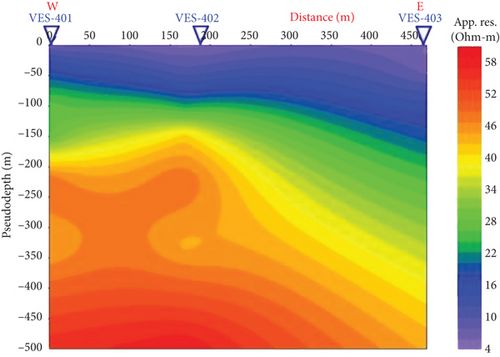
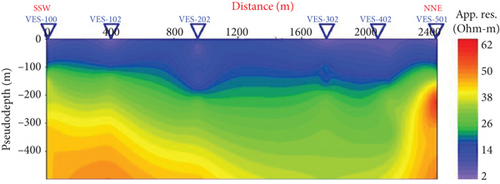
This low resistivity value increases downward to some extent under all sounding points; however, the increase in the apparent resistivity is nonuniform. According to the research result [16], for Profile 1, VES-102 exhibits a low resistivity value extending to greater depth, indicating a horizontal variation of resistivity at the bottom suggesting that the region of VES-102 is potentially water saturated at a deeper depth relative to VES-101 and VES-103. For Profile 2, the resistivity values increase smoothly from the upper part to the lower part under VES-201, VES-202, and VES-203.
However, the resistivity does not show an exaggerated increase at the bottom of these VES points. Thus, the region under this section generally shows a low resistivity range (2 to 60 Ω-m) indicating potential water saturation or a weathered stratum with less weathering at depth. The upper portion of the pseudodepth section for Profile 3 shows low resistivity with no lateral variation under all three sounding points. However, the bottom portion beneath VES-301 displays a higher resistivity value compared to VES-302 and VES-303. The area beneath these points is relatively more conductive than VES-301, showing a lateral variation in resistivity at the bottom. The low resistivity zone under VES-302 and VES-303 indicates good potential water saturation [16].
For Profile 4, the lower layer beneath VES-401 and VES-402 is more conductive than VES-403, indicating some lateral variation of the resistivity in the lower part of the section. The large low resistive region under VES-403 suggests potential groundwater. To assess how the subsurface resistivity varies in different azimuths, Profile 5 was constructed along the longest direction of the study area using six strategically selected VES points: VES-100, VES-102, VES-202, VES-302, VES-402, and VES-501, as reported by Teklemariam (preprint) [16]. This line is approximately perpendicular to the previous four profiles (see Figure 5). The bottom part this profile shows a lateral variation of resistivity, with regions under VES-100, VES-102, VES-202, and VES-501 being relatively conductive. The wide region beneath VES-302 and VES-402 shows a low resistivity, which could indicate a potential zone of groundwater accumulation.
5.3. Geoelectric Section of the Profiles
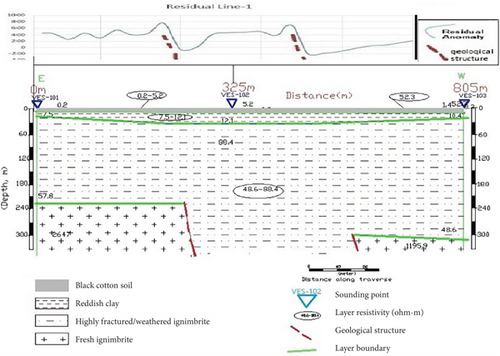
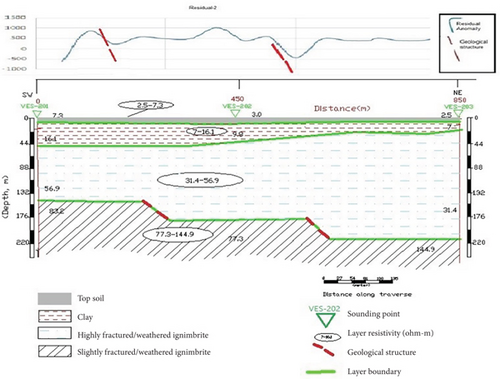
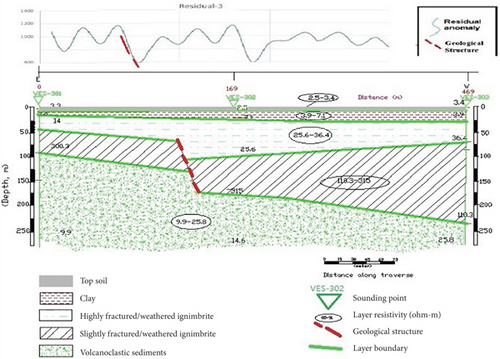
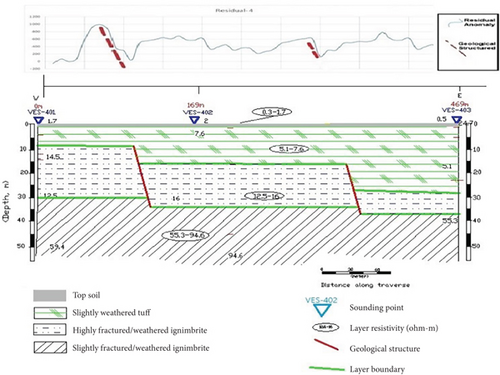
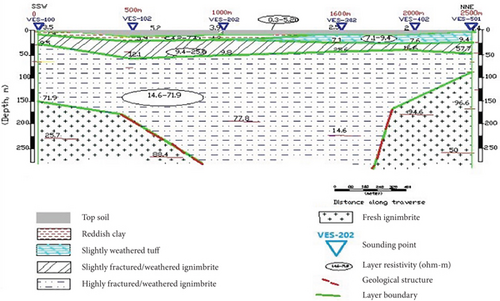
The subsurface geological units interpreted in the study area (Figure 8) can be divided into three distinct geological layers based on their true electrical resistivity and thicknesses interpreted from the data profiles (Figure 6) as reported by Teklemariam (preprint) [16]. The upper part of this sequence belongs to the Quaternary period and consists of gravel, sand, and silts mixed with rock fragments and sand. Beneath this deposit, the second layer is from the Pliocene peralkaline pantelleritic ignimbrites and is generally represented by the Nazret pyroclastic of the north and central MER [13]. Below the ignimbrite unit, the layer consists of the volcanoclastic sediments and/or volcanic sand/ash. The electrical properties of these geological sequences are detailed below.
5.3.1. Geoelectric Section of Profile 1
This section (Figure 8(a)) represents the black cotton soil layer, reddish clay, highly fractured and weathered ignimbrite, and fresh ignimbrite from top to bottom, with electrical resistivity from approximately 0.2 to 5.2 Ω-m at the top of this horizon (due to the presence of clay layer) to about 1195 to 2647 Ω-m at the bottom, most likely indicating fresh ignimbrite. The geoelectric section below the second layer shows resistivity values ranging from 48.6 to 88.4 Ω-m. This layer probably indicates highly weathered ignimbrite and slightly to highly fractured ignimbrite, which is a relatively good groundwater potential zone. This layer has an average thickness of about 160 m, and the top of the potential water-saturated zone/aquifer lies at a depth of 58, 30, and 48 m below VES-101, VES-102, and VES-103, respectively [16]. This interpretation is validated by borehole data from Shochora Ogodama_SWL-37.70, Huletegna-Gututo-01_SWL-35.50, and Huletegna-Gututo-02_SWL-35.50 (see Appendix S2C, Appendix S2D, and Appendix S2E), which confirm the presence of these geological formations and their respective resistivity values.
5.3.2. Geoelectric Section of Profile 2
This section (Figure 8(b)) represents the layer of topsoil, clay, highly fractured and weathered ignimbrite, and slightly fractured and weathered ignimbrite from top to bottom and varies in electrical resistivity of around 2.5 to 7.3 Ω-m at the top of this horizon to approximately 77.3 up to 144.9 Ω-m at the bottom. The layer underlying the second geoelectric section has a resistivity value between 31.4 and 56.9 Ω-m and with an average thickness of 93 m. This geoelectric section represents highly fractured ignimbrite. Based on its low resistivity value and optimum thickness, the layer could be a potential zone for groundwater accumulation [16]. This interpretation is validated by borehole data from Huletegna-Gututo-01_SWL-35.50 and Huletegna-Gututo-02_SWL-35.509 (see Appendix S2D and Appendix S2E), which confirm the presence of these geological formations and their respective resistivity values.
5.3.3. Geoelectric Section of Profile 3
This section (Figure 8(c)) represents the layer of top soil, clay, highly fractured and weathered ignimbrite, slightly fractured and weathered ignimbrite, and volcanoclastic sediments from top to bottom and varies in electrical resistivity of approximately 2.5 to 3.4 Ω-m at the top of this horizon to about 110.3 to 315 Ω-m. The resistivity value decreases in the lower section ranging from 9.9 to 25.6 Ω-m which indicates the presence of volcanoclastic sediments below the ignimbrite unit. There are two-stage aquifers in the study area: a deeper fractured ignimbrite and a volcanoclastic sediment aquifer covered by the shallow weathered ignimbrite aquifer [16]. This interpretation is validated by borehole data from Huletegna-Gututo-02_SWL-35.50 and Gututo Larena Borehole_BH-2 (see Appendix S2B and Appendix S2E), which confirm the presence of these geological formations and their respective resistivity values.
5.3.4. Geoelectric Section of Profile 4
This section (Figure 8(d)) represents the layer of topsoil, slightly weathered tuff, highly fractured and weathered ignimbrite, and slightly fractured and weathered ignimbrite from top to bottom, with electrical resistivity ranging from approximately 2.5 to 7.3 Ω-m at the top to about 55.3 to 94.6 Ω-m. The third layer, with a resistivity value of 12.5 to 16 Ω-m and a thickness ranging from 10 up to 25 m, represents highly fractured and weathered ignimbrite. Due to its low resistivity and moderate thickness, this layer could be a good potential zone for groundwater accumulation [16]. This interpretation is validated by borehole data from Gututo Larena Borehole_BH-2 (see Appendix S2B), which confirm the presence of these geological formations and their respective resistivity values.
5.3.5. Geoelectric Section of Profile 5
This profile (Figure 8(e)) is perpendicular to all other lines and represents the layer of topsoil, reddish clay, slightly weathered tuff, highly fractured and weathered ignimbrite, slightly fractured weathered ignimbrite, and fresh ignimbrite. The resistivity value of this section is 0.3 to 5.2 Ω-m at the top. The fourth geoelectric layer with a resistivity value ranging from 14.6 to 71.8 Ω-m and an average thickness of 78 m represents the highly fractured and weathered ignimbrite, which could be the potential zone for groundwater [16]. This interpretation is validated by borehole data from Shochoro-Pesho-BH-1, Gututo-Larena Borehole_BH-2, Huletegna-Gututo-01_SWL-35.50, Mino-Koysha_SWL-35.50 (see Appendix S2B, Appendix S2D, and Appendix S2F), which confirm the presence of these geological formations and their respective resistivity values.
5.4. Sliced Stacking Section for Different AB/2
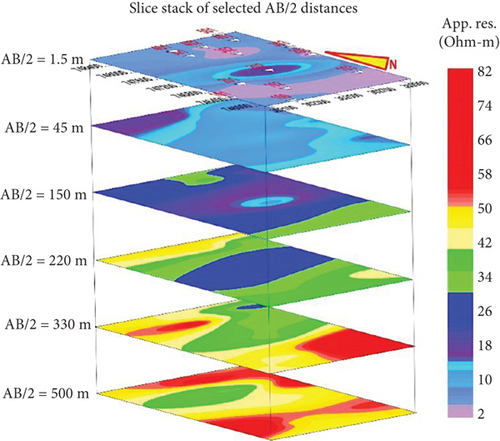
A sliced stack map (as shown in Figure 9) better demonstrates the vertical and horizontal variation in the relative apparent resistivity value of the area for the location of the well site. This variation in the resistivity value in the area was constructed by selecting different AB/2 distances depending on the variability between them, as reported by Teklemariam (preprint) [16].
5.5. Interpretations of Magnetics
After correcting for the effects and noises from a wide variety of sources and International Geomagnetic Reference Field (IGRF) correction (by subtracting the main geomagnetic field from the diurnal corrected observed data), the result of this processing is the magnetic anomaly [24, 25, 29]. The results were further processed and analyzed (Figure 10) using Oasis Montaj, a 2D grid contouring and mapping software [26]. For effective interpretation of magnetic data, further enhancements were performed using various transformations such as analytical signal, horizontal/vertical derivative and gradient, RTP, and tilt angle derivative as reported by Teklemariam (preprint) [16].
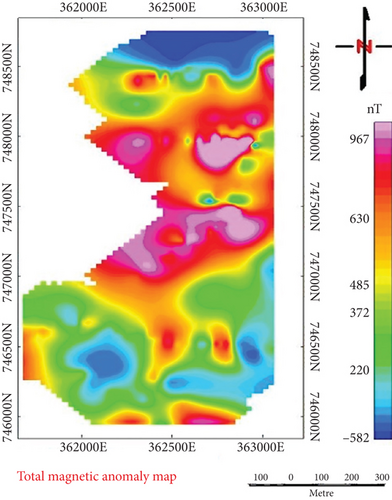
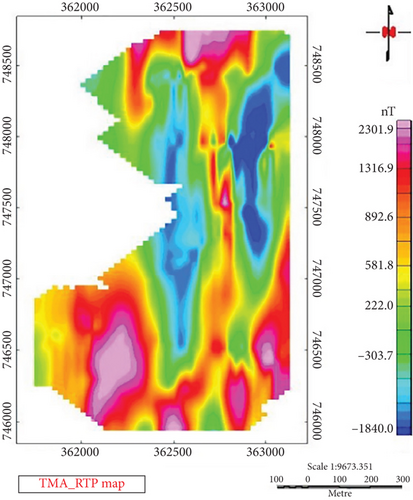
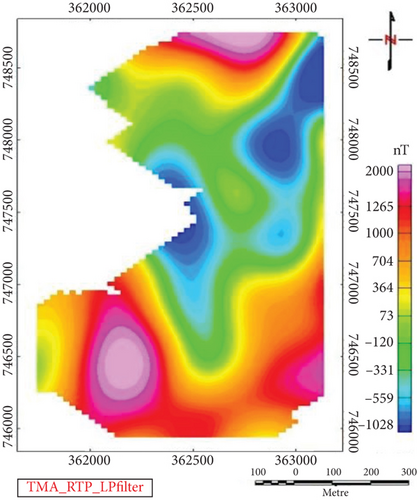
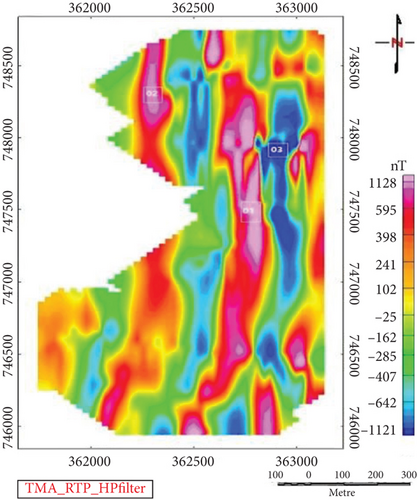
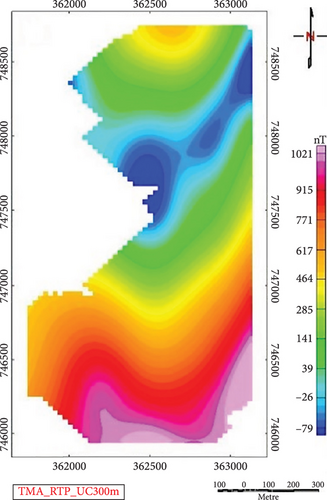
The analytical signal map (Figure 11(b)) represents the shallow subsurface conditions because it highlights the impulse response of the target body from the upper part. UC (Figure 11(c)) is inherently stable. It acts as a smoothing filter and is beneficial for diminishing the field strengths from shallow magnetizations (residual anomaly) to focus only on deeper sources (regional anomaly) since the effect of the filter can be properly compensated by changing the elevation.
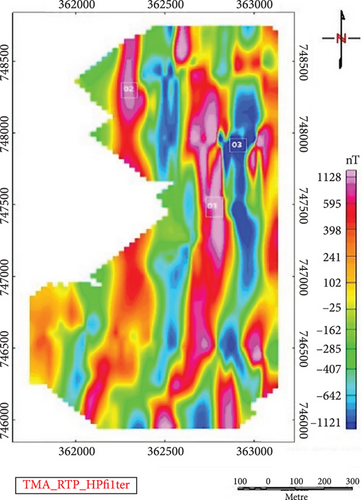
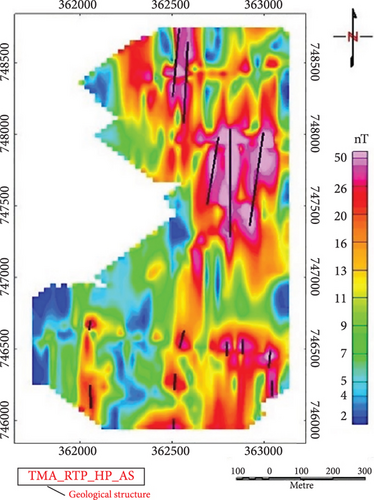
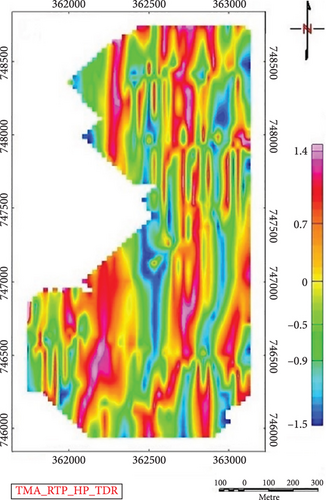
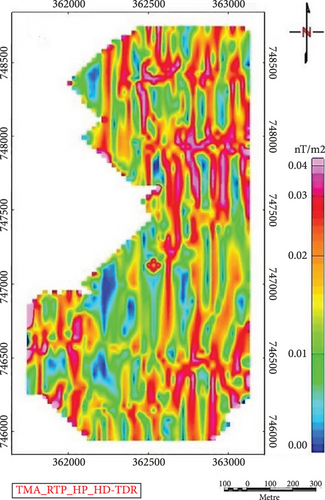
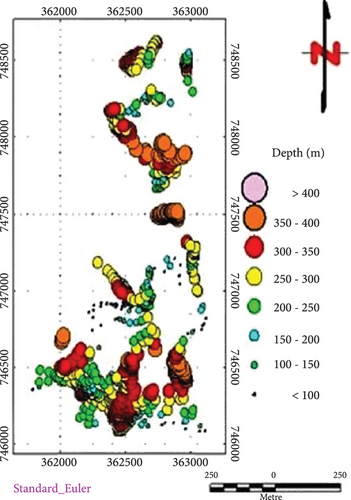
For edge detection of a magnetic structure, two-phase filters—specifically the tilt derivative (TDR) and the HD-TDR, also known as the total gradient of the tilt angle—are utilized. The tilt angle filter is relatively less sensitive to the depth of the source, making it effective for both shallow and deep sources (Figures 11(c) and 11(d)). The Euler deconvolution technique was employed to determine the location and estimate the depth of causative anomalous bodies/structures in the study area. These structures are predominantly concentrated in the central and southern parts of the study (Figure 11(f)). Shallow structures particularly those 150 m deep are considered important for regional groundwater exploration. The Euler solution maps (presented in Figure 11(f)) indicate several 1D linear structures (fracture/fault), with a direct coincidence of clustering solutions with known regional features such as the MER.
5.5.1. Magnetic Structural Analysis and Rose Diagram Interpretation
Analysis of magnetic data and the rose diagram, generated from data from maps of the residual magnetic anomaly, UC, TDR, and horizontal derivative, reveals that the structural lineaments predominantly strike between 180° and 209°, corresponding to SSW–NNE orientation. The residual magnetic anomaly map highlights variations in magnetic intensity, while UC smooths the anomaly data to reveal deeper structures. The TDR and horizontal derivative map enhances the visibility of fault and fracture boundaries. The strike directions shown in the rose diagram are derived from the orientation of these structural features as detected in the processed magnetic data. The rose diagram (Figure 12) illustrates these orientations, highlighting the frequency and direction of the structural lineaments.
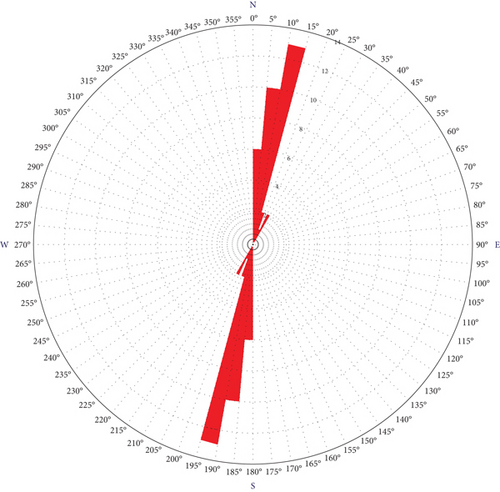
This local orientation is influenced by the regional NE–SW extensional regime of the SMER, where the predominant regional stress field is likely oriented NW–SE. The multiple peaks within this specific strike range suggest significant structural features that enhance permeability and serve as primary groundwater flow pathways. Additionally, these orientations may represent secondary structures influenced by local stress variations or reactivated pre-existing structures. The SSW–NNE orientations may correspond to transfer faults or accommodation zones within the rift, indicating zones of weakness or reactivated structures under the current stress regime. Understanding these structural controls is crucial for effective regional groundwater exploration and sustainable resource management.
5.6. 2D Magnetic Modeling
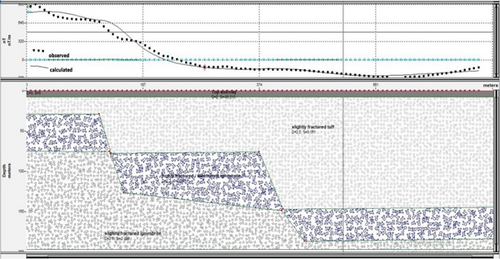
The 2D magnetic forward models are not intended to represent exact or highly detailed rock models. Instead, their primary purpose is to support the deformation zone modeling by providing indication, particularly concerning the dip and width of low magnetic zones. Estimating the physical properties of subsurface geological units is crucial. The model identifies the presence of weak zones (fracture/fault) at a horizontal profile distance of 62 m (from a depth of 20 m that extends to 130 m) and 374 m (from a depth of 70 m that extends to 170 m) along Line 4 (Figure 13). The geological units described for the magnetic 2D model of Line 4 include topsoil, tuff, highly fractured and weathered ignimbrite, and slightly fractured ignimbrite.
6. Geological Structures Controlling the Hydrogeological Setting
The hydrogeological setting of the study area is primarily controlled by its geological structures. The area consists of volcanic rocks such as ignimbrite, welded tuff, rhyolites, trachyte flows, and minor basalt, as well as flood basalts with minor silicic flows, pumice, and pyroclastic rocks. These rocks exhibit varying degrees of porosity and permeability, influenced by their weathering and fracturing. Faults and fractures, particularly in the highly weathered and slightly to highly fractured ignimbrite, significantly enhance permeability, making these zones favourable for groundwater flow. The area features a two-stage aquifer system: a deeper aquifer composed of fractured ignimbrite and an overlying volcanoclastic sediment aquifer, covered by a shallow aquifer of weathered ignimbrite. The 2D magnetic forward models reveal weak zones (fractures/faults) that influence groundwater movement by indicating the dip and width of low magnetic zones. Estimating the physical properties of these subsurface geological units is essential for understanding the hydrogeological dynamics. In summary, the hydrogeological setting is controlled by volcanic rock units with varying degrees of weathering and fracturing, faults and fractures enhancing permeability and groundwater flow, a two-stage aquifer system (deep fractured ignimbrite and shallow weathered ignimbrite with an intermediate volcanoclastic sediment aquifer), and structural features such as weak zones influencing groundwater movement and distribution. Overall, the combination of these geological factors collectively controls the groundwater flow and storage in the area.
7. Conclusions
- i.
Low resistivity horizons at various depths revealed the existence of aquifer beds on the basis of the apparent resistivity pseudodepth section, the sliced–stacked map and geoelectric sections, and their physical suitability. Slightly to highly weathered ignimbrite and volcanoclastic sediments are identified as the main subsurface geological units that are considered the main water-bearing horizons, especially under VES-102, VES-201, VES-202, and VES-302, with a thickness ranging from 20 up to 94 m.
- ii.
The geological structures that play a great role in the accumulation and flow of groundwater were revealed from the geoelectrical section and the 2D magnetic maps. These structures are more concentrated in the central and southern parts of the study area.
Disclosure
This manuscript is based in part on my master’s thesis submitted to Addis Ababa University, available at Addis Ababa University’s repository (http://etd.aau.edu.et/handle/123456789/27261).
Conflicts of Interest
The author declares no conflicts of interest.
Funding
This work was not supported by any funding.
Acknowledgments
I express my sincere gratitude to Professor Tigistu Haile (Addis Ababa University, Ethiopia) for the continuous support of my study and research and for his patience, motivation, enthusiasm, and immense knowledge.
Open Research
Data Availability Statement
The data used in this research are available upon request from the corresponding author.


