Performance Evaluation of the Ionospheric Models AfriTEC and NeQuick 2 at the BF01 Station in Ouagadougou Between 2013 and 2021
Abstract
This manuscript examines the performance of two ionospheric models, AfriTEC and NeQuick 2, at station BF01 (lat. 12.3714° N, long. −1.5197° W) in Ouagadougou, Burkina Faso, situated in the West African equatorial region. The study is aimed at aiding in selecting an appropriate ionospheric model for this region, where in situ data are scarce. It involves comparing the VTEC values derived from RINEX files obtained at station BF01 with those provided by the two models, AfriTEC and NeQuick 2. Two periods were distinguished: a period of high solar activity (Rz ≥ 50) between 2013 and 2015 and a period of low solar activity (Rz < 50) from 2016 to 2021. The results show that during periods of high solar activity, both models underestimate VTEC with relative differences of up to −60%. However, AfriTEC is closer to the RINEX values during hours of strong sunlight. Between 2016 and 2021, the performance of the models gradually improves, with AfriTEC being more stable and more consistent with the RINEX data, especially during periods of VTEC peak. NeQuick2 performs less well during hours of strong sunshine and at night, with greater deviations from the RINEX data. From this study, it emerges that AfriTEC is the most suitable ionospheric model for predicting VTEC at station BF01.
1. Introduction
The ionosphere, located between approximately 60 and 1000 km above the Earth’s surface, is an ionized region of the Earth’s atmosphere where neutral particles (molecules and atoms) and charged particles (electrons and ions) coexist. This layer plays a fundamental role in many atmospheric science disciplines, including telecommunications [1] and global navigation satellite systems (GNSS) [2]. Free electrons in the ionosphere interact with signals emitted by GNSS satellites, modifying their speed and direction of propagation. These interactions are one of the biggest sources of positioning errors for single-frequency GNSS receivers [3, 4]. In view of this, a thorough understanding of the ionosphere and its variability is required.
The effect of the ionosphere on signals is proportional to one of its parameters known as the total electron content (TEC). TEC is a measure of the total number of free electrons contained in a cylinder with a cross section of 1 m2 between a satellite and a ground receiver [5].
The TEC can be estimated from GNSS data recorded in RINEX files [6] or simulated using ionospheric models [7]. These models, by reproducing ionospheric dynamics, become crucial tools to analyze and predict TEC variations.
The equatorial region of the ionosphere is particularly complex due to specific phenomena such as the equatorial fountain effect, the prereversal enhancement (PRE) mechanism [8], the equatorial electrojet [9], and equatorial anomalies [10]. These processes amplify the effects of the ionosphere on GNSS and communications systems.
However, the West African equatorial region remains understudied due to a low density of GNSS stations and the scarcity of in situ data [11–13]. These gaps limit our understanding of ionospheric phenomena and the accuracy of models in this strategic region for satellite communications.
In this context, the use of ionospheric models becomes essential to estimate ionospheric parameters such as the vertical total electron content (VTEC). However, model performance varies according to geographical regions and geophysical conditions [14]. The performance of the AfriTEC model during calm and disturbed periods in the equatorial region and in the low latitude region, in the East African sector, was evaluated [15]. These authors found that the model presents better performance during the years of solar maximum compared to the years of solar minimum. Nibigira et al. [16] compared the performance of the NeQuick-G, IRI-2016, IRI-Plas 2017, and AfriTEC models in the African region during the geomagnetic storm of March 17, 2015. The results of their predictions show that the performance of the regional model (AfriTEC) is better than that of the global ionospheric models (IRI-2016 and NeQuick-G models). Ahoua et al. [17] analyzed the performance of the NeQuick model during different geomagnetic conditions during the ascending phase of Solar Cycle 24 in the South African sector. The results of this study show that NeQuick forecasts are affected by solar activity. Thus, the model forecasts are much better during periods of moderate solar activity and present divergences with observations during periods of high solar activity. This could be because NeQuick is a quiet time model.
These various studies show that the quality of forecasts depends on the types of models and the periods of solar activity. It is therefore important to know how to choose the model that performs best for a given period.
This study is aimed at evaluating the performance of two ionospheric models, AfriTEC and NeQuick 2, in the West African equatorial region in order to contribute to a better choice of model for the extraction of VTEC data. The analysis covers the period 2013–2021 and focuses on data from station BF01 in Ouagadougou.
This manuscript is structured as follows: (1) detailed presentation of the ionospheric models studied, (2) description of the data and the study method, and (3) presentation and discussion of the results obtained. Finally, a conclusion proposing ways of improving the models for better adaptation to the specific characteristics of the equatorial ionosphere closes this manuscript.
2. Presentation of the AfriTEC and NeQuick 2 Models
This section presents the two models used to model the VTEC at station BF01, for comparison with the results obtained from the RINEX files.
2.1. AfriTEC Model
AfriTEC is the first regional VTEC model developed specifically for the entire African continent using the Global Positioning System (GPS). It was developed by the Atmospheric Research Centre of the National Space Research and Development Agency of Nigeria, in partnership with the CV Raman International Fellowship Scheme, the Indian Institute of Geomagnetism, and the South African National Space Agency [4]. The AfriTEC model is based on the use of artificial neural networks to estimate VTEC from GPS data. These GPS data are collected by ground receivers and satellites dedicated to observing meteorology, the ionosphere, and climate in Africa. The model takes into account the F10.7 solar index as an indicator of the level of solar activity and the Dst index to characterize geomagnetic activity.
AfriTEC covers a vast geographical area ranging from longitudes of 25° west to 60° east and latitudes of 40° south to 40° north. It provides estimates of the ionospheric TEC for the entire African region. For Version 2.3 of the model, used in this study, it is recommended to use it for the periods from 2000 to 2022.
- -
Centre for Atmospheric Research website: https://carnasrda.com/tec_models/
- -
MATLAB Central site: https://www.mathworks.com/matlabcentral/fileexchange/69257-africangnss-tec-afritec-model
The program’s main file, AfriTEC.m, is delivered in a folder containing all the files needed to run it. The simple and easy-to-use graphical user interface allows users to generate diurnal profiles or spatial maps of TEC. Users can also generate diurnal profiles for all days of a year by checking a specific box. The inputs required are the year, the day of the year (or the month and day of the month), and the time of day (UT), as well as the longitude, latitude, and station code. Once the parameters are filled in, the program produces the results in text and graphical form and stores them automatically in a folder named Output, generated in the working directory of the program.
2.2. NeQuick 2 Model
NeQuick stands for “quick calculation of Ne,” where Ne stands for electron density. NeQuick is an empirical model of ionospheric electron density designed for rapid applications adapted to transionospheric propagation. It was developed at the Aeronomy and Radiopropagation Laboratory (now the T/ICT4D Laboratory) of the Abdus Salam International Centre for Theoretical Physics (ICTP)—Trieste, Italy, in collaboration with the Institute of Geophysics, Astrophysics and Meteorology at the University of Graz, Austria. This model has been presented in detail in several scientific studies, including those by [18–20].
- •
The peak of the E layer, characterized by the parameter foE
- •
The F1 layer peak, defined by the foF1 parameter
- •
The F2 layer peak, modeled by foF2 and the transmission factor at 3000 km of the F2 layer M(3000)F2
These parameters can be obtained either from experimental measurements or from modeling (e.g., ITU-R coefficients for foF2 and M3000). The upper part of the ionosphere is represented by a semi-Epstein layer, whose thickness depends on height and is determined empirically.
NeQuick is an evolving model that is regularly updated by integrating ionospheric data collected both on the ground and in situ. The latest version of the model, NeQuick 2 [19], is the one used in this study. An interactive version of NeQuick 2 is accessible via a web interface, available at https://t-ict4d.ictp.it/nequick2.
The model outputs include electron density profiles for positions defined according to height, geocentric latitude, and geocentric longitude on a spherical Earth. The model takes account of solar activity, season, and time to produce accurate results. In addition, it provides routines for estimating the electron density along any ground-satellite path and the corresponding TEC obtained by numerical integration.
In this work, we used a MATLAB version of NeQuick 2. This MATLAB version is specially adapted to model the monthly medians of the VTEC for a given station, which makes it an ideal tool for our work at station BF01.
3. Data and Methodology
3.1. Data
- •
GNSS-CORS data
- •
Simulations of the AfriTEC and NeQuick 2 models
VTEC has also been simulated using the ionospheric models AfriTEC and NeQuick 2, enabling a comparison with the results obtained from GNSS-CORS data.
To characterize the intensity of solar activity over the period studied, we also used data on the annual average sunspot number (Rz). These data, taken from the latest updated version of this solar index, were downloaded from the NASA OMNIWeb website at https://omniweb.gsfc.nasa.gov/form/dx1.html.
3.2. Methodology
3.2.1. VTEC Extraction
The STEC is then converted to a VTEC by considering the ionosphere as a single layer concentrated on a spherical shell of infinitesimal thickness located at an altitude H above the Earth’s surface [23, 25, 26]. Figure 1 illustrates this infinitesimal layer approximation at height H above the Earth’s surface. In this work, H is taken equal to 450 km to correspond to the height of the maximum electron density at the peak of the F2 layer. The altitude of this peak varies from 350 to 500 km at equatorial latitudes [28].
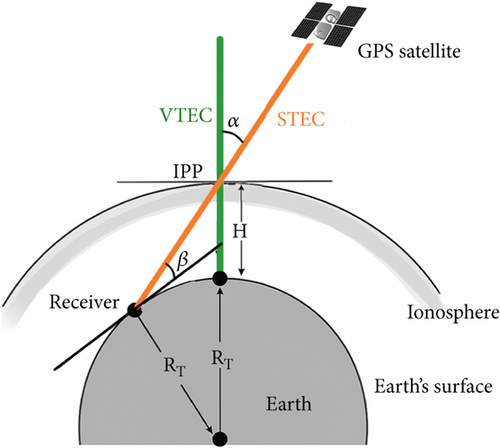
With RT = 6371.2 km, the mean radius of the Earth H = 450 km is the altitude of the ionospheric layer.
The steps of the VTEC extraction process from raw GNSS data from station BF01 (lat. 12.3714° N, long. −1.5197° W) are detailed in [29, 30].
3.2.2. Comparison of VTEC
- •
ΔVTEC ≥ 20% indicates an overestimation of the VTEC by the model
- •
ΔVTEC ≤ −20% indicates an underestimation of VTEC by the model
- •
−20% < ΔVTEC < 20% indicates that the model is considered to provide a good estimate of the VTEC
To have a simplified binary approach in data analysis, solar activity was classified into two periods according to annual Rz values: the period of low solar activity corresponding to years of Rz < 50 and the period of high solar activity corresponding to years of Rz ≥ 50.
Table 1 shows the distribution of years according to this classification.
| Groups | Group 1: Rz ≥ 50 | Group 2: Rz < 50 |
|---|---|---|
| Years | 2013, 2014, 2015 | 2016, 2017, 2018, 2019, 2020, 2021 |
4. Results and Discussion
4.1. Periods of High Solar Activity: 2013 to 2015
Figures 2, 3, and 4 illustrate the variations in monthly median VTEC values derived from the RINEX files (red curve), the AfriTEC model (green curve), and the NeQuick 2 model (blue curve) during 2013, 2014, and 2015, respectively. The relative ΔVTEC differences between the VTEC_RINEX and the models’ VTECs are also shown. Each panel is divided into two parts: the upper part shows the monthly VTEC variations, while the lower part illustrates the relative ΔVTEC deviations with two horizontal lines in magenta indicating the ±20% limits. For periods when RINEX data are missing, neither the VTEC curves nor the relative deviations are plotted.
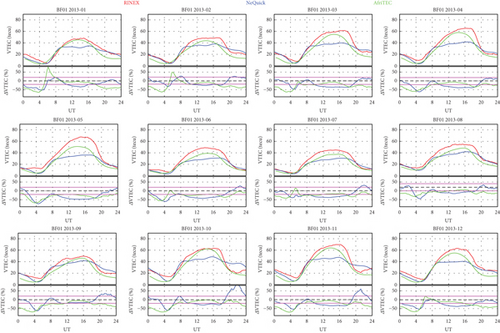
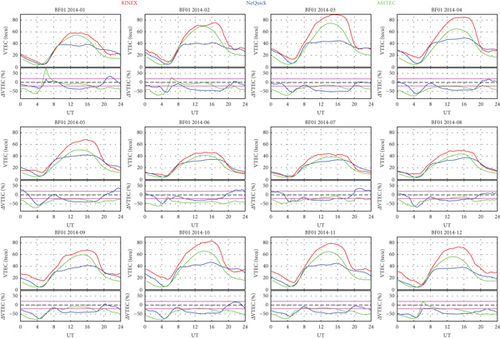

The figures show that the VTEC derived from the RINEX data exhibits two types of profiles according to the classification of [33]: the dome profile and the plateau profile, with a dominance of the dome profile. In comparison, the AfriTEC model systematically reproduces the dome profile, while NeQuick 2 generates the plateau profile. The dome profiles of the VTEC-RINEX generally coincide with those of the AfriTEC model, and the plateau profiles are close to those of the NeQuick 2 model. These results indicate that AfriTEC effectively reproduces the dome profiles, while NeQuick 2 models reproduce the plateau profiles better. At station BF01 (located in the trough of the equatorial ionospheric anomaly (EIA) near the northern peak), the two models show different performances. According to the interpretations of [34, 35] in the equatorial region, AfriTEC performs well in the absence of an equatorial electrojet, whereas NeQuick 2 seems to model better during the periods when the electrojet is weak.
The VTEC-RINEX profiles from October 2013, November 2013, and February 2014 show an evening peak, characteristic of the prereversal increase in the electric field (PRE) [36–38]. This peak is observed on some NeQuick profiles but remains absent from AfriTEC profiles. This indicates that NeQuick 2 is able to account for the increase in the electric field before its inversion (PRE), but AfriTEC does not reproduce this feature of the profiles.
The analysis of the relative deviations reveals variability depending on the time of day, season, and year.
For the AfriTEC model, the results show that over the entire period from 2013 to 2015, the VTEC derived from this model is generally lower than that derived from the RINEX files. During the night-time periods (0000–0600 and 1800–2400 UT), the relative difference is systematically less than −20%, indicating a constant underestimation of the VTEC by AfriTEC at station BF01. During the day, between 0800 and 1700 UT, although the model continues to underestimate VTEC, the relative deviation is in a more moderate range, between 0% and −20%. This indicates a better estimation of the VTEC by the model. The curves reveal a notable anomaly in January and February of 2013 and 2014, when the model overestimates the VTEC between 0500 and 0700 UT, with relative deviations exceeding 50%.
These results show that AfriTEC correctly reproduces diurnal variations in VTEC during periods of high solar radiation but tends to underestimate night-time values and shows specific anomalies during morning–night transitions. These observations are in agreement with [17] for whom the AfriTEC model performs better during years of solar maxima.
- •
between 0000 and 0600 UT, NeQuick 2 significantly underestimates the VTEC, with relative deviations of less than −20%
- •
between 0600 and 0800 UT, the modeled and measured values are close and sometimes coincide, with relative differences of between −20% and 20%, indicating a good estimate of the VTEC
- •
during the daytime period (0800–1900 UT), the model significantly underestimates the VTEC, with relative differences of less than 50% in some cases
- •
at the end of the day and during the night (1900–2400 UT), the correspondence between modeled and measured values improves, with relative differences of less than 20%. However, overestimates in excess of 50% were observed in October and November 2013 and 2015
These results highlight the limited ability of the NeQuick 2 model to model periods of high solar activity during the day, although it is more accurate at night.
The large variation in relative differences between day and night at station BF01 (lat. 12.3714° N, long. −1.5197° W) is consistent with observations by [39] for equatorial station NKLG (lat. 0.35° N, long. 9.67° E) (Libreville, Gabon). These results could be explained by insufficient consideration of phenomena specific to the equatorial region, such as EIA, PRE, and equatorial plasma bubbles.
In conclusion, both AfriTEC and NeQuick 2 models exhibit variable performances in modeling VTEC at station BF01 (lat. 12.3714° N, long. −1.5197° W) during periods of high solar activity (Rz ≥ 50). Both models underestimate VTEC, with relative deviations sometimes reaching −60%. However, AfriTEC is closer to RINEX values during periods of high solar activity, while NeQuick 2 shows better accuracy for evening peaks and some night periods. These results indicate that targeted improvements are needed to optimize model performances to better account for ionospheric phenomena specific to the equatorial region.
4.2. Periods of Low Solar Activity: 2016 to 2021
Figures 5, 6, 7, 8, 9, and 10 show the variations in monthly median VTEC values derived from RINEX data, the AfriTEC model, and the NeQuick 2 model, as well as the evolution of relative ΔVTEC differences between VTEC_RINEX and VTEC_models for Station BF01 (lat. 12.3714° N, long. −1.5197° W) from 2016 to 2021, respectively.
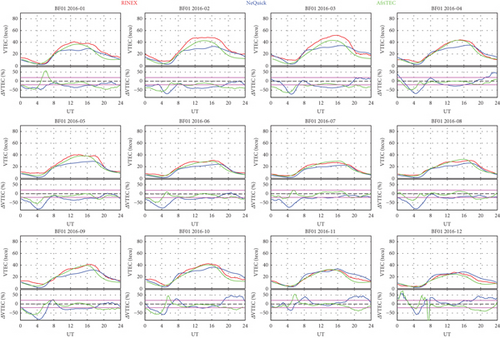

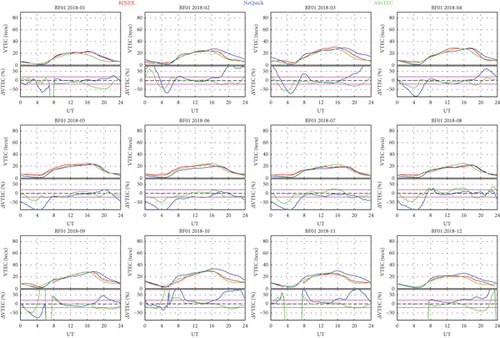
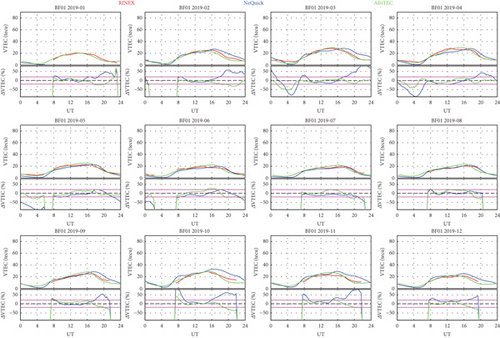
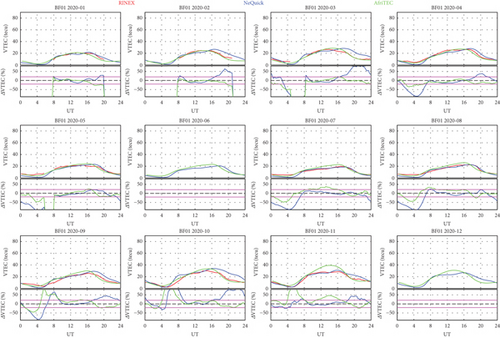
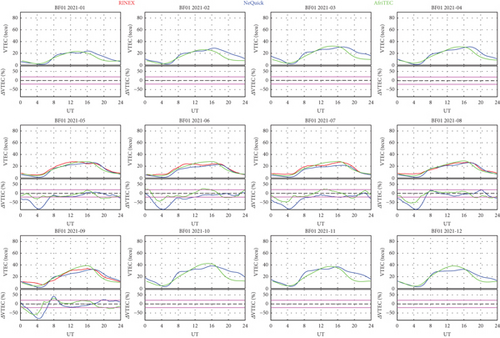
During this period of low solar activity (Rz < 50), the models have limitations in reproducing the observed daily profiles. AfriTEC and NeQuick 2 generate dome and plateau profiles, respectively, while the RINEX data show a more complex variability, alternating between the two types of profiles, with a predominance of the dome profile. According to [34, 35], these profiles are linked to the nature and intensity of the electric currents in the ionosphere: the dome profile indicates an absence of equatorial electrojet, while the plateau profile reflects a weak electrojet. This inability of the models to reproduce certain profiles highlights their limited sensitivity to variations in the equatorial electrojet.
- •
during the night (0000–0600 UT), the model systematically underestimates the VTEC, with relative deviations of less than −20%
- •
during the day (0600–2000 UT), the VTEC_AfriTEC remains lower overall than the RINEX data, but the relative differences are often reduced to ±20%. For some months (April and August 2016, March and April 2019), the differences are practically zero, indicating that the model reproduces the behavior of the VTEC fairly well during hours of strong sunlight
- •
from 2016 to 2021, the relative difference between VTEC_AfriTEC and VTEC_RINEX gradually decreases. This could be due to the fact that solar activity is decreasing from 2016 to 2021
On the whole, AfriTEC is relatively stable, especially during the day, with moderate variations of between 0% and −20%.
The analysis of the curves from the NeQuick 2 model (blue curve) reveals similar trends to AfriTEC, but with more marked deviations from the RINEX data. In fact, the relative differences are sometimes less than −20%, especially between 0800 and 2000 UT. This difference is more pronounced between 0200 and 0800 UT, where it exceeds −50%.
The NeQuick 2 model seems to perform less well in modeling VTEC values at certain times of the day and night, particularly between 0200 and 2000 UT. This result is in line with [40]. According to these authors, the greatest discrepancies between the NeQuick 2 model forecasts and the measured VTEC values are obtained in the equatorial anomaly regions. This could be due to the model not taking into account certain electrodynamic phenomena in the ionosphere in the equatorial anomaly region.
In comparison, AfriTEC performs better than NeQuick 2 for this period (2016 to 2021, characterized by values of Rz < 50), with values closer to the RINEX data, particularly during the VTEC peak. NeQuick 2, despite its ability to follow the overall trend, shows greater weakness during the sunniest hours of the day (between 0800 and 1900 UT) and at night. According to [4, 17], the TEC predictions by the AfriTEC model are better than those predicted by the NeQuick model. These observations are in agreement with our results.
5. Conclusion
In this study, we carried out a comparative analysis of the variations in VTEC obtained from RINEX data and the AfriTEC and NeQuick 2 models in order to evaluate the performances of the latter. We were able to highlight the strengths and limitations of each model in estimating VTEC at the BF01 station in Ouagadougou. Overall, the AfriTEC model showed more stable and consistent performance with the RINEX data, especially between 0800 and 2000 UT. AfriTEC proved to be reliable in reproducing the dome shape of daily VTEC variations. The NeQuick 2 model, although capable of following the general trend of VTEC variations, has some weaknesses. This model practically reproduces plateau-type profiles. The limitations of NeQuick 2 are more pronounced during periods of high solar activity, where it tends to underestimate VTEC, particularly in the middle of the day. Improvements taking into account variations in solar and geomagnetic activity are needed to enhance the capability of both models in different ionospheric conditions, especially in the equatorial zone.
Conflicts of Interest
The authors declare no conflicts of interest.
Funding
No funding was received for this manuscript.
Acknowledgments
The authors would like to express their gratitude to the managers of the Geographic Institute of Burkina (IGB) for allowing access to the raw GNSS-CORS data from the BF01 station in Ouagadougou, Burkina Faso.
The authors also acknowledge the developers of the AfriTEC model, the Centre for Atmospheric Research - National Space Research and Development Agency, the CV Raman International Fellowship Scheme, the Indian Institute of Geomagnetism, and the South African National Space Agency for making the AfriTEC model available.
Finally, the authors would like to express their gratitude to the designers of the NeQuick model.
Open Research
Data Availability Statement
The data that support the findings of this study are openly available in the Geographic Institute of Burkina (IGB) at http://www.bfcors.net. Rz data come from OMNIWEB whose link is: https://omniweb.gsfc.nasa.gov/form/dx1.html.


