Altitudinal Gradient’s Effect on Woody Species’ Diversity, Structure, and Regeneration Status of Ethiopian Highland Forest, Hafursa
Abstract
This study investigated the effects of altitudinal variation on woody species’ diversity, structure, and regeneration status of dry evergreen Afromontane Hafursa forest in Ethiopia. The finding was based on 32 plots of 400 m2 size established systematically, and data on seedlings and saplings were collected from five subplots of 1 m2 size located at the four corners and center of the main plot. A total of 26 woody species belonging to 23 genera and 19 families were identified, with a Shannon-Wiener’s diversity index (H′) of 2.28 at higher altitudes and 2.41 at lower altitudes. The total basal area of the forest was observed to be 9.43 m2/ha for woody species ≥ 2.5 cm in DBH, with the total density of all woody species collected in the forest being 522 individuals per ha. In addition, the study found the predominance of certain species, such as Faurea rochetiana, Ilex mitis, Maesa lanceolata, and Hagenia abyssinica, which showed higher values in the important value index (IVI). An analysis of the population structure and regeneration status indicated that higher altitudes exhibit decreased species diversity and richness compared to lower altitudes. This trend was observed across both altitudes, with the majority of species exhibiting a poor regeneration status characterized by a higher number of mature individuals compared to seedlings and saplings. Therefore, attention should be given to the protection and rehabilitation of this forest’s biodiversity.
1. Introduction
Floristic composition and diversity assessments are fundamental for understanding species structure and evaluating the biodiversity status of forest ecosystems [1, 2]. These studies provide essential insight into forest and ecosystem conservation efforts [3, 4]. The presence and sustainability of species within forest communities are significantly influenced by their regeneration capabilities across varying environmental conditions [5]. The dynamics of seedlings and saplings can serve as indicators of a species’ regenerative potential [6, 7]. Moreover, altitude, among other abiotic and biotic factors, plays an essential role in shaping ecosystem processes [7, 8]. Anthropogenic activities, including deforestation, land-use changes [9, 10], and the introduction of invasive species [11, 12], adversely impact regeneration patterns, leading to decreased biodiversity and reduced carbon stocks [13]. Hence, maintaining diversity, distribution, and community status is essential for preserving ecosystems and enhancing ecological services [14, 15].
The Ethiopian highlands are known as one of the biodiversity hotspots in the world, characterized by diverse environmental and climatic conditions that form various ecosystems [16]. This region constitutes a significant portion of Africa’s Afromontane biomes and is home to numerous ecological units. The complex heterogeneous landscapes of Ethiopia have allowed species to adapt in response to past climatic changes [16]. Previous studies identified that Ethiopia is home to approximately 6200 species out of the estimated 7850 flora species in East Africa, with around 12% being endemic [17].
The natural vegetation of Ethiopia is currently under severe threat from various factors, including logging practices that degrade the structure and composition of woody species, resulting in declines in both forest biodiversity and agricultural productivity [18, 19], and with an annual deforestation rate of 2%, the situation continued [20]. One contributing factor to the decline of woody species’ diversity was the inadequate collaboration between government organizations and local communities regarding forest management strategies [21].
Variations in plant species distributions across altitudinal gradients can be attributed to topographical features and anthropogenic activities [22]. Unsustainable exploitation of these vegetal resources, without consideration for future ecological roles and values, leads to significant resource degradation. Ethiopia faces severe challenges, including land degradation driven by agricultural expansion, deforestation, settlement pressures, and the spread of invasive species [23]. Therefore, implementing scientific assessment and effective policy in the forest is essential for sustainable resource planning and execution. The present study provided critical ecological information to policymakers, agricultural and forestry research institutions, NGOs, and development agents for the future sustainable forest management [24].
Altitudinal gradients have also been observed to influence the functional compositions and natural regeneration of woody species in the previous study [25, 26]. Variability in species regeneration status may arise from species dominance, animal disturbance, selective logging, soil moisture, temperature, and topography [26]. While several studies have focused on the composition, structure, and regeneration status of dry evergreen Afromontane forests in Ethiopia [27], specific investigations into the effects of altitudinal gradients on these parameters within the Hafursa forest remain lacking. Therefore, this study emphasized how the effects of altitude influence the woody species’ diversity, structure, and further regeneration potentials of the studied forest.
2. Materials and Methods
2.1. Description of Study Area
The study was conducted in the Arbegona district, Hafursa forest, Ethiopia. Geographically, it is located between 6°42′12″–6°42′42″N and 38°424′5″–38°43′10″E. The district is characterized by hilly and mountainous land with an elevation range from 2000 to 3700 masl with various mountain fragments such as Hafursa, Garamba, Yerke, Idoro, Udume, and Werbadule [28].
The district exhibits a bimodal rainfall pattern and has a minimal rainy season between February and April, and the main rainfall between July and October. The average annual rainfall ranges between 1250 and 1300 mm, and the mean annual average temperature ranges between a minimum of 14°C and a maximum of 18°C [28].
2.2. Sample Size Determination
2.3. Data Collection Methods and Sampling Techniques
A reconnaissance survey was conducted to have a general overview of the study area. Then, the GPS point was taken to know the boundary of the forest and to decide the possible sampling techniques. An area of the forest was delineated using Quantum GIS (QGIS). The systematic random sampling technique was used to collect vegetation data based on altitudinal gradients to distribute 32 sampling plots by the size of 20 × 20 m (400 m2) at every determined distance of 90 m interval between each quadrat [30]. Then, the coordinate point of the quadrats was determined within the range of altitudinal gradients as lower and higher based on the area’s elevation according to its meter above sea level. Then, a geographic coordinate point found between 2612 and 2713.5 masl was taken as a lower altitude, and from 2713.5 to 2813 masl was taken as a higher altitude. To avoid the edge effect, a 20 m distance was used from the border into the quadrat. Data from the forests were collected for the documentation of woody plant species [30]. Five subplots in the main plots were designed for the seedlings and saplings by the size of 1 × 1 m (1 m2) at the four corners and one from the center of the main plot [30]. In all sampling plots, all woody plant species were named, counted, and recorded by the following colored plant identification guides such as Flora of Useful Trees and Shrubs in Ethiopia [31] and referring to the published volumes of Flora of Ethiopia and Eritrea [32].
Data on the number of saplings and seedlings for all woody plants were collected from each subplot. Within each main quadrat, data on the number of saplings and seedlings for all woody species and their regeneration status were assessed and recorded through counting in the field. Therefore, all woody species in these five subplots were counted as “seedlings” when the height of species was less than or equal to 1 m and “saplings” when the height of species was between 1 m and less than 3 m [35, 36].
2.4. Data Analysis Methods
2.4.1. Diversity Data Analysis
2.4.2. Population Structure Data Analysis
To analyze the population structure of the vegetation, height and diameter frequency distribution of all woody species were calculated by measuring the height and DBH for each species in all quadrats. To describe the population structure, individuals of recorded species were grouped into diameter and height classes. Six DBH classes were established: classes (1) 2.5–10 cm, (2) 10.01–20.0 cm, (3) 20.01–40.0 cm, (4) 40.01–60.0 cm, (5) 60.01–80.0 cm, and (6) DBH > 80 cm, and eight height classes: classes (1) 2.0–5.0 m, (2) 5.01–10.0 m, (3) 10.01–15.0 m, (4) 15.01–20.0 m, (5) 20.01–25.0 m, (6) 25.01–30.0 m, (7) 30.01–35.0 m, and (8) > 35 m [38].
This index is used to determine the overall importance of each species in the forest system [37]. This means that it enables comparison of the ecological significance of species in each forest.
2.5. Regeneration Data Status Analysis
The regeneration status of the selected woody species was assessed by examining the abundance of seedlings and saplings in the studied forest [40]. A species is considered to have good regeneration when the number of seedlings surpasses that of saplings, which in turn exceeds the number of adults. Fair regeneration is characterized by a situation where the number of seedlings is equal to or greater than saplings, while the number of saplings is greater than adults. Poor regeneration occurs when the species exists solely in the sapling stage. If a species is found only in the adult stage, it indicates a lack of regeneration. Furthermore, the absence of both seedlings and saplings in a forest suggests that the species may be at risk of local extinction or affected by other destructive factors [41].
3. Results and Discussion
3.1. Woody Species Composition
In the present study, a total of 26 woody species were recorded under 23 genera and 19 families in the forest (Table 1). Asteraceae and Myrsinaceae were the dominant families, each with 3 species, followed by Anacardiaceae and Rosaceae, each with 2 species. The remaining 15 families were represented by a single species. About 53.85% of the woody species found in the forest were trees, and 42.3% were shrubs. However, 3.85% of the species had both characteristics, either trees or shrubs.
| Species name | Family | Habit | |
|---|---|---|---|
| Local name | Scientific name | ||
| Alicho gora (Sid) | Rubus volkensii (Engl.) | Rosaceae | S |
| Amessa (Sid) | Commiphora campestris (Engl.) | Burseraceae | T/S |
| Boncho (Sid) | Pittosporum abyssinicum (Delile) | Pittosporaceae | T |
| Bulancho (Sid) | Buddleja polystachya (Fresen). | Loganiaceae | T |
| Burchancho/Soicho (Sid) | Syzygium guineense (Wild.) De. | Myrtaceae | S |
| Chucho (Sid) | Maytenus arbutifolia (A.Rich, Wilczeck) | Celastraceae | T |
| Dadako (Sid) | Hagenia abyssinica (Bruce) J.F.Gmelin | Rosaceae | T |
| Danshicho (Sid) | Faurea rochetiana (A. Rich.) | Proteaceae | T |
| Ejersa (Sid, Or) | Olea europaea subsp. cuspidata (Wall. Ex G.Don.) Cif. | Oleaceae | T |
| Gagasa (Sid, Or) | Rhus retinorrhoea (Steud. ex Oliv) | Anacardiaceae | S |
| Garambicho (Sid) | Phyllanthus ovalifolius (Forssk) | Euphorbiaceae | S |
| Garbicho (Sid) | Prunus africana (Hook.f., Kalkm) | Rosaceae | T |
| Gomorcho (Sid) | Myrsine melanophloeos (L.) R Br. | Myrsinaceae | T |
| Gowacho (Sid) | Maesa lanceolata (Forssk) | Myrsinaceae | S |
| Hamararcho (Sid) | Ehretia cymosa Thonn. | Boraginaceae | S |
| Haxawicho (Sid) | Brucea antidysenterica (J.F.Miller) | Simaroubaceae | S |
| Hecho (Sid) | Vernonia amygdalina (Del.) | Asteraceae | S |
| Honcho (Sid) | Juniperus procera (Hochst. ex Endl) | Cupressaceae | T |
| Horoncho (Sid) | Ocotea kenyensis B | Myrsinaceae | T |
| Jejako (Sid) | Vernonia leopoldi (Sch. Bip. ex Walp.) Vatke | Asteraceae | S |
| Mikicho (Sid) | Ilex mitis (L.) Radlk. | Aquifoliaceae | T |
| Oloncho (Sid) | Ekebergia capensis (Sparrman) | Meliaceae | T |
| Rejicho (Sid) | Vernonia auriculifera (Hiern) | Asteraceae | S |
| Teberako (Sid) | Bersama abyssinica (Fres.) | Melianthaceae | T |
| Tatessa (Sid, Or) | Rhus glutinosa (A.Rich.subsp. glutinosa) | Anacardiaceae | S |
| Welako (Sid) | Erythrina brucei (Schweinf) | Fabaceae | T |
- Note: T = trees; S = shrubs; Sid = Sidamu Afoo; Or = Afan Oromiffa.
Hafursa forest had the least number of woody species with 26 when compared with some of the other dry evergreen Afromontane forests in Ethiopia, such as Gelawoldie community forest with 59 species [36], Yerer mountain forest with 31 species [42], and Chilimo forest with 42 [22]. The reasons for the low species number might be due to the dominance of a few tree species over the others, because species lack equal chances for competition, and other human or animal disturbances.
3.2. Species Diversity and Evenness
The quantitative investigation of woody species diversity and evenness states the ways of sustainable forest management and conservation [24]. Woody species diversity and richness are the most important elements in forest ecology, which show the health of existing woody species and are positively correlated with forest stability [41].
Several findings also reported that species diversity and evenness varied between higher and lower altitudinal ranges. There is a significant difference between higher and lower altitudes in terms of within-species diversity and evenness at p < 0.05. As shown in Table 2, the Shannon diversity index decreases with increasing altitude, indicating lower species diversity in higher altitudinal ranges. This pattern is likely due to the reduced nutrient availability and limited microclimate variation at higher elevations, which in turn affects species diversity. The species evenness values of higher altitude and lower altitude were 0.82 and 0.77, respectively. Overall woody species diversity of the Hafursa forest (H′ = 2.45) is lower than that of the Chilimo forest (H′ = 2.72) [22] and Zegie Peninsula (H′ = 3.72) [33]. In addition, the current study reflected the relatively lower value of the Shannon evenness index (E = 0.75) as compared with that of Zegie Peninsula (E = 0.84) [33]. This might be due to the dominance of a few woody species and other natural and human or animal disturbances in the study forest. However, the Hafursa forest had a higher diversity index when compared to the Abebaye forest (H′ = 1.31) [43] and the Yerer mountain forest (H′ = 2.38) [42]. In addition, the forest has relatively higher evenness than that of Abebaye natural forests (E = 0.31) [43]. Species richness and diversity tend to decline at the upper elevations [44]. The finding of the present study agrees with the species diversity and richness of the previous work of Alemayehu Wasie (2002), and also some other scholars have reported that species richness decreases with increasing altitude [44].
| Altitude range | Shannon index (H′) | Simpson index | Species richness (S) | Evenness (E) |
|---|---|---|---|---|
| Higher altitude | 2.28 | 0.860 | 16 | 0.82 |
| Lower altitude | 2.41 | 0.868 | 23 | 0.77 |
| Overall range | 2.45 | 0.870 | 26 | 0.75 |
3.3. Species Structural Analysis
3.3.1. Stem Density
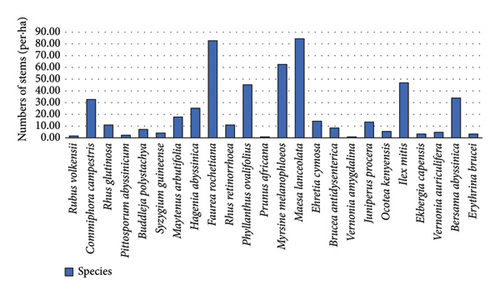
The total density of all woody species collected in the forest was 522 individuals ha−1. Of all the identified woody species in the forest, Maesa lanceolata was found to have the highest number of tree individuals, 16.17% (85 ha−1) followed by Faurea rochetiana at 15.87% (83 ha−1), Myrsine melanophloeos 11.98% (63 ha−1), and Ilex mitis 8.98% (47 ha−1), which is about 53% of the total density represented by these four species. This indicated that few species were densely populated in the forest. On the other hand, Prunus. africana (0.15%), Vernonia amygdalina (0.15%), Rubus volkensii (0.3%), and Pittosporum abyssinicum (0.45%) were the least number of individuals, i.e., a total of 1.05% (Figure 1).
3.3.2. Frequency
Pattern frequency distribution of the species shows an approximate indication of the heterogeneity of a forest. The most frequent species occurring from all sampled quadrats was Faurea rochetiana (71.8%), followed by Ilex mitis (46.8%), Phyllanthus ovalifolius (40.6%), and Bersema abyssinica, about 37.5% (Figure 2). Faurea rochetiana species occurred in 23 quadrats; 69.5% were found in lower altitudes, and the remaining 30.4% occurred in higher altitude quadrats. In contrast, the least frequent species include Erythrina brucei, Vernonia auriculifera, Vernonia amygdalina, Prunus africana, Commiphora campestris, and Syzyguim guineense, with 3.13% (Figure 2).
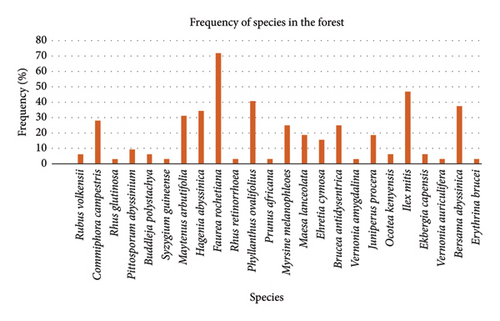
Faurea rochetiana and Ilex mitis were two of the most dominant species in both higher and lower altitudinal ranges within their frequency of sampled quadrats in the forest (Table 3). Juniperus procera and Rhus retinorrhoea were species found only in the higher altitudinal range of the studied forest but not in lower altitudes.
| Species | Lower altitude (RF) (%) | Higher altitude (RF) (%) |
|---|---|---|
| Faurea rochetiana | 20.51 | 10.9 |
| Ilex mitis | 10.26 | 10.9 |
| Hagenia abyssinica | 8.97 | 6.25 |
| Phyllanthus ovalifolius | 6.41 | 12.5 |
| Commiphora campestris | 3.85 | 9.4 |
| Bersama abyssinica | 1.28 | 9.4 |
| Maesa lanceolata | 1.28 | 7.8 |
| Maytenus arbutifolia | 6.41 | 7.8 |
| Juniperus procera | 0 | 9.4 |
| Brucea antidysenterica | 7.69 | 3.12 |
3.3.3. DBH Distribution
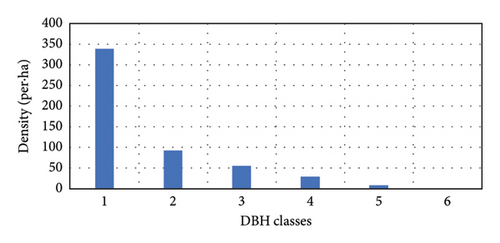
The DBH class distribution of woody species within the Hafursa forest indicated an inverted J-shaped distribution (Figure 3). This is a general pattern of normal population structure where the majority of the woody species had the highest number of individuals in the lower DBH class with a decrease toward the higher DBH class. Of the total individuals in the forest, about 64.8% and 17.7% were found in the first and second classes, respectively. The result showed that large-sized species were selected and logged for several purposes. The DBH class distribution of the Hafursa forest was in line with the DBH class distribution of the Weiramba forest [24]. Photoperiodic and thermoperiodic effects of the altitudinal gradients can affect the DBH of woody species in addition to species dominance, site quality, and climate factors.
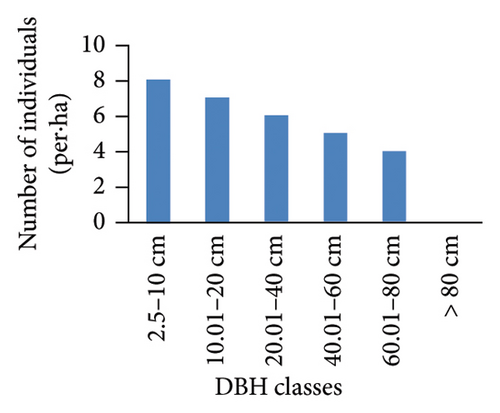
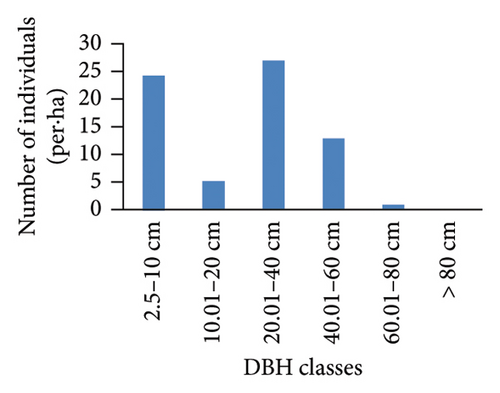
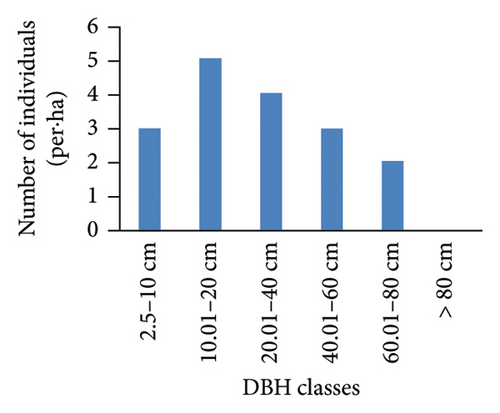
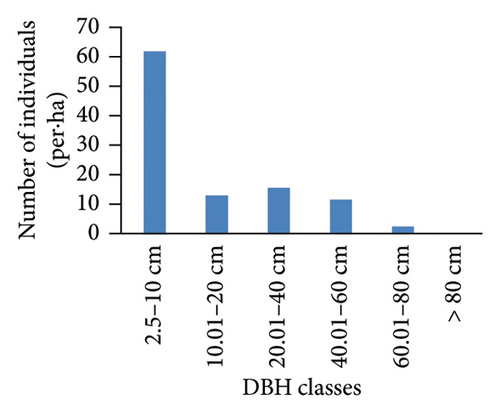
However, the pattern of DBH class distribution with respect to the number of individuals shows different patterns (Figure 4). Ilex mitis and J. procera show a bell-shaped pattern (Figures 4(b) and 4(c)). In the bell-shaped form, the distribution of individuals of a species in the middle diameter classes is high and low in lower and higher diameter classes. Therefore, this bell-shaped pattern indicates a poor reproduction and recruitment of species, which may be associated with intense competition from the surrounding trees. An inverted J-shape distribution of Hagenia abyssinica and Faurea rochetiana species with relatively higher numbers of individuals in the first and second DBH classes, and with gradual decreases toward higher DBH classes (Figures 4(a) and 4(d)), indicated good reproduction and healthy regeneration capability of the species in the forest.
3.3.4. BA and IVI
The total BA calculated for the study area was about 9.43 m2/ha for woody plants ≥ 2.5 cm in DBH. The BA provides the measure of the relative importance of the species in the formation of the horizontal structure of the forest rather than simple stem count [30].
Ilex mitis has the highest BA (2.977 m2/ha) followed by Faurea rochetiana (1.841 m2/ha) and Hagenia abyssinica (1.388 m2/ha). On the other hand, most of the species were recorded with the lowest BA below 0.05 m2/ha, such as Rubus volkensii, Rhus glutinosa, Pittosporum abyssinicum, Buddleja polystachya, Syzygium guineense, Brucea antidysenterica, Ehretia cymosa, Vernonia amygdalina, and Vernonia auriculifera.
The BA of the Hafursa forest (9.43 m2/ha) is lower than most of the other previously studied dry evergreen afromontane forests in Ethiopia, such as Woynwuha natural forest [45], Weiramba forest [24], and Yem district forest [46], with 20.03, 32.10, and 30.16 m2/ha, respectively. In addition, one study by Boz and Maryo [47] reported values of BA that were 47, 54, 49, 53, and 46 m2/ha of woody species in the Bonga, Berhane-Kontir, Harenna, Maji, and Yayu Afromontane forests of Ethiopia, respectively [47], which were also much more than that of the present study forest. The lower value of BA indicated that the Hafursa forest is dominated by smaller-sized shrubs than other dry evergreen Afromontane forests in comparison. This means that variation between the present study and other previously reported forests might be due to the amount of species abundances with their DBH sizes in the forest. However, the BA of the Hafursa forest is higher than that of the Gurumo Woide natural forest [48], which was 5.22 m2/ha.
The IVI involves data from three parameters: relative frequency, RD, and relative dominance (RDO) [37]. IVI is ecologically important and a key structural parameter in vegetation study. It is used to compare the ecological significance of the presence of species [38]. In any ecosystem, species composition may vary in space and time because of variations in physiochemical properties of soils, topography, climate, weathering processes in rocks, and microbial activities [8, 49] and several biotic and abiotic factors [15]. In the highly separated landscapes of disturbed ecosystems, bioclimatic conditions change rapidly and may vary within short distances, resulting in a pronounced heterogeneity of soil types and their chemical and physical properties [50, 51], thus influencing the vegetation structure and composition [52].
Hafursa forest IVI of species ranged from 0.29% to 17.12%. Faurea rochetiana, Ilex mitis, Maesa lanceolata, and Hagenia abyssinica were the four most dominant species among the 26 woody species of the study forest (Table 4). The variation of IVI among sample plots of the study area could be due to the difference in nutrient accessibility across the sample plots of the study area. It shows the level of dominance and abundance of a given plant species, and therefore its ecological significance, relative to the other existing plant species within the forest [37]. In general, the result shows that the species that have lower IVI need special conservation priority in the forest, such as Vernonia amygdalina, Syzygium guineense, and Prunus africana.
| Species | BA (m2/ha) | RD | RF | RDO | IVI | IVI (%) |
|---|---|---|---|---|---|---|
| Vernonia amygdalina | 0.002 | 0.15 | 0.69 | 0.02 | 0.86 | 0.29 |
| Syzygium guineense | 0.007 | 0.75 | 0.69 | 0.08 | 1.52 | 0.51 |
| Rubus volkensii | 0.002 | 0.3 | 1.39 | 0.02 | 1.71 | 0.57 |
| Vernonia auriculifera | 0.015 | 0.9 | 0.69 | 0.16 | 1.75 | 0.58 |
| Prunus africana | 0.168 | 0.15 | 0.69 | 1.79 | 2.63 | 0.88 |
| Pittosporum abyssinicum | 0.025 | 0.45 | 2.08 | 0.27 | 2.8 | 0.93 |
| Erythrina brucei | 0.163 | 0.6 | 0.69 | 1.73 | 3.02 | 1.01 |
| Rhus glutinosa | 0.03 | 2.1 | 0.69 | 0.32 | 3.11 | 1.04 |
| Buddleja polystachya | 0.038 | 1.35 | 1.39 | 0.4 | 3.14 | 1.05 |
| Myrsine africana | 0.087 | 1.05 | 1.39 | 0.93 | 3.36 | 1.12 |
| Ekebergia capensis | 0.157 | 0.6 | 1.39 | 1.67 | 3.66 | 1.22 |
| Rhus retinorrhoea | 0.16 | 2.1 | 0.69 | 1.7 | 4.49 | 1.5 |
| Ehretia cymose | 0.023 | 2.69 | 3.47 | 0.24 | 6.41 | 2.14 |
| Brucea antidysenterica | 0.012 | 1.65 | 5.56 | 0.13 | 7.33 | 2.44 |
| Maytenus arbutifolia | 0.056 | 3.44 | 6.94 | 0.59 | 10.98 | 3.66 |
| Commiphora campestris | 0.088 | 6.29 | 6.25 | 0.94 | 13.48 | 4.49 |
| Bersama abyssinica | 0.109 | 6.44 | 8.33 | 1.16 | 15.93 | 5.31 |
| Juniperus procera | 0.974 | 2.54 | 4.17 | 10.33 | 17.04 | 5.68 |
| Myrsine melanophloeos | 0.167 | 11.98 | 5.56 | 1.77 | 19.31 | 6.44 |
| Phyllanthus ovalifolius | 0.226 | 8.68 | 9.03 | 2.4 | 20.11 | 6.7 |
| Hagenia abyssinica | 1.388 | 4.79 | 7.64 | 14.73 | 27.16 | 9.05 |
| Maesa lanceolata | 0.709 | 16.17 | 4.17 | 7.52 | 27.85 | 9.28 |
| Ilex mitis | 2.977 | 8.98 | 10.42 | 31.58 | 50.98 | 16.99 |
| Faurea rochetiana | 1.841 | 15.87 | 15.97 | 19.53 | 51.37 | 17.12 |
| Total sum | 9.427 | 100 | 100 | 100 | 300 | 100 |
- Note: It was approximate value of total basal area of the forest per ha, 9.43. It is a very significant to measure of the relative importance of the species in the formation of the horizontal structure of the forest rather than simple stem count.
3.4. Regeneration Status
The regeneration status of a woody species is poor if the number of seedlings and saplings is much less than mature individuals [53]. The total number of seedlings, saplings, and matured individuals were 586, 431, and 668, respectively, recorded in the study area. Based on this model, it could be suggested that the Hafursa forest had poor regeneration status of woody plant species (Figure 5). The decreased number of seedlings and saplings of woody species in the forest might be due to the effects of altitudinal gradients, few species dominance, as well as improper forest management strategies, which negatively affect their survival. In addition, the possible reasons for the variation of the regeneration status among the species could be also due to the degree of human-induced disturbance, management options, and climatic conditions within the study area. Therefore, the presence or absence of seedlings and/or saplings determines the regeneration potential of existing woody plant species in the forest. The good regeneration of a woody species depends on the capacity of seedlings and saplings to survive and grow. In general, seedlings and saplings are more vulnerable to anthropogenic disturbances and environmental stress and altitudinal variation, thereby negatively affecting the regeneration potential of woody species [43]. Rubus volkensii and Vernonia leopoldi were two of the most dominant species, with the number of seedlings and saplings in both higher and lower altitudes. In addition, the number of seedlings and saplings of lower altitudes was much higher than that of upper altitudes but less in a number of mature species. This showed that in the higher altitude, there was more disturbance than in the lower altitude due to several factors such as illegal cutting, adverse environmental factors, and altitudinal variations as well.
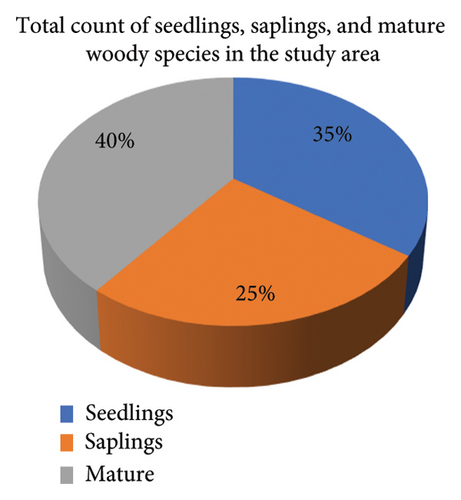
In the forest, Olea europaea and Vernonia leopoldi were the only two species that existed without their mature standings. Mostly, Olea europaea needs prioritized special conservation more than others because this species had a very low number of seedlings and saplings in the forest.
4. Conclusion and Recommendations
The study investigated the effects of altitudinal variation on the diversity, structure, and regeneration status of woody species in the Hafursa forest. The findings revealed a relatively low species diversity, with only 26 woody species identified across 23 genera and 19 families. The study found that higher altitudes exhibited reduced diversity compared to lower elevations, indicating a slight influence of altitude on woody species diversity. Most of the woody species exhibited a low IVI, suggesting they are rare and potentially at risk within the forest ecosystem. In addition, the regeneration status of these woody species was found to be poor. However, Faurea rochetiana and Ilex mitis emerged as the two most dominant woody species in the study area.
Based on the current findings, it is evident that greater conservation efforts are necessary in the higher altitude areas of the studied forest to ensure the conservation, management, and sustainable use of forest resources. In addition, effective management of existing resources should incorporate local community participation to enhance the diversity of woody species within the forest. This is particularly important as many species at higher altitudes are experiencing declines due to various disturbances, including topographic gradients and competition for essential resources such as minerals and sunlight.
In the studied forest, the urgent need for conservation measures is apparent for nearly all species to support healthy regeneration and sustainable use, particularly for those with low IVI ratings. Therefore, community-based forest management is essential for endangered species such as Olea europaea, Vernonia amygdalina, Syzygium guineense, and Prunus africana.
Furthermore, fostering ongoing engagement with local communities and building a sense of ownership and interest in conservation through discussions and consultations with various stakeholders is crucial to mitigate the risks posed by unsustainable practices.
The author has also emphasized the need for further research, particularly on the long-term monitoring of regeneration trends and the impacts of invasive species in the Hafursa forest.
Conflicts of Interest
The author declares no conflicts of interest.
Author Contributions
The author has read, revised, and approved the manuscript.
Funding
The finding was supported by the Hawassa University and MRV Project.
Acknowledgments
I thank Hawassa University for their financial support and also my gratitude for the Arbegona Agricultural and Forest Development Sector, local experts, and communities for sharing their indigenous knowledge and assisting me during inventory data collection.
Open Research
Data Availability Statement
The data used to support the findings of this study are included within the article.


