
Fuelwood From Natural Forests’ Contribution to Households’ Energy Use and Its Effect on Carbon Dioxide Emission in Delanta District, Northeastern Ethiopia
Abstract
Ethiopian rural households primarily rely on fuelwood as their energy source. This research was designed to quantify the amount of annual fuelwood collected from forests. The research uses a simple random sampling method for household selection that was used to invert the study, and the data were analyzed using Excel and Stata software. As a result, among the primary causes of deforestation and CO2 emissions are a strong reliance on fuelwood. The purpose of this study was to calculate the annual quantity of fuelwood harvested from the forests as well as the amount of CO2e and C produced throughout the process. An estimated 2725 kg of firewood and 26 kg of charcoal were used annually per households. In contrast, each household extracted an average of 3909.3 kg of firewood and 516.5 kg of charcoal annually from the forests to sale. The analysis of this study demonstrates that fuelwood from the forest accounted for 71% of the total energy sources that the sampled household had access to for both expenditure and sale. 66% of the overall energy sources came from firewood, and 5% came from charcoal. Consequently, 66% of fuelwood extracted from the forest is utilized for sale and serves as an alternate means of income generation, while 34% of fuelwood is used for household expenditure in the study area. From the total energy sources, fuelwood from the forest shares 51% of energy sources accessible for use in households and 96% of energy providers available for sale (income generation). However, in the examined areas, inefficient combustion of this fuel results in greenhouse gas emissions. Thus, each year, the burning of fuelwood taken from this forest contributes 974 tons of carbon dioxide equivalents (CO2e) to the atmosphere. This suggests that 265.6 tons of carbon is added to the household’s total carbon footprint as a result of using fuelwood from the forest as a domestic energy source. Annually, 7.74 tons and 1.96 tons of CO2e and carbon are emitted per household, respectively. Generally, fuelwood from the forest has a great role in either household energy use or income contribution. But without consideration of emissions, deforestation for fuelwood production has implications for emission. Conserving natural forests by adopting different forms of energy like electrical sources or establishing plantations on our own land is an essential approach to mitigating climate change in the future.
1. Introduction
1.1. Background
One of the essentials needed to keep humans alive is energy. However, rural communities lack sufficient access to reasonably priced and efficient energy resources [1–3]. Fuelwood is the main energy source for food preparation and thermal applications for over 2.5 billion people across the globe [3]. The majority of fuelwood makes up between 60 and 95% of the energy consumed in developing nations, with the remaining 25 to 60% and less than 5% going to middle-class and developed nations, respectively [4]. In developing nations, animal dung and other conventional biofuels, such as agricultural waste, are important sources of energy [4, 5]. Woody biomass is also utilized by about 60% of city dwellers as a cooking energy source [6]. More than 80% of Africa’s energy comes from wood such as firewood and charcoal [7].
A full dependence on fuelwood for households preparing food, providing light, and regulating temperature arises from its considerably lower price and greater convenience compared to most other fuel sources [3, 8, 9]. The world must have access to clean energy, yet developing nations do not have enough access to contemporary energy sources [10, 11].
Household energy consumption patterns typically reflect economic growth stage, status, and welfare [3]. To address the energy requirements of their homes, would rather allocate their scarce financial resources to purchasing fuelwood rather than electricity [12]. According to Arnold, Köhlin, and Persson [1], rural forests are being overused due to the rising demand for fuelwood in periurban and urban regions.
Most countries lack accurate and trustworthy estimates of the quantity of fuelwood harvested from forests, despite the fact that forests provide fuelwood for all household energy consumption [13]. Fuelwood gathering and utilizing from open-access natural forests is a typical action in rural Ethiopian communities, serving as a financial resource for households [14, 15]. Thus, a major contributor to deforestation and CO2 emissions is a strong reliance on fuelwood [16, 17]. In addition to serving as a source of energy, fuelwood from forests offers rural communities job opportunities and alternate means of income generation [18, 19].
In rural Ethiopia, the two main energy sources are biomass and electricity, according to Alemayehu Zeleke and Motuma Tolera [14]. In Ethiopia, firewood provides energy for cooking and baking to over 88% and 91% of homes, respectively. Because of unrestricted access to natural forests and limited availability of modern energy sources, only a small number of households have access to electricity [15].
As stated by Maiguru, Zaku, and Faisal [20], investigation of the energy sources that the residents of northern Taba use is as follows: Wood energy has 170 (64.2%); gas has 25 (9.4%); electricity has 20 (7.5%); and kerosene has 50 (18.9%). Similar observations were noted regarding the role of fuelwood in the livelihoods of residents in Northern Taraba. Respondents within the investigated area earned the mean value of N10,000.00 per month from other income sources, while their average monthly income from fuelwood sales was N15, 000.
Approximately 95% of households in Adaba Dodola, Ethiopia, rely on fuelwood sourced from natural forests, with usage levels estimated at around 30,000 tons, contributing about 2.08 tons of CO₂ equivalents per household annually [14]. Consequently, the global release of greenhouse gases (GHGs) from the making and consumption of wood-based fuel and charcoal is anticipated to reach between 1 and 2.4 gigatons of CO₂ equivalent each year, accounting for roughly 2%–7% of total human-caused emissions [21].
The primary factors behind these emissions include unsustainable forest management practices, low-efficiency charcoal production, and ineffective wood fuel combustion methods.
Households often prefer to use fuelwood over electricity to fulfill their needs, especially when they face financial constraints. Since disadvantaged communities heavily depend on forest resources, they are particularly vulnerable to environmental degradation. Consequently, forest degradation is perceived within the broader context of poverty and the environment as a factor contributing to further impoverishment [17].
Bildirici and Özaksoy [22] indicate that utilizing fuelwood as an energy source results in carbon dioxide emissions and contributes to forest degradation. While the role of fuelwood forests in supporting household economies and livelihoods is significant, it remains largely unrecorded and, thus, overlooked [4].
There is limited information available on CO₂ emissions resulting from fuelwood use, as many countries do not have precise or transparent assessments of the amount of fuelwood extracted from forests. Additionally, the economic value of this fuel to households has not been thoroughly examined [13].
The continuous increase of CO₂e levels in the air could result in significant climate change challenges in the future, with CO₂e emissions from fuelwood consumption being particularly sensitive. Therefore, addressing carbon emissions resulting from biomass burning in rural areas is essential. The primary purpose of the investigation was to examine both the quantity and role of biofuel energy collected from arid Afromontane natural forests, alongside the associated carbon emission impacts in the Delanta district of northeastern Ethiopia.
1.2. Hypothesis
The main hypothesis to be tested is that the relative contribution of open-access forests for households’ total energy use and sale will be greater than nonforest fuels, including private fuels from the farm and other forms of energy available in the household. The study also hypothesizes that the amount of fuelwood from the forest available for sale and serving as an alternate means of income generation is a major contributor to deforestation and CO2 emissions than fuelwood available for household consumption in the study area.
The expression of carbon dioxide (CO2) and carbon dioxide equivalent (CO2e) is frequently used. While each relates to global warming potential, CO2e accounts for additional GHGs beyond just CO2. Consequently, many climate specialists suggest using CO2e, as it provides a more comprehensive measure.
1.3. Specific Objectives
- •
To estimate the annual amount of fuelwood was extracted from forest
- •
To estimate the relative contribution of open-access forest for households’ total energy use and sale
- •
To estimate the amount of C and CO2e contributed by fuelwood extraction and consumption from forests
1.4. Research Question
- •
How much is the annual amount of fuelwood was extracted from forest?
- •
How much is the relative contribution of open-access forest for households’ total energy use and sale?
- •
How much amount of C and CO2e is contributed by fuelwood extraction and consumption from forests?
2. Methodology
2.1. Study Area Description
2.1.1. Study Area Location
Delanta district is placed in the eastern part of the Amhara region, within the South Wollo Zone (refer to Figure 1). It is bordered by Wadla and Angot districts to the north, Dawunt district to the west, Tenta district to the south, and Ambasel district to the east. Its geographical coordinates are 38°40′39″N and 11°20′11″E. The district’s primary town and central commercial hub, Wogeltena, lies about 98 km from Dessie, the central town of South Wollo Zone, and approximately 499 km northeast of Addis Ababa. From an administrative perspective, Delanta was part of the North Wollo Zone until 2000 E.C. and has been part of the South Wollo Zone since 2001 E.C. The district is made up of 30 rustic kebeles and 3 town kebeles, totaling 33 kebeles [23].

2.1.2. Topography
Delanta district spans an area of 106,017 ha, with a landscape comprised of approximately 30% flatlands, 36.5% rough landscape (known locally as gedelama), 30.5% rocky ground, and 3.5% mountainous areas. The district’s northern region is more rugged, while the west features broader plains. Elevations within Delanta range between 1900 and 3800 m above sea level. The area is adjacent to the Bashilo River, which splits it from Tenta district before eventually joining the Abay River [23].
2.1.3. Climate
The Delanta district’s climate includes several agroclimatic zones: the cool, highland “Dega”; the temperate, midaltitude “Woyna Dega”; the warm to hot, semi-arid “Kolla”; and a smaller alpine “Wurch” zone. The zone composition is approximately 26.4% Dega, 41.3% Woyna Dega, 28.5% Kolla, and 3.8% Wurch. Annual rainfall in Delanta ranges from 614.80 to 968.7 mm, averaging around 803 mm. The region experiences dual raining periods, with smaller falls occurring in March and April (spring), and heavier rains from June through September (summer). The district’s average yearly temperature ranges from 5.9°C to 19.11°C, with temperatures ranged from 21.2°C to 28°C for the maximum values between January and June, while the minimum temperatures varied from 1.6°C to 7.1°C between October and December, the coolest months [23].
2.1.4. Soil
As noted by Abate et al. [24] and the Delanta District Communication Affairs [23], the soils in Delanta district are characterized by high total porosity (46.51%–60.55%) and a predominance of heavy clay (35%–80%). They have relatively small bulk densities (1.02–1.35 g·cm³) and mineral soil particle densities (2.41–2.82 g·cm³), while exhibiting a large water-holding ability (129.9–287.9 mm·m⁻1). The soil pH ranges from 6.25 to 8.29, reflecting slightly acidic to moderately alkaline conditions. These soils are generally low in salinity (EC < 0.5 dS·m⁻1) and contain moderate to little ranks of carbon-based material (organic) (0.12%–4.82%) and total nitrogen (0.02%–0.28%). Available phosphorus fluctuates between 0.52 and 18.44 mg·kg⁻1. The cation exchange capacities (CEC) of these soils are high to very high (31.98–65.48 cmolc·kg⁻1), with ample exchangeable bases and significant base saturation (60.22%–98.97%). However, their tendency to become gluey when rainy, strengthen when dry, face waterlogging concerns, and be prone to soil loss due to unsuitable plowing cultures limit their agricultural potential. This emphasizes the need for effective and coordinated soil management strategies throughout the district.
2.1.5. Natural Vegetation
Patterns in the spread of native vegetation are influenced by multiple factors, with landscape features, weather conditions, water flow patterns, and soil characteristics being the greatest significant. In the Delanta district, vegetation cover is sparse due to a deeply rooted history in farming and dense inhabitants. The district’s shrub and tree growth includes degraded forests, woodlands, scrublands, and dispersed trees within farming areas. The remaining forests that have experienced degradation are primarily located in the district’s northern region, now reduced to mall section fewer than 1500 ha. The primary forest tree types found in these forests include Cordia, Acacia, Juniper, Eucalyptus, and Hagenia [23].
Wooded grasslands in the area consist of land with grasses and herbs interspersed with patches of woody plants, while scrublands comprise small shrubs interspersed with grasses and herbaceous plants. Additionally, isolated remnant trees are scattered across the cultivated landscapes throughout the district [23].
2.1.6. Demographic Features
As reported by CSA in 2010, Delanta district has a total population of 149,882, with 72,701 males (50.5%) and 71,181 females (49.5%). The district’s high population growth has resulted in a dense settlement on limited land, leading to recurring food shortages and environmental degradation. High population density in the area contributes to forest loss, agricultural land degradation, habitat destruction, and reduced biodiversity. Problems like land degradation and soil erosion are also prevalent.
2.1.7. Energy Sources
Conventional biomass sources like firewood, charcoal, and animal dung remain the primary energy source for rural and periurban households in the district. Modern energy sources, like electricity, remain largely inaccessible and unaffordable. Out of 33 kebeles in the district, only 4 rural and 3 urban kebeles have access to electricity, leading the community to rely heavily on fuelwood and animal dung for household energy needs. This situation underscores the importance of tapping into alternative energy sources to provide an adequate energy supply for society (Delanta District Communication Affairs Office).
Connecting all kebeles to the national electricity grid, largely powered by hydropower, has proven challenging due to the country’s rugged terrain, which significantly raises distribution costs to remote areas. As a result, firewood extraction and charcoal production from montane forests have substantial economic impacts.
2.2. Method for Selecting Participants
2.2.1. Sampling
The Delanta district was chosen for the study because it is recognized as a region with forest resources within the zone that is experiencing notable forest and land degradation. The sampling procedure followed for this study was multistage sampling. Accordingly, first out of 32 total kebeles in the Delanta district, three kebeles were randomly selected, namely, Mesnoamba (01), Goshmeda (019), and Mistinkir kebeles (018).
- •
n = required sample size
- •
p = 0.1 (or 10%), representing the population reliability for estimating frequency for a sample size of nnn
- •
q = 1 − ppp = 0.9
- •
N = 1452, the total number of households in the targeted kebeles
- •
Z = the standard score for a 95% confidence level, which equals 1.96
- •
e = the margin of error, or the acceptable level of accuracy, which is 0.05 in this case.
| Target kebele | Household number | Required number of samples | Sample percentage (%) |
|---|---|---|---|
| 01 | 461 | 38 | 30 |
| 018 | 552 | 48 | 38 |
| 019 | 439 | 40 | 32 |
| Total | 1452 | 126 | 100 |
- Note: Source: own survey 2021.
The required sample of each kebele could be obtained proportion by using the next method and described in Table 1.
nh = (N∗/Nh)(n), in which nh is size of sample each rural kebele, N∗ = total population of each kebele to be taken whereas Nh is size of total population [25].
nh1 (from the 019 kebele) = (438/1452)(126) = 38, nh2 (from the 01 kebele) = (461/1452)(126) = 40, and nh3 (from the 018 kebele) = (553/1452)(126) = 48.
2.2.2. Key Informant (KI) Selection
This research identifies KIs as the primary source of information. These individuals, experts in fuelwood collection, are knowledgeable about its economic importance for household livelihoods in the study area. The participants were chosen using the snowball sampling technique [26].
During the village survey, the first farmer was randomly prompted to list various KIs. Among the listed candidate KIs, the only one was selected at each village to make KIs for the entire investigation. A whole of 12 KIs as a whole were selected. In this technique, each person gives multiple referrals; however, only one person is recruited randomly from each referral.
2.3. Sources of Data
To fulfill the study’s aims, the researcher engaged in both primary and secondary data sources. Primary data were gathered from questionnaires, interviews, focus group discussions, and direct measurements. Secondary data were sourced from various materials, including digital books and publication government documents from Delanta District Communication authorities.
2.3.1. Household Survey
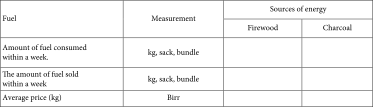
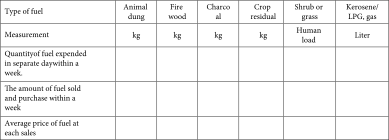
A structured questionnaire was designed to obtain data on available fuel sources. Questionnaires containing both close-ended (single response) and open-ended (multiple responses) were prepared (Appendix 3). Before administering questionnaires, orientations were given for the household head that are randomly selected. The questionnaires were initially created in English and then translated into Amharic language for the respondents. In light of the study purpose, a survey containing two sections, namely, household characteristics and sources of domestic energy use and sale.
The household characteristic section of the questionnaire helped to collect evidence on the energy section was used to find information on the sources of each of the major fuels used, the distance traveled to gather commercial and noncommercial fuels, and the person responsible for obtaining each fuels. For traditional fuels, the reference period was 1 week to minimize recall errors. The reason for the reliance on fuel sources currently in use and the amount to the fuel consumed by them was investigated.
2.3.2. Key Respondent Interviews
Interviews were carried out with selected individuals, including personnel from developmental agencies (DAs), women, and heads of households who primarily collect fuelwood from open-access forests (Appendix 4). The aim was to gain insights into their thoughts, feelings, perspectives, and viewpoints. The research involved structured interviews designed to collect data from the respondents (Appendix 4).
2.3.3. Focus Group Discussions
Discussions in focus groups were organized engaging with members of the community in respective kebele. The goal of the FGDs was to gather full information regarding household energy usage from various community groups. Key participants included representatives from the rural DA, local organizational bodies, and families that regularly harvest charcoal and firewood. These discussions aimed to obtain comprehensive data on fuelwood consumption and other energy practices. Each focus group comprised four households from the respective kebeles, and discussions were guided using a prepared checklist (Appendix 5).
2.4. Methods of Data Analysis
2.4.1. Household Survey Data Analysis
The study’s data were analyzed using a combination of qualitative and quantitative systems. Information gathered via survey questionnaires and direct measurements was organized and investigated employing descriptive statistics, including frequencies, proportions, means, and standard deviations, to assess various socioeconomic conditions. Data found from direct observations and focus group discussions were analyzed and presented narratively by categorizing and synthesizing different viewpoints and ideas. Quantitative data were examined using MS Excel [27] and STATA version 14.2.
2.4.2. Measurement of Fuel Consumption and Sales
Fuelwood consumption was measured during February, March, and April of 2021. An essential aspect of measuring fuelwood is weighing solid fuels, which facilitates accurate consumption estimations [28, 29]. Weight measurements provide a more practical means of determining solid volumes, as it is quicker and easier to weigh bundles of wood, animal dung, and crop residues using a spring balance than to estimate the volume of irregularly shaped headloads of fuelwood [30, 31].
An overall number of 126 random selections of households were made from three kebeles for the household surveys, representing approximately 10.05% of all households in the surveyed kebeles. The quantity of fuel utilized and sold over a 24-h timeframe was recorded for one week using a weight survey method with a spring balance, following training in measurement techniques for collectors or survey teams [32–34].
Fuel types identified by respondents as being used daily such as wood products, crop waste, animal waste, charcoal, and kerosene were physically and distinctly measured and documented. The bundles were weighed and sent to each participating home with instructions to use only the measured resources, depending on the projected daily fuelwood requirement for each household as indicated by the responses given by the participants. as well as bags from designated fuel sources (own, forest, and market) (Appendix 2). On the next day, fuelwood consumption values were derived by subtracting the weight of remaining fuelwood from the initial weight of the bundles or sacks provided [13, 35].
To calculate the average daily fuelwood consumption per household over 1 week, respondents were asked to display an amount of fuelwood equivalent to what they had used the previous day for market sale the following morning. The designated bundles were measured using a spring scale and recorded on the datasheet. Similarly, other fuels, including animal dung for consumption and sale, were weighed and documented based on respondents’ indications during interviews. For households using kerosene, it was measured in liters. Overall, the annual fuelwood consumption was estimated by multiplying the weekly fuelwood weight by the number of weeks in a year (52) [36].
2.4.3. Estimation of CO2 Emissions
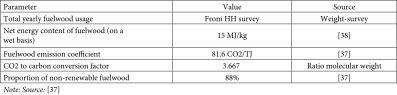
The annual carbon emissions for the study area were estimated based on the guidelines set by the UNFCCC [37] (Appendix 1). This calculation utilized default net calorific values, emission factors, and carbon storage data from forests (Table 2). The selection of climate parameters for evaluation was essential for comparing and quantifying the climatic impacts of various emissions.
| Parameter | Value | Source |
|---|---|---|
| Total yearly fuelwood usage | From household | Weight survey in HH |
| Net energy content of fuelwood (on a wet basis) | 15 MJ/kg | [38] |
| Fuelwood emission coefficient | 81.6 CO2/TJ | [37] |
| CO2 to carbon conversion factor | 3.667 | Ratio molecular weight |
| Proportion of nonrenewable fuelwood | 88% | [37] |
- Note: Source: [37].
3. Results and Discussion
3.1. Demographic and Socioeconomic Profile of the Sampled Households
3.1.1. Characteristics of the Households
Approximately 23.81% of the 126 heads of households in the sample were women. The respondents’ ages varied between 22 and 85 years, with the average age being 47 years. Of the household members, 5.56%, 66.67%, 12.7%, and 15.08% were single, married, widowed, and divorced, respectively. Households had a minimum of two family members, a maximum of eight, and an average of four. The proportion of respondents who were illiterate was 59.52%, surpassing the 18.25% who could read and write. Conversely, 17.46% and 4.76% of the households had received at least some formal education. The percentage of respondents receiving awareness services was relatively low at 36.57%, while 26.19% were more informed; the remainder, 17.46% and 19.84%, were either somewhat aware or completely unaware.
3.1.2. Members of the Family Involved in Collecting Fuelwood
Responses indicate that both genders share the responsibility of collecting fuelwood. Specifically, 35% of participants reported that mothers and daughters are the primary individuals who consistently gather firewood from the forests. Conversely, 32% of respondents noted that fathers and sons also play a significant role in producing and transporting charcoal and firewood to earn cash income. Additionally, 33% of participants stated that both males and females, irrespective of their income levels, contribute to generating income by collecting and selling fuelwood while also meeting the household’s energy requirements. This research corroborates the findings of Sintayehu and Yemiru [39], which suggest that women predominantly handle the collection of firewood. Consequently, women face challenges in traveling long distances to gather wood, as this task demands considerable time and energy, diverting them from their extensive household duties. The key distinction is that women and girls tend to make informed decisions about energy usage and are often involved in kitchen work.
3.2. Major Energy Sources and Status of Energy Consumption by Households
Livestock dung and fuelwood are the core biomass energy types in homes of the district. The local households obtain their energy across forested and nonforested ranges. The majority of respondents (99%) concur that forests remain their primary supply of fuelwood, and they continue to harvest fuelwood from them to varied degrees, in line with research by Gurmessa [40], Aguilar et al. [41], and Mekonnen and Kohlin [42], which states that forests are the main sources of fuel wood in rural areas of Ethiopia. This demonstrates the existence of fuelwood collection-related forest degradation in the area. Previous studies [15, 35, 43, 44] provided an explanation for this conclusion. These also clarify why only a limited quantity of fuelwood was taken from nonforest areas, despite the fact that woodlots and farm trees both contribute fuelwood. In the study area, merely 11% of households sourced firewood from nonforest locations, while over 70% obtained it from forests. The result of this study is the opposite of the previous study, which suggests that firewood harvested nearby was used as a backup energy source [36].
According to Table 3, from all households that utilize forest resources, 50% only use fire wood as a fuel for energy generation. This followed by 47.62% of homes that use both firewood and charcoal. This is comparable to a research by Kyaw, Ota, and Mizoue [36], which reports that 20% of sample homes used firewood in addition to other sources of energy for cooking, while about 65% of sample households (92 households) used just firewood.
| Source of fuels | Energy source | Observation | Participated household no. | Percent (%) |
|---|---|---|---|---|
| Forests | Firewood only | 126 | 64 | 50.8 |
| Both firewood and charcoal | 126 | 60 | 47.62 | |
| Charcoal only | 126 | 1 | 0.8 | |
| None of all fuels | 126 | 1 | 0.8 | |
| Nonforests | Firewood only | 126 | 1 | 0.8 |
| Charcoal only | 126 | 1 | 0.8 | |
| Animal dung only | 126 | 54 | 42.85 | |
| Firewood and charcoal | 126 | 2 | 1.6 | |
| Firewood and animal dung | 126 | 48 | 38.10 | |
| Charcoal and dung | 126 | 3 | 2.4 | |
| All of fuels | 126 | 10 | 8 | |
| None of all fuels | 126 | 7 | 5.55 | |
- Note: Source: own survey, 2021.
42.85% of households from nonforest utilized solely animal dung sources, whereas 38.1% of households used both animal dung and firewood. Through the addition of fuelwood from both forested and nonforested areas, the remaining tiny percentage of households (8%) utilizes all forms of energy sources. Just 5.5% of households have never relied on energy sources other than forests. However, among the households studied, fuel from forests and dung from nonforests continue to be the predominant sources of energy (Table 3).
3.2.1. Energy Sources Extracted From Forest
The survey found that the most common energy source for households is fuelwood (charcoal and firewood), which is gathered from open-access forests in their natural state. For use and sale, each household removed an average of 2725 kg and 3909 kg, of firewood annually from the forest, respectively. This indicates the firewood collected for sale or income generation is greater than firewood collected for household use. This contrasts markedly with the findings of Kyaw, Ota, and Mizoue [36], which reported average yearly fuelwood consumption per individual of 298 kg for households relying solely on firewood and 530 kg for those using both fuelwood and other energy bases. The presence of electricity in the studied village in Myanmar explains the differences observed in these studies.
In other way of explanation, a total of 343,356 kg and 492,567 kg of firewood were taken out of the forest each year by the tested households for household use and for sale, respectively. Figure 2 illustrates that 38% and 55% of the entire quantity of firewood needed for residential use and commercial sales, respectively, is covered by natural forests. Also, Figure 2 displays that from the total fuelwood extracted from the forest, 3260 kg (0.5%) and 65,078 kg (7%) of charcoal produced annually, for the tested household consumption and income generation, respectively. As a result, the average yearly amount of charcoal generated from the forest per household was 26 kg for consumption and 516.5 kg for income generation.

Natural forests are also very beneficial to user groups because they may supply fuelwood for special events like weddings, funerals, and other social and cultural rites [41, 44]. The average yearly amount of fuelwood harvested from the forest per household was 7176.7 kg or 7.1767 tons, while the total annual amount extracted from the forest was 904,262 kg or 904.262 tons. Because electric power was accessible in Nepal, this result exceeded the average yearly amount of fuelwood harvested from the community forest in Dolakha, Nepal [44], which is 700 kg.
From the above expression, we can decide that 66% of fuelwood extracted from the forest is used for sale and serves as an alternate means of income generation, while 34% of fuelwood is used for household consumption in the study area. The findings of this study bring into line with those reported by Sintayehu and Yemiru [39], who found that, according to the forest’s fuelwood’s market value, people depended on it more than 0.86 times more for the production of cash than for their subsistence needs.
As a result, over half of the fuelwood that is harvested from forests for use in generating financial income comes from the production of firewood (Figure 2). However, even though charcoal makes up a minor part of all extraction, it is mostly employed to generate cash gain rather than for household consumption. So the alternative hypothesis is accepted as the amount of fuelwood from the forest available for sale and serving as an alternate means of income generation is a major contributor to deforestation than fuelwood available for household consumption in the study area. This is supported by another study conducted in a similar study area, which found that the forest produced 1,310,524.8 ETB of fuelwood annually and 703,014 ETB of fuelwood annually for both financial and subsistence use [39].
Therefore, people’s primary source of income was fuelwood from the forest, and they also made money by selling firewood and charcoal. This reveals that the primary motivator behind the removal of fuelwood from forests is income. This aligns with the results of Mhache [4] and Taylor, Akther, and Miah [45], which highlight the significant importance of fuelwood as a supplementary income source.
3.2.2. Energy Sources Other Than Forest
Households in the Delanta district also generate energy from private trees and animal excrement that is available for consumption and the generation of financial income (Figure 3). According to Chen Heerink and van den Berg [2], these energy sources are referred to as nonforest fuels. In this instance, the respondent can meet their fuelwood demands for domestic use and market sales because they have a private garden, woodlot, animal dung, and cropland with dispersed trees. Nevertheless, most of the households involved in the study do not engage in tree chopping, particularly for fuelwood consumption; instead, they only use the leftover wood from items like building materials and lumber. Additionally, they gather the results of thinning, lopping, and pollarding.

The total yearly firewood production from private trees or plantations in the tested households was 47,086 kg for household consumption and 7618 kg for generating monetary income, respectively. An owned tree yielded an average of 373.7 kg of firewood per year, of which 60.5 kg was sold and used by each home. Another fuelwood made from one’s own trees is charcoal. The average yearly production of charcoal from a household’s own tree was 7.6 kg for consumption and 61.5 kg for sale. This indicates that 962 kg and 7748 kg of charcoal, respectively, were produced annually from private trees in the tested houses for consumption and income creation. This suggests that encouraging individual farmers to plant trees has yielded some astounding results [46]. Additionally, the average annual amount of animal dung per household was 2303 kg for household consumption and 68 kg for income creation. KIs, development organizations, and kebele leaders all contend that families generate fuel from nonforest or private trees as well as animal excrement when forests are too far away from homes to gather fuelwood. This research reinforces the findings of Duguma et al. [47], indicating that rural Ethiopian farmers are compelled to rely on exploring cow dung as a suitable energy source due to a lack of fuelwood.
As shown below in Figure 3, dung makes up 80% of the energy from internal sources, with firewood coming in as a distant second (13%). This is in line with a study by Sintayehu and Yemiru [39] on animal dung, which covers a significant amount of subsistence income (290,149.60) when compared to income from energy sources that are found in nonforests. Consequently, individuals residing farther from the forest tended to use firewood combined with animal dung more often than those living in or near the forest to fulfill their energy requirements.
Consequently, private tree planting seems to be the most reliable way to address the issue of rural fuel [48].
3.2.3. Relative Contribution of Forest Fuelwood for Household Fuel Consumption
As we have already covered, the respondents’ main energy sources used for food preparation and warming the home are animal dung from nonforest sources and firewood from forests. Firewood from the forest remains the mandatory source of energy for consumption in the study areas among the other energy sources used by families [49, 50], and our study was comparable. The sampled kebele does not use electricity or other contemporary energy sources as a source of energy. The study’s weight survey also showed that, for annual consumption, the proportions of animal dung from nonforest areas and firewood from forests were 42% (290,149.6 kg) and 50% (343,356 kg), respectively. This is in line with research by Sintayehu & Yemiru [39], which examines how, in the situation of subsistence income, firewood from the forest has the highest value of energy sources, bringing in a total of 686,712 Birr annually.
The household also had access to energy resources for food preparation and warmth, including charcoal from the forest and firewood from nonforest areas, with corresponding contributions of 1% (3260 kg) and 7% (47,086 kg). Households prioritize using their trees for constructing and generating monetary income from wood lots, home gardens, and lands rather than using them for fuelwood consumption, according to data from KI interviews [51].
Each household uses 2750 kg (2.75 tons) of fuelwood from the forest annually on average, and the total amount of fuelwood utilized for consumption by the studied households is 346,616.4 kg. Thus, this study is supported by the finding that fuelwood from forests provides 23.80% of the income needed for subsistence, which was also examined in a study region that is similar to that reported in Sintayehu and Yemiru’s [39] study.
On the other hand, the average yearly amount of fuelwood from nonforest sources used for consumption is 381 kg, whereas the total annual amount used for consumption was 48,048 kg. As a result, the amount of fuelwood consumed in the Delanta district is equivalent to the 2.3 tons in Adaba Dodola, according to research done in 2019 by Alemayehu Zeleke and Motuma Tolera. However, this figure pales in comparison with the 6.5 tons of fuelwood consumed per home in Arsi Negele, as reported by Nejib [52]. Furthermore, 290,150 kg of animal excrement was consumed annually. This indicates that, after fuelwood, animal dung is the second-largest source of energy that may be consumed.
Mekonnen and Köhlin [42] also discovered that more impoverished rural households than any other group cook with animal excrement. In rural Ethiopia, firewood and charcoal are also comparatively better fuels for cooking. Due to the predominance of grass crops in the research area, including beans, barley (Hordeum vulgare L.), lentils, teff (Eragrostis tef Zucc.), peas, and wheat (Triticum aestivum L.), which are primarily utilized as livestock feed rather than for energy production, crop residues are not utilized as an energy source in this region.
The remaining agricultural residues, primarily from sorghum and maize, are utilized as thatch for the traditional homes the community builds and as animal fodder. This investigation supports the investigation of Duguma et al. [47]. Approximately 98.4% and 90.5% of families selected animal dung from nonforest sources and firewood from forests, respectively, as their primary fuel source. However, when comparing the measured weight of the energy sources, forest fuelwood constitutes 51% of the total amount of biomass fuels consumed, with firewood accounting for 50% and charcoal for 1% (Figure 4).

So, the study proves that the hypothesis to be tested is that the relative contribution of open-access forests to households’ total energy use is greater than nonforest fuels including private fuels, from the farm and other forms of energy available in the household. The alternative hypothesis is accepted. In overall, we draw the conclusion that Ethiopian households now consume a disproportionate amount of biomass as their major energy source. This is supported by the review of Viegand [53]; 90% of household biomass is used for cooking, with 50%–75% of that amount going toward using Mitad-style stoves to prepare Injera. Merely 5%–10% of the biomass’s calorific content is converted into usable heat during the cooking process on a biomass stove, which makes it incredibly inefficient. This indicates that there are important drawbacks, especially in the context of fuel-efficient technology regarding the direct release of GHGs.
3.2.4. Relative Contribution of Forest Fuels for Sale
Selling fuelwood is a year-round regular activity in Wogeltena town. The village gets its fuelwood from the nearby open-access natural forest. Based on our findings, the majority of households in the studied region persisted in depending on forest biomass, specifically fuelwood, as their main source of income. However, some households also made money by selling other energy sources (biomass fuels).
Similar to the study of [4], this study found that fuelwood from the forest accounted for approximately 96% (557,645.4 kg) of the biomass fuels available for the generation of cash revenue. Just 4% (23,894 kg) of biomass energy can be used to generate monetary revenue from areas that are not forests (Figure 5). This is consistent with the result of Mhache [4], which investigates Tanzanians were primarily motivated to produce fuelwood from the forest by the desire to make money.
Selling fuelwood in Wogeltena town is a frequent activity year-round. The development workers and leaders of the kebele came to the conclusion that the impoverished people’s sources of income are quite limited and that even when they do engage in these activities, their earnings are still relatively modest. These factors lead households to become more dependent on the cash income generated from trading in fuelwood harvested from the woodland.
The poll also showed that gathering fuelwood to meet home energy demands took a lot of time for those with low incomes. Individuals with low incomes would constantly gather fuelwood, using all of their electricity for heating. In the area under investigation, fuelwood from the forest is employed as sources of work opportunities and income generating. This research is underpinned by the findings of Sintayehu and Yemiru [39], who reported that the yearly cash income derived from firewood and charcoal for the sampled household’s amounts to 985,135 Birr and 325,390 Birr, respectively. In the Delanta district, fuel wood from the forest accounts for 40.65% of the households’ aggregate monetary income [39].
Because the respondents only had large trees on the edge of their crops, the amount of charcoal created from their own trees was relatively little when compared to the amount of firewood produced from those same trees. Nearly all of the charcoal produced by private trees might be sold to generate income. The primary respondent and the DA disclosed that most illicit charcoal producers use the forest as their private trees for charcoal production, thanks to their rights to charcoal from their own trees.
3.3. Amount of Available Energy Sources for Cash and Subsistence Use
Figure 6 illustrates the total annual quantity of available energy sources. It is essential to understand the role of each energy source, both in terms of revenue and consumption, to accurately determine the amount contributed by each type. Based on this method of evaluation, the highest annual amount of biomass energy sources from the forest is firewood, with 492,567.4 kg for sale and 343,356 kg for consumption. An increasing number of individuals are engaging in firewood harvesting and charcoal production for sale as a means of generating income. Similarly, Mhache [54] states that this condition increases the request for fuelwood from the forest, which leads to deforestation. However, out of all nonforest sources, animal dung that is used for household use has the highest annual amount (290,150 kg), followed by sold firewood (47,086 kg). The total annual yield of charcoal from the forest, estimated at 65,078 kg, represents the highest value among forest energy resources, following firewood. This indicates that the main purpose of charcoal production is to generate cash income, aligning with the findings of Sintayehu and Yemiru [39] and Atyi [55], which state that charcoal is primarily produced for financial gain. The reason for charcoal used for cash income generation rather than subsistence use is because it is smokeless, convenient to store, and has a higher calorific value (30 MJ/kg) than firewood (15 MJ/kg), it is more common in metropolitan settings [56].

As a whole, we can conclude that a large amount of energy sources that have been collected for consumption or sale would have a large amount of subsistence and cash incomes based on their perspective price and availability. Additionally, according to Sintayehu and Yemiru [39], the forest produced 1,310,524.8 ETB for expenditure compensation and 703,014 ETB for monetary usage each year from fuelwood.
Animal manure (290,149.6 Birr), firewood from sources other than forests (141,258 Birr), and charcoal made from forests (16,302 Birr) come next. As a result, the forest’s fuelwood provides the majority of revenue for both financial and subsistence needs.

As a result, the forest’s firewood provides the most income, both for financial and subsistence needs. Therefore, forest fuels are comparatively comfortable for sale due to their quality and efficiency, in which the price of energy sources per unit is quality specific.
Findings from this study show that fuelwood sourced from the forest represented 71% of the total energy resources available to the sampled households for both consumption and sale. 66% of the overall energy sources came from firewood, and 5% came from charcoal. This aligns with the assertion that the collection and extraction of wood from forests for energy purposes constitutes over fifty percent of the total wood harvested [1].
3.4. Estimation of CO2 and Carbon Emission
In most nations, the use of fuelwood contributes significantly to environmental degradation [4]. The use and manufacturing of fuelwood degrades the environment. Societies gathering a range of forest yields such as firewood, charcoal, fodder, timber, medicinal plants, honey, fruits, and more adversely affect the forest ecosystem [57].
The inefficient burning of fuelwood using traditional stoves results in significant indoor air pollution. Traditional stoves such as three-stone fires with unlimited firewood combustion and a thermal efficiency of less than 15% are still used by the whole sampled households. In this case, we have considered the soled fuelwood for cash income generation, which is consumed by urban people [58]. For instance, Maagøe [53] shows that land use change and GHG emissions increased due to 50% of natural resources are exploited, placing significant pressure on them. Consequently, the time that people (mostly women and children) may spend on schooling or other income-generating activities is lost due to the labor-intensive home biomass collection process.
The annual carbon emissions calculated in this study were based on standard net calorific values, emission factors, and carbon sequestration in forests. The methodology used to estimate CO2 emissions follows the procedures established by the United Nations Framework Convention on Climate Change and the Clean Development Mechanism [29, 37]. It is important to analyze the carbon dioxide equivalent (CO2e) emitted from the combustion of solid cooking fuels, particularly within the household sector. Numerous studies have attributed deforestation and forest degradation to the harvesting of firewood and charcoal production [54]. Although these activities have negative consequences, evidence suggests that the association between deforestation and the demand for fuelwood may have been exaggerated [51, 59].
To assess the role of fuelwood in carbon dioxide emissions, we estimated the annual fuelwood consumption in the sampled households, along with the annual sales of fuelwood, assuming that all sold fuelwood was utilized by the buyers. As detailed in Table 4, the total annual fuelwood usage consists of the combined amounts of firewood and charcoal for both household consumption and sales. Consequently, the overall annual extraction of fuelwood from open-access forests was 904,262 kg, equivalent to 904.262 tons. This figure is significantly lower than Flammini et al. [60], which estimated that 741,652 ktons of CO2 emissions was generated worldwide in 2019 due to households relying on an unsustainable amount of fuelwood.
| Variables | Annual consumed firewood | Annual sold firewood | Annual consumed charcoal | Annual sold charcoal | Annual fuelwood |
|---|---|---|---|---|---|
| Amount (tons) | 343.356 | 492.5674 | 3.2604 | 65.078 | 904.262 |
| CO2e (tons) | 369.836 | 530.5542 | 3.51184 | 70.0968 | 973.998685 |
| C (tons) | 100.855 | 144.68345 | 0.958 | 19.1156 | 265.61186 |
- Note: Source: own survey 2021.
From Table 4, the expression below the annual amount of CO2e in tons is 373.35 and 600.654 for consumption and sale, respectively, whereas the annual amount of C in tons is 101.813 and 163.8 for consumption and sale, respectively.
FC represents the amount of fuelwood used in tons or kilograms which equals to 904,262 kg or 904.262 tons for forests (Table 4).
fNRB represents the proportion of nonrenewable woody material biomass, which equals to 88% or 0.88.
NCV is the net calorific value of fuelwood, which equals to 15 MJ/kg or 0.015 TJ/ton.
EFprojected−fossil fuel, default emission factors, equals to 81.6 CO2/TJ.
- •
The required calculation is E, which is emission in tons of carbon dioxide equivalent (tons of CO2e).
For fuelwood from the forest, the total carbon dioxide equivalent from the sampled households = 904.262 tons ∗ 0.88 ∗ 0.015 TJ/Ton ∗ 81.6 CO2/TJ = 974 tons of CO2e.
In the sampled households, the annual amount of CO2e contributed by consumption of fuelwood extracted from open-access state forest was 974 tons of CO2e. This study promotes the report of FAO [61], which states approximately 18% of worldwide carbon emissions are associated with deforestation and changes in land use. In the West Bank, households generated 4.7 million tons of CO2 per year [58]. Also, the study of Zeleke and Tolera [14] revealed that fuelwood consumption from the forest contributes 32,313 tons of CO2e annually, which is the highest compared with our study.
In another study, households’ energy usage in the West Bank accounts for approximately 0.016% of global CO2 emissions, whereas the combined energy consumption across all sectors represents about 0.041% [58].
The estimate from the use of fuelwood was that the annual CO2 emission was 32,313 tons, which is relatively equivalent to about 92 ha of forest being cleared or lost. This result shows that fuelwood is the leading energy source in terms of pollution through CO2 emissions.
- •
C = CO2e/3.667 = 974/3.667 = 265.6 tons of carbon from the forest fuelwood.
In Table 5, the total and annual average amount of CO2e and carbon emission in tons is presented.
| Variable | Obs | Mean | Std. dev. | Min | Max |
|---|---|---|---|---|---|
| CO2e of forest fuelwood | 126 | 7.730147 | 5.366054 | 0 | 24.64451 |
| Carbon of forest fuelwood | 126 | 2.10803 | 1.463336 | 0 | 6.720618 |
- Note: Source: own survey 2021.
According to Table 5, the average annual amount of CO2e emitted through fuelwood consumption from forests was 7.73 tons of CO2e. The forest contributes high amount of CO2 than the average carbon dioxide emission estimated by Zeleke and Tolera [14], that is, 1.3 CO2e emissions. In terms of carbon emissions, it is already estimated that fuelwood combustion extracted from the forest in the sampled households was 265.6 tons. An average annual amount of carbon emitted from the forest per household is 2.1 tons. Another study estimates that approximately 8733 tons of carbon was calculated based on the arid Afromontane forest in the Adaba region has a carbon density of 95 tons Ha−1 [14]. The efficiency of fuelwood combustion is low due to incomplete burning, leading to an increased demand for fuelwood and consequently a greater amount being harvested from forests. Additionally, plantations in rural regions lack sustainability and therefore do not significantly contribute to net carbon sequestration [13, 19].
4. Conclusion and Recommendation
In this study, we conclude that fuelwood is the largest and most important products of open access natural forest used in household energy sources for cash and subsistence use. The average annual amount of fuelwood extracted from the forest was 7.18 tons. Fuelwood from the forest shares 51% of the total consumed biomass fuels and 96% of biomass fuels available for cash income generation. The annual CO2e and carbon emission released from fuelwood consumption from the forest in sampled household were 974 tons of CO2e and 265.6 tons of C, respectively.
The growing trend of forest degradation driven by household fuel consumption is expected to enhance anticipated future emissions of GHGs, contributing to changes in the worldwide environment. A significant limitation in this investigation is the inability to quantify the CO2 and carbon emissions from all dead and burned charcoal, as the roots that are cut and burned are often hidden beneath moss or soil. This study seeks to explore the current contribution of fuelwood to home’s energy sources and its impact on CO2 and carbon emissions, which has led to environmental degradation.
It offers insights into the estimated volume of fuelwood harvested from forests for consumption and its implications for household income and usage. Policymakers and sustainable forest managers can use this information to inform strategies in order to counteract and accommodate climate change. The study emphasizes the necessity of estimating CO2 emissions across different sectors to enable the implementation of measures that can minimize emissions without hindering economic growth.
So, in the Delanta district, the government will made accessible renewable energy options like hydroelectric power, wind, and greatest potential solar energy. Up to that, fuel-efficient stoves known in other parts of the country would be adopted within the area of investigation. Another suggested approach for the area of investigation is for the government to implement multisectoral strategies. These strategies are essential for achieving the dual goals of safeguarding forest carbon and fulfilling local needs.
The proposed strategies encompass enhancing agricultural output on land that has already been cleared, adopting agroforestry practices, and developing alternative energy sources while also promoting biodiversity conservation efforts. Furthermore, it is crucial to establish preserved areas, incorporate adequate regulatory oversight and supervision within existing monitoring frameworks, and blend protection with community-driven management.
Selecting tree species with rapid growth for biomass fuel production is also vital, ensuring that the appropriate provenance is chosen to suit specific environmental conditions. It is important to convey to potential donor agencies the cost-effectiveness of fuelwood energy development initiatives within nature conservation programs, particularly regarding their contributions to global CO2 reduction.
Ethics Statement
The author has nothing to report.
Conflicts of Interest
The author declares no conflicts of interest.
Funding
There has been no funding received for this study.
Acknowledgments
This study was conducted with the academic and scientific support of faculty members. The author would like to thank the academicians from Hawassa and Mekdela Amba Universities for their assistance with the software analysis.
Appendix 1: Parameters Used for Calculating Carbon Dioxide Emission
Appendix 2: Daily Household Energy Sources Assessment for Weight Survey Data

Appendix 3: Semistructured Questionnaires of Interview Schedule for Households (English Version)
Interview Date --------------------------------------
Enumerator name -------------Signature -----------------
- 1.
Household head (respondent) name/Code-----------------------------------------------------
- 2.
Age of respondent -------------------------------------
- 3.
Sex: (A) Male (B) Female
- 4.
Marital status [-----------------------------------------]
-
(A) Single (B) Divorced (C) Married (D) Widow
- 5.
Household size (number of family member) [------------],
- 6.
Educational status:
-
(A) Cannot read/write (C) Secondary school & Preparatory school
-
(B) Can read & write (D) Elementary school (E) Diploma and above
- 7.
How do you explain awareness creation and training service on environmental implication of fuel wood extraction from the forest and impacts of indoor air pollution?
-
(A) Adequate (B) Limited (C) Good (D) Never aware/trained
- 8.
Total landholding size [in ha----------------]
-
(A) Crop field [---------------------], (D) rangeland [------------],
-
(B) Homestead [--------------------], (E) Woodlot [---------------]
-
(C) Others specify [------------------------------------]
- 9.
What kind of energy does your family consumes for food preparation?
-
(A) Firewood (C) Kerosene/oil, Gas (E) Crop residue/sawdust
-
(B) Charcoal (D) Electricity (F) Animal waste
- 10.
How the energy types utilized by the domestic were gained?
-
(A) Bought only (B) Self-extracted (C) both
- 11.
Who gathers wood fuel from the woodland (A) mother/girl (B) father/boy (C) both
- 12.
What is the permissible proprietorship position of the fuelwood where you harvest?
-
(A) Private (B) state-owned open access forest (C) both
- 13.
Energy source from the forest?
- 14.
Energy sources from nonforest area including
- 15.
Current main occupation [----------------------------]
-
(A) Farmer (C) Daily labor (E) No job
-
(B) Trade (D) Fixed employee (F) Others please specify [-----------------------------------]
- 16.
Which one is Source of household income for you?
-
(A) Agricultural crops including Selling of fuelwood
-
(B) (C) Forest-related production fuelwood, agricultural equipment, fodder
-
(C) Livestock production including animal dung
-
(D) Off-farm activity [if any specify------------------]
-
(E) Others please specify [-----------------------------]
- 17.
(A) Income from Agricultural crops

-
(B) Income from livestock production

-
(C) Forest production without fuelwood

-
(D) Income from off-farm activity

-
(E) Total Credit _____________
- 18.
Do you have upgraded stoves useful for food preparation? (Y/N)? What kind of cooking stove is used in your house?
- 19.
What is the distance from your home to the adjacent forest where you typically gather firewood?-----------
- 20.
How far is the distance from your home to the market where you typically buy or sell fuelwood? ------------------------
- 21.
Are there any limits to the amount of fuelwood you can gather from the forest? (Y/N) If yes, what are they? ---------------------------------------------------]
- 22.
Do you have trees on land that you own? (Y/N) If yes, total number of trees --------------
Appendix 4: Questionnaire for KIs
- 1.
Have you ever heard about deforestation and forest degradation? (A) Yes (B) No
- 2.
What do you believe are the main factors contributing to forest degradation or deforestation in your area?
- 3.
Have you ever received awareness creation and training service on REDD+, fuelwood consumption, indoor air pollution or forest management programs particularly related environmental implication before ground work? (A) Yes (B) No
- 4.
Would you describe any local/environmental knowledge and myth associated with forest degradation and deforestation for fuelwood consumption?
- 5.
How do you describe the contact you have with health, environment, NRM, and forestry experts about indoor air pollution and GHG emission?
- 6.
What is your express on current attitude for status of fuelwood/biomass residue/charcoal consumption? [---------------------------------------------------]
- 7.
Do you believe that using wood-saving stoves could benefit the local population? (Yes, Not sure, Please explain your reasoning) [-----------------------------]
- 8.
Which family members mostly extract firewood and charcoal from the forest in your community? -----------------------------------------------------
- 9.
What did you think about fuelwood extraction compared with other forest products? ----------------------------------------------------]
- 10.
Do you know about woodlot ting? (Y/N) If so, do you believe it is important for the community to prioritize woodlot ting? (Y/N) [-----------------------]
- 11.
Farmers’ Opinion on/Attitude to Future Fuelwood Supplies [whether the forest and bush will ----------------------------------------------------------]
- 12.
Is there any restriction on the amount of wood fuel you collect from the forest? (Y/N) If yes, by what? ---------------------------------------------------]
- 13.
Is there any special time largest amount of fuelwood is produced from the forest ---------------------------
Appendix 5: Questionnaire for Focus Group Discussion
- i.
How do you describe forest degradation and deforestation in your working district?---------------------------------------------------------------------------------------------------------------------------------------]
- ii.
Could you perceive fuelwood collection and other activities affect the forest in the district-------------------------------------------------------------------------------------------------------------------------------------]
- iii.
What you think for the driver of income generating from fuelwood extracted from the forest?----------------------------------------------------------------------------------------------------------------------------------]
- iv.
Could you mention the consequences of deforestation for fuelwood use?---------------------------------------------------------------------------------------------------]
- v.
What are the local environmental challenges related to fuelwood consumption?(--------------------------------------------------------------------------------------)
- vi.
Is there any awareness for the community about adoption of improved cooking stoves and fuel efficiency stoves that can reduce indoor air pollution?---------------------------------------------------------------]
- vii.
What do you think the needs of the farmers in deforestation and fuelwood consumption particularly greenhouse gas emission?------------------------------------------------------------------------------------------]
Open Research
Data Availability Statement
The data supporting the findings of this study were obtained from household surveys and direct field measurements and can be made available upon request from the corresponding author.