Analysis of Forest Cover Change in the Southwest Ethiopia: Key Drivers, Impacts, and Conservation Implications
Abstract
Forest cover changes in southwest Ethiopia have significant social and environmental implications. This study explored the primary drivers and effects of forest cover changes from 1986 to 2019 in the region. A mixed-methods approach was employed, combining socioeconomic data, geospatial data, and both global and locally adapted ecosystem services value (ESV) coefficients. The findings indicated a significant decline in forest cover attributed to its conversion to human-modified land types, with approximately 87.3 percent of respondents acknowledging this reduction in the study area. The intricate factors driving forest cover changes include agricultural expansion, population growth, land grabbing, fuelwood collection, and illegal logging, highlighting the necessity for a multifaceted approach to tackle these challenges. Logistic regression analysis demonstrated that various sociodemographic factors significantly influenced (p < 0.05) respondents’ perceptions regarding the drivers of forest cover change. The ESV over three timeframes indicated a decrease from around US$226.75 million to US$172.81 million, equating to a total loss of approximately 23.79%. The ESV of shrublands fell by 46.35%, wetlands by 32.63%, dense forests by 23.77%, and open forests by 17.29% during the evaluation period. In contrast, cropland rose by 38.06% and agroforestry by 20.03%. Significant ecosystem services, like water supply and disturbance regulation, faced reductions of over 30%. Correlation analysis reveals that forest conservation strategies are linked to the drivers of deforestation, suggesting that integrated approaches can mitigate deforestation and promote sustainable resource management. Positive attitudes toward afforestation, enhanced enforcement, community forest management, and improved agricultural practices highlight opportunities for collaborative conservation efforts. Achieving sustainable conservation requires increased community engagement and governance, along with comprehensive policies to address changes in forest cover and their impacts on ecosystem services.
1. Introduction
Forests are indispensable for the survival of above 1.6 billion individuals and support 80% of terrestrial biodiversity [1, 2]. They provide clean water and air, habitats for wildlife, recreational areas, and more than 5000 daily-use products [3]. Forests also play a vital role in securing the livelihoods of small-scale farmers [4] and contribute significantly to sustainable development goals [5]. Additionally, they help regulate local climates, sequester carbon dioxide [6, 7], maintain healthy watersheds [8–10], and provide significant environmental values, estimated at around US$4.7 trillion annually [11].
Over the past 60 years, global forest cover has reduced by about 82 million hectares, resulting in a loss of over 60% of global forest cover per capita between 1960 and 2019 [12]. Forest cover change continues at an alarming speed, with an average annual loss of 4.7 million ha [2]. Most forest losses occur in low-income countries in the tropics, particularly in Africa, where unsustainable land use practices contribute to widespread deforestation [12]. Forest cover changes are derived by social, economic, and environmental factors, including anthropogenic activities such as agriculture and infrastructure development [13]. In the tropics, deforestation resulted from direct human activities such as agriculture and timber extraction, influenced by underlying factors like demographic pressure and poverty [13, 14]. Agriculture is the leading cause of deforestation, responsible for about 80% of global [15] and 62% of African deforestation [16]. Notably, smallholder agriculture expansion accounted for 92% of Africa’s deforestation from 2001 to 2015 [17].
The loss of forest cover has significantly harmed tropical landscapes [13]. The reduction of forest cover due to deforestation and degradation has severe negative impacts on the environment, biodiversity, and human well-being [5, 18]. Deforestation can lead to reduced income and employment opportunities in rural areas [19], as well as increased food insecurity in African countries [20, 21]. Forest loss also increases vulnerability and reduces resilience to environmental shocks and disasters, negatively affecting rural livelihoods [22].
Ethiopia has experienced significant deforestation over the past three millennia, resulting in isolated patches of forest in remote regions [23]. About 40% of its original forest cover around 20th century [23, 24] has been reduced, leaving only 11.4% remaining [25]. Ethiopia is considered one of the countries that have lost more than 90% of its original forest cover [26]. Deforestation in Ethiopia results from a complex interplay of various factors that shape human–environment interactions [27]. It occurred largely due to the spread of agriculture and population growth [23, 28–30] and policy-related factors [14, 27].
The southwestern region of Ethiopia is one of the areas where the majority of Ethiopia’s high forests are now confined [23, 27]. The forests of southwestern Ethiopia represent a distinctive ecosystem that is rich in biodiversity and globally significant as the genetic origin of Coffea arabica L. [27, 31]. They are recognized as one of the last two substantial blocks of high forest in the country [32] and support the major vegetation type in Ethiopia [33]. This area is also essential for providing various forest-related goods and services, including spices, forest honey, and nontimber forest products that are vital for local communities [27, 31]. However, it has experienced significant deforestation due to humanoid activity, with approximately 80% of its forest declining between 1957 and 2007 [34]. Additionally, it has been significantly fragmented over the past 3 decades [29, 35].
The consequences of deforestation and the resulting environmental degradation have significantly affected the socioeconomic landscape of Ethiopia, leading to challenges such as food insecurity, poverty, migration, and political instability [23]. Local communities face severe repercussions from deforestation, including diminished soil fertility, loss of biodiversity, and disrupted water cycles [18, 36]. Deforestation has also impacted the hydrological response of watersheds, resulting in changes to sediment yield [36, 37]. The effects of deforestation also extend well beyond immediate consequences, carrying long-term socioeconomic and environmental implications, including climate change, desertification, economic losses, and social conflicts [38]. Therefore, tackling forest degradation, loss, and fragmentation has become a primary focus of recent initiatives [39].
Forest cover change and its drivers have garnered attention due to their significant ecological and socioeconomic impacts, shifting focus from individual trees to broader dynamics like afforestation and biodiversity loss [40]. Remote sensing (RS) tools are now used to monitor these changes and support sustainable forest management [40–42], while combining local knowledge with RS and geographic information system (GIS) data enhances the understanding of forest dynamics [43, 44]. This integration improves data accuracy and addresses gaps, making RS, GIS, and socioeconomic data vital for analyzing forest cover changes. A comprehensive approach that considers environmental, socioeconomic, and ecological factors is necessary for effective resource management. Furthermore, linking forest cover change with empirical assessments of forest ecosystem services (FESs) aids in understanding local impacts [45–49] and aligns management efforts with community priorities, promoting targeted strategies for sustainable forest management.
Reversing deforestation and degradation demands innovative strategies that balance socioeconomic and ecological factors [39, 50]. In Ethiopia, efforts to combat deforestation since the 1970s have seen limited success due to a campaign-based approach [23]. Additionally, government initiatives to restore degraded lands and manage forests have struggled due to insufficient local adaptations and a lack of long-term resilience strategies [51].
Recent studies highlight the significance of understanding local perspectives, identifying drivers of change, and creating adaptable forest conservation strategies that integrate ecological and socioeconomic goals. Solomon et al. [28] demonstrated that effective forest management necessitates comprehending local communities’ views and specific drivers of change. Another study also revealed that for conservation initiatives to be successful, they must consider site-specific factors to improve both conservation outcomes and livelihoods [51]. Collaborative forest management plans that align ecological and socioeconomic objectives in Ethiopia are essential, as emphasized by [52]. Studies recommend against a one-size-fits-all conservation strategy [39, 53], emphasizing the need for diversified systems that align with specific social-ecological contexts and adaptable approaches.
The southwestern region of the country is characterized by diverse biophysical and sociocultural factors, resulting in varied society–nature interactions that affect natural resources, including forests, in different ways. Most studies concerning forests in the southwest either focus on LU/LC change dynamics [35, 49, 54] or are conducted in geographically distinct areas with varying sociocultural characteristics [29, 30, 55–57]. Consequently, they fail to effectively inform land use policies in our study area due to the complex interplay of social, environmental, and diverse biophysical and socioeconomic factors [58].
To sustainably conserve the forest blocks of southwest Ethiopia and protect their ecosystem services, it is essential to tackle site-specific drivers, understand community perceptions of current conservation strategies, and assess the effects of forest cover changes. This study seeks to advance our understanding of forest cover change dynamics in the moist evergreen Afromontane forests of the Bench-Sheko Zone by examining the factors that drive these changes and their effects. The research site, located in the upper catchments of the Baro-Akobo basin, plays a vital role in watershed protection and biodiversity conservation in the region.
This study seeks to address this gap by examining forest cover data from 1986 to 2019, combined with relevant socioeconomic data and both global and locally adapted ecosystem services value (ESV) coefficients. It identifies the key drivers and impacts of changes in forest cover while proposing strategies to mitigate deforestation. The findings will aid in formulating effective conservation strategies for the region and potentially beyond.
2. Materials and Methods
2.1. Study Area
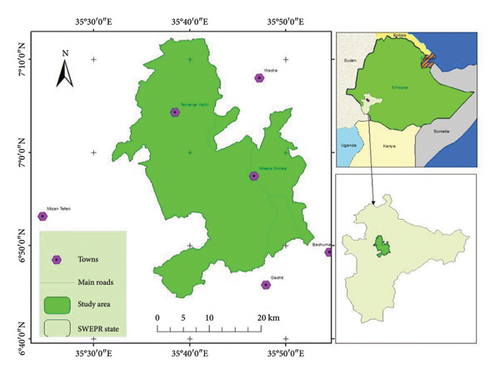
The research site covered Shey Bench and Semen Bench districts of Bench-Sheko Zone within Southwest Ethiopia Peoples’ Regional (SWEPR) State, Ethiopia. It lies between 6°44′24″ to 7°12′18″ N latitude and 35°32′1″ to 35°53′2″ E longitude (Figure 1).
Physically, it was characterized by a hilly landscape, with the largest forest coverage lying on the slope of the terrain. The study landscape is characterized by a moist and evergreen Afromontane forest ecosystem [59]. The altitudes vary between 1144 and 2696 m above sea level. The mean annual precipitation is 1780 mm per year. The average air temperature is between 13°C and 27°C [36]. According to the Harmonized African Soil Map, leptosols predominate on mountain ridges, nitisols on hill slopes, and fluvisols on valley floors [60]. The research area was inhabited by a total of 288,391 individuals, comprising 48.1% males and 51.9% females [61]. The local community relies heavily on mixed agriculture, which combines rain-fed farming and animal husbandry for sustenance. The major income sources of the community include coffee, korarima, cereal crops, fruits, other cash crops, and livestock sales.
2.2. Methods
2.2.1. Forest Cover Data
LU/LC data were sourced from Ref. [35] (Table 1). The LU/LC data were analyzed using satellite images collected United States Geological Survey (USGS) during the dry season (December and January) for the years 1986, 2002, and 2019 and were classified using the Maximum Likelihood Classification (MLC) method. The classification process adhered to the guidelines established by Refs. [62, 63]. Seven LU/LC types were identified in the study area, as detailed in Table 1 [35].
| LU/LC class | Distribution of LU/LC (ha (%)) | ||
|---|---|---|---|
| 1986 | 2002 | 2019 | |
| Dense forest | 19,171 (20%) | 15,153 (15.8%) | 14,618 (15.3%) |
| Open forest | 20,058 (21%) | 17,193 (18%) | 16,591 (17.4%) |
| Shrub land | 6920 (7.24%) | 4217 (4.4%) | 3719 (4%) |
| Settlement | 1073 (1.12%) | 1711 (1.8%) | 2830 (3%) |
| Wetland | 6039 (6.3%) | 4689 (5%) | 4069 (4.3%) |
| Cropland | 15,958 (16.7%) | 32,552 (34%) | 22,032 (23%) |
| Agroforestry | 26,429 (27.6%) | 20,135 (21%) | 31,791 (33.2%) |
- Note: Source [35].
The overall accuracy of the classified LU/LC maps ranges from 87.7% to 92% across the study periods with corresponding kappa statistics ranges from 0.86 to 0.91 (Table 2), which indicated reliable LU/LC classification. To assess changes in LU/LC classes over the study period from 1986 to 2019, a thematic change detection method was utilized. Additional details on the LU/LC data and methodology can be found in Ref. [35]. For the analysis of forest cover change, the classified LU/LC was reclassified using ArcGIS 10.4.1.
| LU/LC class | 1986 | 2002 | 2019 | |||
|---|---|---|---|---|---|---|
| Users’ | Producer’s | Users’ | Producer’s | Users’ | Producer’s | |
| Shrubland | 90 | 84.9 | 92.5 | 89.1 | 95 | 93.4 |
| Wetland | 92.2 | 90.4 | 98.2 | 90 | 91.7 | 91.7 |
| Settlement | 93 | 94.6 | 92.3 | 88.9 | 93.3 | 95 |
| Open forest | 82.8 | 82.8 | 79.6 | 82.7 | 86.7 | 89.7 |
| Agroforestry | 88.3 | 77.9 | 87 | 85.5 | 93.3 | 95 |
| Dense forest | 85 | 98.1 | 86.5 | 91.8 | 93.3 | 93.3 |
| Cropland | 83.9 | 88 | 81.4 | 92.3 | 91.7 | 87.3 |
| Overall accuracy | 87.7 | 88.1 | 92.1 | |||
| Kappa statistics | 0.86 | 0.86 | 0.91 | |||
- Note: Source [35].
The results showed that agroforestry covered 27.6% of the study area in 1986, followed by open forest (21%), dense forest (20%), and cultivated land (16.7%). The coverage of settlements and wetlands is 1.12% and 6.3%, respectively. By 2002, cropland became the dominant cover type at 34.4%, while agroforestry, open forest, and dense forest occupied 21%, 18%, and 15.8% of the surveyed landscape, respectively. In 2019, agroforestry covered the majority of the surveyed area at 33.2%, while cultivated land was at 23%, while settlements, shrublands, and wetlands remained minimal [35].
2.2.2. ESV Estimation
The LU/LC data from [35] were used to evaluate the impact of changes in forest cover on the value of forest ecosystem services (FESVs) in the region, applying the benefit transfer method (BTM). We obtained the coefficients for ESVs related to the study’s LU/LC categories from empirical studies conducted by Refs. [64, 65] (Table 3). Given the variations in local and global conditions [47], a combination of global annual value coefficients [65] and locally adjusted coefficients [65, 66] for the ecosystem service function (ESVf) associated with each land cover type was utilized (Table 4). Since there is a scarcity of ESV studies focused on traditional agroforestry, we adopted the value coefficients from Ref. [65], based on the assumption that the multistrata agroforestry characteristics at the study site are comparable to those of the policy area.
| LU/LC types | Equivalent biome | Ecosystem service coefficient (US$ ha−1·yr−1) |
|---|---|---|
| Agroforestry | Tropical forest | a603.30 |
| Cropland | Cropland | 225.56 |
| Dense forest | Tropical forest | 2095.25 |
| Open forest | Tropical forest | 2095.25 |
| Shrubland | Forests | 969 |
| Wetland | Swamps/marsh | 19,581 |
| Settlement | Urban | 0 |
- aRepresents ESV coefficients (US$ ha−1 yr−1) adopted from [65].
| Ecosystem services | ESV (US$ ha−1·yr−1) of LC type | ||||||
|---|---|---|---|---|---|---|---|
| Dense forest | Open forest | Agroforestry | Shrubland | Wetland | Cropland | Settlement | |
| Provisioning services | 396 | 396 | 171.1 | 200 | 7696 | 187.56 | 0 |
| Water supply | 8 | 8 | 16.10b | 3 | 7600 | ||
| Food production | 32 | 32 | 102.80b | 43 | 47 | 187.56a | |
| Raw material | 315 | 315 | 19.30b | 138 | 49 | ||
| Genetic resources | 41 | 41 | 32.90b | 16 | |||
| Regulating services | 628.68 | 628.68 | 344 | 330 | 9194 | 24 | 0 |
| Water regulation | 6 | 6 | 2.40b | 2 | 30 | ||
| Wastewater treatment | 136a | 136a | 19.60b | 87 | 1659 | ||
| Erosion control | 245 | 245 | 183.40b | 96 | |||
| Climate regulation | 223 | 223 | 132.30b | 141 | |||
| Biological control | 6.30b | 2 | 24 | ||||
| Gas regulation | 13.68a | 13.68a | 14.0b | 2 | 265 | ||
| Disturbance regulation | 5 | 5 | 7240 | ||||
| Supporting services | 956.57 | 956.57 | 67.4 | 371 | 439 | 14 | 0 |
| Nutrient cycling | 922 | 922 | 32.3b | 361 | |||
| Pollination | 7.27 | 7.27 | 18.7b | ||||
| Soil formation | 10 | 10 | 6.5b | ||||
| Habitat/refugia | 17.3a | 17.3a | 9.9b | 439 | 0 | ||
| Cultural services | 114 | 114 | 6.8b | 68 | 2252 | ||
| Recreation | 112 | 112 | 6.1b | 66 | 491 | ||
| Cultural | 2 | 2 | 0.7b | 2 | 1761 | ||
| Total | 2095.25 | 2095.25 | 603.30 | 969 | 19,581 | 225.56 | 0 |
2.2.3. Socioeconomic Data Collection and Analysis
The socioeconomic data were integrated with geospatial information to address complex questions that geospatial data alone cannot fully resolve, such as the underlying reasons and mechanisms driving these changes [43, 70], and to conduct a comprehensive analysis of forest cover dynamics that informs conservation decisions. A mixed-methods approach, including focus group discussions, key informant interviews, and household surveys, was employed to gather community perspectives on forest cover change, its drivers, consequences, and attitudes toward conservation strategies. Furthermore, we consulted experts and reviewed the existing literature to deepen our understanding of the issue [28, 71].
Farmers’ attitudes were assessed using a ranking method adapted from Ref. [81], where ratings on a Likert scale were aggregated into mean scores for each respondent. These scores were then categorized into four groups: “very high,” “high,” “medium,” and “low.” This classification helps forest conservation decision-makers prioritize effective strategies based on public perspectives.
Very High = Weighted Mean + SD ≤ A ≤ Max.; High = Weighted Mean ≤ B < Mean + SD; Moderate = Weighted Mean − SD ≤ C < weighted mean, and Low = Min. ≤ D < weighted mean − SD,
where A, B, C, and D are grades (means of the respondents) assigned, and Max. and Min. represents the maximum (5) and minimum (1) Likert scale value, respectively. Spearman’s correlation analysis was conducted to assess the relationship between participants’ perceptions of change drivers and their attitudes toward conservation measures.
3. Result and Discussion
3.1. Socioeconomic Characteristics of Respondents
The survey result indicated that the majority of participants (80.2%) were male. The average age of the household was 48.2 years. All participants were married and had an average family size of around six people (Table 5). Approximately 51% of the participants were illiterate, while 49.2% attended primary school or higher. The average landholding size of the participants was 2.76 ha. The average annual income of the participants was 18,492 ETB. Participants had been residing in the area for an average of 43.25 years.
| Household attributes | Value |
|---|---|
| Gender (male, %) | 80.2 |
| Average household age (year) | 48.2 (±10.95) |
| Marital status (married, %) | 100 |
| Average family size (number) | 6.44 (±2.27) |
| Education background (illiterate, %) | 50.8 |
| Average land holding size (ha) | 2.76 (±2.1) |
| Had enough for agriculture (yes, %) | 42.9 |
| Mean household income (birr ∗/year) | 18,492 (±13,470) |
| Average length of duration of local residence (year) | 43.25 (±13.21) |
| Visit forest to get benefits from forest (yes, %) | 88.9 |
- ∗Ethiopian currency: at the time of the study, 1 USD = 32.65ETB.
3.2. Perception of Community Toward Forest Cover Change
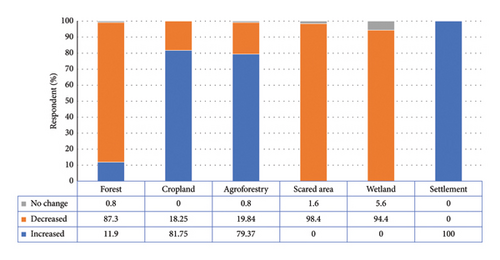
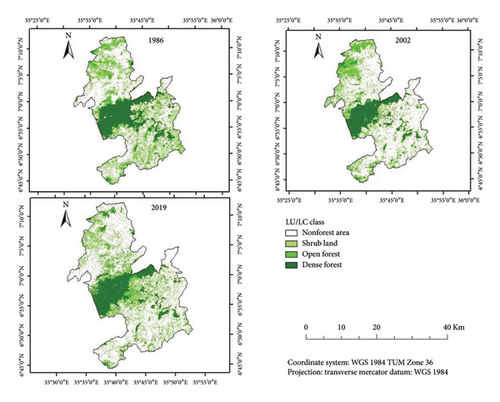
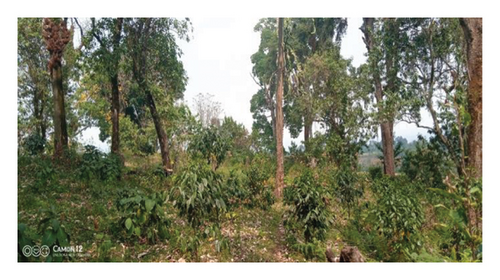
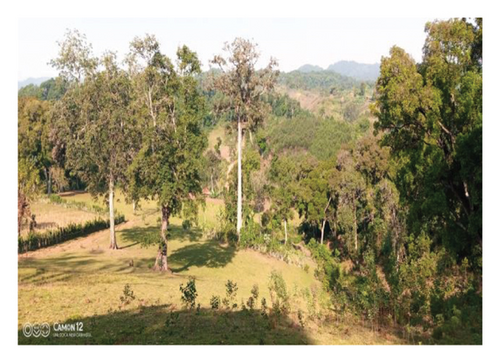
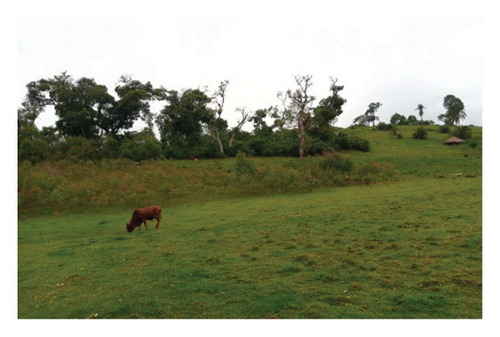
The survey results (Figure 2) showed that a significant majority of respondents observed decreases in forest (87.3%) and wetland (94.4%) areas in the study region. In contrast, increases were reported in settlement areas, cropland, and agroforestry land use, with 100%, 81.8%, and 79.4% of participants acknowledging these changes, respectively. These findings are consistent with the LU/LC changes reported by Ref. [35] (Table 1), showing a decline of 23.75% in dense forests, 17.29% in open forest, 46.27% in shrubs, and 32.63% in wetlands, alongside increases of 163.82% in settlements, 38.06% in cropland, and 20.29% in agroforestry over the past 3 decades. This shift is attributed to the growing demand for agricultural production, settlement expansion, and forest products, leading to loss and fragmentation forest blocks in the study area (Figure 3).
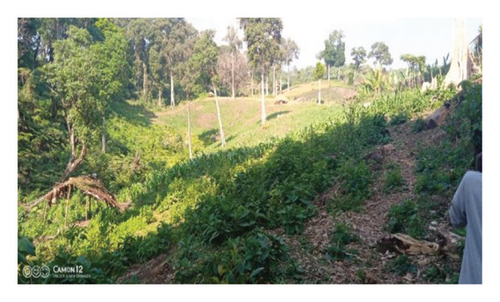
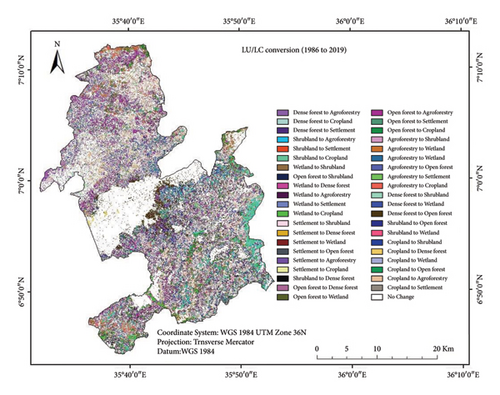
Focus group discussions and key informants confirmed a significant decrease in forest cover in the research area, primarily due to land clearing for agriculture, settlements, eucalyptus plantations, and cash crops like coffee and khat (Figure 4). LU/LC analysis revealed substantial conversion of forested areas (Figure 5), with 88% of shrublands, 61% of open forests, and 42% of dense forests transformed into other land types, leading to an annual loss of 340 ha of forest cover [35].
Additionally, studies indicate a significant decline in forest cover in southwestern Ethiopia. One study found a 19.6% reduction in natural forest cover, while coffee plantations increased by 10.2% [57]. Another study noted an 88% rise in agricultural land and a 157% increase in settlements, resulting in a 30.5% decrease in forest cover within the Kaffa biosphere reserve [29]. Furthermore, Ref. [82] identified a 25.76% drop in natural forest cover, alongside an 18.35% increase in nonforest areas in the region.
The decline in forest cover is largely due to human activities, particularly policy changes in agriculture and land use, as well as population growth. Post-1990 agricultural development policies have intensified deforestation, especially in the southwest [83]. Focus group discussions and key informant interviews indicated that a government-sponsored resettlement program from 1985 to 1988 was also a significant factor. They also indicated that changes in land policies during the Derg regime (1974–1991) weakened customary laws and traditional practices, further driving forest degradation. The banning of cultural practices and the persecution of community leaders damaged the connection between local communities and the forests, eroding traditional ownership norms.
Studies in Ethiopia support this research, showing that the abolition of land rights in the 1970s led to legal pluralism in nationalized forest areas, significantly contributing to the destruction of moist evergreen Montane forests during the Derg regime [84]. Furthermore, it was found that state forest policies’ failure to recognize traditional institutions has resulted in illegal exploitation and deforestation [85]. Additionally, the Derg regime’s land policies undermined conservation efforts and disrupted traditional land management practices, worsening the issue [86].
Focus group participants linked the resettlement program to widespread deforestation, highlighting the study area’s role as a major hub for Derg’s initiatives. Another study confirmed that resettlement programs adversely impacted forest cover in Ethiopia [23, 87]. Key informants noted accelerated deforestation during the Ethiopian People’s Revolutionary Democratic Front (EPRDF) regime (1991–2018), attributing this to inadequate government control over forest management and policies promoting intensive agriculture and coffee production. Reports associated with this indicate more than 10% increase in plantations of coffee and/or tea [56, 82] over the past 3 decades in southwest Ethiopia, significantly contributing to the decline in forest cover in addition to other factors.
3.3. Perception of Community on Drivers of Forest Cover Change
The research identified 15 key factors driving deforestation in the region (Table 6), with agricultural expansion (100%), population growth (100%), land grabbing (99.2%), fuelwood collection (95.2%), and illegal logging (99.2%) ranked as the most significant. Other contributors include the lack of community involvement, weak law enforcement, corruption, and human settlement. Key informants noted that local corruption hindered forest regulation enforcement and community engagement in conservation. Significant differences in perceptions of drivers of forest cover changes were found among residents, particularly regarding settlement, law enforcement, government policies, and loss of traditional conservation practices.
| Perceived causes of forest cover loss | Response by kebele (yes, %) | Overall | χ2 | Rank | |||
|---|---|---|---|---|---|---|---|
| Shafa Guid | Woshiken | Dakin | Kusha | ||||
| Fuel wood collection | 100 | 80.6 | 100 | 100 | 95.2 | 4 | |
| Agriculture expansion | 100 | 100 | 100 | 100 | 100 | 1 | |
| Population growth | 100 | 100 | 100 | 100 | 100 | 2 | |
| Forest land grabbing | 97.67 | 100 | 100 | 100 | 99.2 | 3 | |
| Settlement | 74.4 | 83.9 | 84.6 | 56.4 | 72.2 | ∗ | 10 |
| Low forest law enforcement | 76.7 | 87.1 | 100 | 66.7 | 78.6 | ∗ | 8 |
| Illegal logging | 90.7 | 100 | 100 | 92.3 | 94.4 | 5 | |
| Charcoal making | 93 | 80.6 | 92.3 | 89.7 | 88.9 | 6 | |
| Government policy | 58.1 | 83.9 | 92.3 | 46.2 | 64.3 | ∗∗∗ | 11 |
| Corruption | 76.7 | 61.3 | 84.6 | 31.5 | 73.02 | 9 | |
| Free grazing | 41.9 | 41.9 | 46.2 | 17.9 | 34.9 | 15 | |
| Farmland degradation | 81.4 | 67.7 | 92.3 | 71.8 | 76.2 | 12 | |
| Increasing wood processing industry | 55.8 | 71 | 92.3 | 59 | 64.3 | 13 | |
| Low community participation | 93 | 90.3 | 100 | 94.9 | 93.7 | 7 | |
| Loss of traditional forest conservation | 58.1 | 90.3 | 100 | 20.5 | 58.7 | ∗∗∗ | 14 |
- ∗∗∗and ∗indicate significance at p < 0.001 and p < 0.05, respectively, depicting that the location of respondents had a significant effect on the perception of farmers toward the drivers, N = 126.
Expert feedback and observations indicate a trend of converting forests into agroforestry and settlements, driven by declining arable land productivity and soil issues like acidity and reduced fertility. Deforestation, especially on steep slopes, has increased due to land degradation and rising costs of fertilizers, resulting in nutrient depletion in cropland [35].
Analysis of population trends in the study area reveals an increase from 95,129 in 1986 to 288,391 in 2019, a growth of 203.16% over 33 years (Figure 6). This population surge is expected to elevate demand for agricultural land, settlement area, biomass energy, and construction materials, impacting forest ecosystems.
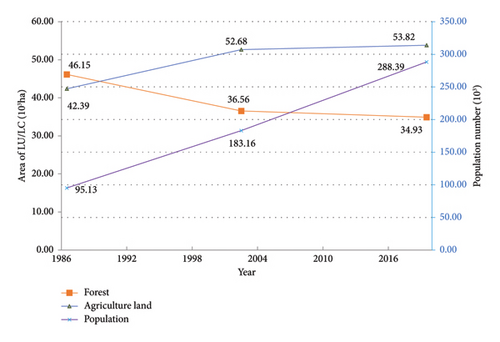
Research indicates that illegal logging, corruption, and land grabbing significantly contribute to deforestation in Gambella, Ethiopia [88]. Corruption undermines law enforcement and forest management efforts [89, 90]. Various studies link agricultural expansion driven by population growth to changes in forest cover [85, 90–94].
Experts note that the illicit timber trade and government backing of small-scale wood processing to combat urban unemployment have exacerbated deforestation, threatening species like Cordia africana and Pouteria altissima. Reports from Bench-Sheko Zonal Enterprise and Industry Development Office (2020) show licensed timber processing enterprises grew from 2 in 2008 to 129 in 2019, a staggering 6350% increase, highlighting the adverse effects of employment-driven policies on forest resources.
3.4. Socioeconomic Factors Influencing of Forest Cover Change Drivers
The study analyzed the influence of socioeconomic variables on local communities’ perceptions of the drivers of forest cover change. A logistic regression analysis revealed that six variables—gender, age, education level, income, landholding size, and length of residency—significantly impacted (p < 0.05) respondents’ perceptions (Table 7).
| Drivers | Independent variables | β | S.E. | Wald | Df` | Sig. | Exp (β) |
|---|---|---|---|---|---|---|---|
| Charcoal making | Landholding size | 1.34 ∗∗∗ | 0.35 | 14.88 | 1 | 0.00 | 3.82 |
| Income | −0.002 ∗ | 0.001 | 3.5 | 1 | 0.04 | 0.998 | |
| Constant | −5.61 ∗ | 2.58 | 4.74 | 1 | 0.03 | 0.004 | |
| Farmland degradation | Sex (1) | 1.59 ∗ | 0.87 | 3.34 | 1 | 0.04 | 4.89 |
| Landholding size | 0.78 ∗∗∗ | 0.2 | 15.58 | 1 | 0.00 | 2.18 | |
| Firewood collection | Landholding size | 0.95 ∗ | 0.42 | 5.05 | 1 | 0.02 | 2.58 |
| Settlement | Age | −0.05 ∗ | 0.04 | 1.28 | 1 | 0.04 | 0.96 |
| Lived in the village | 0.07 ∗ | 0.03 | 3.83 | 1 | 0.04 | 1.07 | |
| Constant | −2.76 ∗ | 1.24 | 4.96 | 1 | 0.02 | 0.06 | |
| Change in government policy | Sex (1) | 1.32 ∗ | 0.6 | 4.93 | 1 | 0.02 | 3.77 |
| Constant | −2.21 ∗ | 1.17 | 3.61 | 1 | 0.03 | 0.11 | |
| Corruption | Sex(1) | −0.18 ∗ | 0.07 | 6.69 | 1 | 0.01 | 0.83 |
| Education | 5.53 | 2 | 0.06 | ||||
| Education (1) | 1.05 ∗ | 0.47 | 5.06 | 1 | 0.02 | 2.85 | |
| Wood processing industry | Landholding size | 0.33 ∗ | 0.14 | 5.55 | 1 | 0.01 | 1.39 |
| Loss of indigenous forest management | Age | 0.22 ∗ | 0.11 | 4.21 | 1 | 0.04 | 1.244 |
| Sex (1) | −1.13 ∗ | 0.52 | 4.65 | 1 | 0.03 | 0.324 | |
| Constant | −2.83 ∗ | 1.24 | 5.22 | 1 | 0.02 | 0.059 | |
- Note: Number of observation = 126; R2 is Negelkerke’s R2.
- ∗p < 0.05.
- ∗∗∗p < 0.001.
The gender of respondents significantly affected their perceptions of farmland degradation, government policy change, corruption, and the loss of indigenous forest management systems as drivers of forest cover change. For instance, male respondents were more likely than female respondents to perceive farmland degradation and government policy changes as contributing to forest cover changes.
Age was found to positively and significantly influence perceptions of the loss of indigenous forest management systems and settlement as drivers of forest cover changes, indicating that older respondents were more likely to recognize these factors. The size of landholdings significantly impacted perceptions of charcoal making, farmland degradation, and firewood collection as drivers of forest cover changes, with larger landholders more likely to view these activities as contributing to deforestation.
Additionally, income and length of residency in the study village influenced perceptions of charcoal making and settlement. Education also played a role in shaping perceptions of corruption and the loss of traditional forest management practices as drivers of forest cover change.
The study’s findings align with previous research highlighting the importance of socioeconomic factors in shaping local communities’ perceptions of forest cover changes [75, 78, 95, 96]. It emphasizes the need for tailored conservation strategies that address the unique needs of local communities. The results suggest that policies and initiatives should prioritize socioeconomic factors that influence how communities perceive and respond to changes in forest cover. This study underscores the significance of considering socioeconomic factors in community-based conservation efforts.
3.5. Change in Forest ESVs
The study estimated the ESV for 1986, 2002, and 2019, showing totals of approximately US$226.75 million, US$183.16 million, and US$172.81 million, respectively (Table 8). In 1986, wetlands (52.15%) were the largest contributors followed by open forests (18.54%), while croplands accounted for only 1.59%. By 2002, wetlands still led at 50.13%, followed by open forests (19.67%) and dense forests (17.33%). In 2019, wetlands (46.1%), open forests (20.11%), and agroforestry (11.1%) remained significant contributors.
| LU/LC type | ESV(US$ in 106) | ESV changes (%) | |||||||
|---|---|---|---|---|---|---|---|---|---|
| 1986 | 2002 | 2019 | 2002–1986 | 2019–2002 | 2019–1986 | ||||
| US$ | % | US$ | % | US$ | % | ||||
| Dense forest | 40.18 | 17.72 | 31.75 | 17.33 | 30.63 | 17.72 | −20.98 | −3.53 | −23.77 |
| Open forest | 42.03 | 18.54 | 36.02 | 19.67 | 34.76 | 20.11 | −14.29 | −3.5 | −17.29 |
| Shrubland | 6.71 | 2.96 | 4.09 | 2.23 | 3.6 | 2.08 | −39.05 | −11.98 | −46.35 |
| Agroforestry | 15.98 | 7.05 | 12.15 | 6.63 | 19.18 | 11.10 | −23.97 | +57.86 | +20.03 |
| Wetland | 118.25 | 52.15 | 91.81 | 50.13 | 79.67 | 46.10 | −22.36 | −13.22 | −32.63 |
| Cropland | 3.6 | 1.59 | 7.34 | 4.01 | 4.97 | 2.88 | +103.89 | −32.29 | +38.06 |
| Settlement | 0 | 0 | 0 | 0 | 0 | 0 | 0 | 0 | 0 |
| Total | 226.75 | 100 | 183.16 | 100 | 172.81 | 100 | −19.22 | −5.65 | −23.79 |
The main ESVf in the study area were water supply, disturbance regulation, and nutrient cycling, contributing 20.58%, 19.37%, and 17.43% of total ESVf in 1986, respectively. In 2002, these figures were 19.78%, 18.63%, and 17.47%. By 2019, water supply accounted for 18.34% of the total ESV, followed closely by nutrient cycling at 18.02% and disturbance regulation at 17.14% (Table 9). The CS remains consistently below 1, indicating that the estimate of total ESV is relatively inelastic to the coefficient values, thus validating the robustness of our assessment (Table 10).
| ESVf | ESVf (US$ in 106) | Change in ESVf (%) | ||||
|---|---|---|---|---|---|---|
| 1986 | 2002 | 2019 | 2002–1986 | 2019–2002 | 2019–1986 | |
| Provisioning services | 70.92 (31.28%) | 59.29 (32.37%) | 53.98 (31.24%) | −15.43 | −8.96 | −23.20 |
| Water supply | 46.66 (20.58%) | 36.23 (19.78%) | 31.69 (18.34%) | −22.35 | −12.52 | −32.07 |
| Food production | 7.55 (3.33%) | 9.61 (5.25%) | 8.75 (5.06%) | +27.26 | −8.97 | +15.85 |
| Raw material | 14.12 (6.23%) | 11.39 (6.22%) | 11.16 (6.46%) | −19.34 | −2.04 | −20.98 |
| Genetic resources | 2.59 (1.14%) | 2.06 (1.12%) | 2.38 (1.38%) | −20.64 | +16 | −7.94 |
| Regulating services | 92.33 (40.72%) | 72.84 (39.76%) | 70.16 (40.6%) | −21.11 | −3.68 | −24.01 |
| Water regulation | 0.49 (0.22) | 0.39 (0.21%) | 0.39 (0.23%) | −20.75 | 0.4 | −20.43 |
| Wastewater treatment | 16.48 (7.27%) | 12.94 (7.06%) | 11.94 (6.9%) | −21.46 | −7.71 | −27.52 |
| Erosion control | 15.13 (6.67%) | 12.02 (6.56%) | 13.83 (8%) | −20.56 | +15.07 | −8.59 |
| Climate regulation | 13.23 (5.84%) | 10.47 (5.72%) | 11.69 (6.77%) | −20.84 | +11.63 | −11.63 |
| Biological control | 0.56 (0.25%) | 0.92 (0.5%) | 0.74 (0.43%) | +62.58 | −19.64 | +30.64 |
| Gas regulation | 2.52 (1.11%) | 1.98 (1.08%) | 1.96 (1.13%) | −21.67 | −0.89 | −22.37 |
| Disturbance regulation | 43.92 (19.37%) | 34.12 (18.63%) | 29.61 (17.14%) | −22.34 | −13.18 | −32.57 |
| Supporting services | 44.74 (19.73%) | 36.39 (19.86%) | 35.47 (20.53%) | −18.66 | −2.53 | −20.72 |
| Nutrient cycling | 39.52 (17.43%) | 32 (17.47%) | 31.14 (18.02%) | −19.05 | −2.66 | −21.2 |
| Pollination | 1 (0.44%) | 1.07 (0.58%) | 1.13 (0.65%) | 6.31 | +5.85 | +12.53 |
| Soil formation | 0.63 (0.28%) | 0.5 (0.27%) | 0.56 (0.32%) | −21.65 | +11.97 | −12.27 |
| Habitat/refugia | 3.59 (1.58%) | 2.82 (1.52%) | 2.64 (1.56%) | −21.57 | −6.26 | −26.48 |
| Cultural services | 18.73 (8.26%) | 14.67 (8.01%) | 13.19 (7.63%) | −21.68 | −10.84 | −29.58 |
| Recreation | 7.98 (3.52%) | 6.33 (3.46%) | 5.93 (3.43%) | −20.7 | −6.22 | −25.63 |
| Cultural | 10.75 (4.74%) | 8.34 (4.55%) | 7.26 (4.2%) | −22.35 | −13.03 | −32.47 |
- Note: (+) and (−) indicate gain and loss, respectively.
| Change in valuation coefficient (VC) (%) | Effect of changing VC from the original value | |||||
|---|---|---|---|---|---|---|
| 1986 | 2002 | 2019 | ||||
| % | CS | % | CS | % | CS | |
| Dense forest VC ± 50 | ±8.86 | ±0.18 | ±8.67 | ±0.17 | ±8.86 | ±0.18 |
| Open forest VC ± 50 | ±9.27 | ±0.19 | ±9.83 | ±0.20 | ±10.6 | ±0.20 |
| Shrubland VC ± 50 | ±3.41 | ±0.07 | ±1.12 | ±0.02 | ±1.04 | ±0.02 |
| Agroforestry VC ± 50 | ±3.52 | ±0.07 | ±3.32 | ±0.07 | ±5.56 | ±0.11 |
| Wetland VC ± 50 | ±26.07 | ±0.52 | ±25.06 | ±0.5 | ±23.05 | ±0.46 |
| Cropland VC ± 50 | ±0.79 | ±0.02 | ±2.0 | ±0.04 | ±1.14 | ±0.03 |
Approximately 88.9% of respondents reported visiting forests for various provisioning ecosystem services at least once per month, indicating that the majority of the community relies on forest resources for social and economic purposes (Table 3). Key informants and focus group discussions confirmed the diverse value of forests, including their historical significance as hunting grounds and sites for rituals believed to bring blessings to community well-being. Previous research highlights the diverse benefits that forests provide to community livelihoods, including essential direct products and environmental services that support well-being and income [95, 97–100].
However, the study revealed a significant decline in the ESV over the analyzed periods, with an overall loss of about 23.79% from 1986 to 2019. This decrease in the ESV is primarily linked to the degradation of wetlands and forests, largely driven by their conversion into cropland, agroforestry, and settlement areas. Different LU/LC experienced varied changes in the ESV: Shrublands showed a decline of 46.35%, wetlands decreased by 32.63%, dense forests dropped by 23.77%, and open forests declined by 17.29%. In contrast, cropland and agroforestry experienced increases of 38.06% and 20.03%, respectively. Despite the growing contributions from agroforestry and cropland, their overall effect on ESV remains minor compared to the substantial losses in natural ecosystems. These findings indicate that the continued degradation of wetlands and forests could adversely impact environmental health and local livelihoods. The decline in the ESV as a result of forest cover decline has also reported in other studies [66, 67, 101–103].
Similarly, the forest cover change over the last 33 years has resulted in a reduction of most ESVfs, except for biological control, food production, and pollination, which rose by 30.64%, 15.85%, and 12.53%, respectively. These increases are mainly associated with increasing agroforestry land and cropland uses. The most impacted services were disturbance regulation (32.57%), cultural service (32.47%), water supply (32.07%), wastewater treatment (27.5%), habitat/refugia (26.48%), recreation (25.63%), gas regulation (21%), and raw materials (21%). A study reported by [67] also demonstrated that significant losses have occurred in essential services such as erosion control and wastewater treatment in the Munessa-Shashemene landscape. Overall, cultural, regulatory, provisioning, and supporting services declined by 29.58%, 24.01%, 23.2%, and 20.72%, respectively. This decline may threaten water supply, shelter, and economic stability for communities dependent on agriculture and forestry, while a loss in regulatory services can lead to economic losses, food insecurity, health risks, and increased vulnerability to extreme weather.
This study is supported by earlier research indicating that deforestation negatively affects ecosystem services [92, 100, 104]. The loss of forest cover exacerbates flooding and disrupts the water cycle [89, 105–107], potentially leading to reduced rainfall and droughts [108], increasing sediment runoff [36], impacting hydroelectric operations [109], and degrading water quality. The shift from forest land to simplified land uses such as agroforestry and cropland can adversely affect native woody species and diminish ESVs [46]. These changes in forest cover can generally threaten local climates, resource availability, and agricultural productivity, resulting in economic losses and poorer living conditions.
3.6. Community Opinions on Forest Conservation
Incorporating community insights is vital for effective forest conservation. Over the past 33 years, the study area has seen various forest management systems. The Derg regime (1974–1991) used a top-down strategy focused on afforestation and reforestation, which reduced deforestation but lacked community engagement, leading to later deforestation issues. Research confirms this trend, showing improved forest cover in northern Ethiopia during that time [110].
Since the EPRDF assumed power in 1991, efforts have aimed to transition from state-controlled to community forest management (CFM) to enhance conservation and engage local communities and nongovernmental organizations (NGOs). CFM has been implemented by various NGOs in the study region [111], and reports from Zonal Agriculture offices suggest that the majority of natural forests are now being incorporated into PFM, with the support of the REDD + project. Besides, forest conservation initiatives included demarcating forest boundaries and relocating illegal settlers from steep forested areas to fertile lowland. However, these attempts have largely been ineffective due to insufficient community involvement and weak law enforcement.
The analysis of attitude data (Table 11) reveals ranges of opinions on forest conservation options, with a mean score of 4.08 indicating overall positive attitudes. Households showed strong support for various initiatives, scoring highest for afforestation (4.52), strengthening enforcement (4.45), enhancing environmental education (4.37), CFM (4.30), improving agricultural productivity (4.26), and agroforestry practices (4.25). In contrast, there was less support for relocating illegal settlers (3.78), redrawing forest boundaries (3.38), and regulating illegal commercialization (3.67). Communities may resist relocating settlers due to concerns about livelihood loss and potential conflicts, as these individuals have established ties in the area [112]. Similarly, fears of losing access to essential resources and a sense of identity may lead to opposition against boundary changes, perceived as an external imposition [113].
| Attitude statements | Mean ± std. error |
|---|---|
| 1. Afforestation and reforestation efforts can significantly increase the diversity and coverage of forest resources | 4.52 ± 0.046 |
| 2. Strengthening forest law enforcement can help reduce deforestation and forest land grabs | 4.45 ± 0.059 |
| 3. Agroforestry practices can help reduce deforestation and forest degradation | 4.25 ± 0.074 |
| 4. Community involvement in forest management can improve the sense of ownership and promote sustainable conservation practices | 4.01 ± 0.061 |
| 5. Paying for environmental services can be an effective way to encourage the preservation of forests | 3.98 ± 0.073 |
| 6. Reducing corruption in forest management can help promote sustainable forest conservation practices | 4.17 ± 0.054 |
| 7. Improving environmental education can help promote sustainable forest management practices | 4.37 ± 0.46 |
| 8. Improving agriculture land productivity can help reduce forest loss by promoting more efficient use of land | 4.26 ± 0.078 |
| 9. Removing unlawful settlers from forest areas can help restore forest resources | 3.78 ± 0.092 |
| 10. CFM can ensure sustainable forest use and thereby prevent deforestation | 4.3 ± 0.057 |
| 11. Regulating the illegal commercialization of forest products can help curb deforestation | 3.67 ± 0.095 |
| 12. Upholding and redrawing forest boundaries can help restore degraded forest diversity and forest coverage | 3.38 ± 0.096 |
| 13. Implementing zero grazing practices can help reduce deforestation and promote sustainable land use | 3.96 ± 0.059 |
Addressing deforestation requires a comprehensive approach focusing on sustainable land use [114, 115]. Improving crop yields through modern techniques—such as better seeds, efficient irrigation, soil amendments, and agroforestry—can reduce the pressure to expand farmland into forested areas. Research shows that intensive agriculture and precision farming can reduce deforestation rates [116]. Studies indicate that higher agricultural productivity reduces deforestation in Africa [117]. Improved cropland management and sustainable practices, such as crop rotation, further enhance productivity and mitigate deforestation [118, 119]. Additionally, landscape restoration boosts smallholder productivity and provides alternative livelihoods to combat deforestation [51, 120]. However, the adoption of sustainable land management in Ethiopia faces challenges related to policy, governance, financial constraints, and socioeconomic factors [121, 122].
The attitude toward the adoption of agroforestry as strategy was supported by LU/LC data, which indicated an increase in agroforestry LU/LC types during the study period. Land users in the area converted unproductive land, affected by soil acidity and fertility loss, into woodlots like eucalyptus for economic reasons [35]. Adopting agroforestry and tree planting alleviates pressure on forests by providing alternatives for timber, fodder, and fuelwood [115, 123, 124]. Studies also support the crucial role of environmental education in tackling forest degradation and promoting sustainability by empowering individuals, thereby fostering awareness and engagement in local ecological issues [125, 126]. Effective law enforcement is also essential to combat deforestation by addressing illegal activities. Research indicates that strong forest law enforcement policies significantly diminish deforestation [127].
The study revealed community support for CFM initiatives, which have the potential to reduce forest depletion [51, 115, 116. However, in Ethiopia, CFM is primarily driven by NGOs and not well integrated into government forest management frameworks [53]. Key challenges include ineffective benefit-sharing, local authority interference, unclear ownership, low participation, and weak institutions [53, 115]. Informants noted that NGO-led CFM initiatives often lack sustainability postproject due to weak community institutional foundations and a growing preference for individual ownership among PFM members.
Correlation analysis shows that various forest conservation strategies are linked to forest cover change (Table 12). Strengthening forest law enforcement correlates negatively with land grabbing, illegal logging, settlements, and corruption, highlighting its role in promoting compliance with environmental laws. Increasing agricultural productivity also correlates negatively with illegal activities and underscores the importance of resource efficiency in mitigating deforestation. Community participation significantly reduces agricultural expansion, fuelwood collection, and corruption, indicating that empowering locals helps combat deforestation. Additionally, reducing corruption is negatively related to land grabbing and settlements, while positively linked to government policy changes. Strategies that enhance environmental education show negative correlations with agricultural degradation, charcoal production, illegal settlements, and weak enforcement, suggesting that increased awareness fosters sustainable practices. These findings highlight the interconnectedness of conservation strategies and deforestation drivers, supporting the effectiveness of integrated approaches to sustainable forest management.
| Conservation option | Drivers of deforestation | ||||||||||||||
|---|---|---|---|---|---|---|---|---|---|---|---|---|---|---|---|
| Agri exp | Land grab | Fuel coll | Illeg log | Land degrd. | Char mak | Pop groz | Settle | Free graz | Inc wood | Low com | Corrup | Gov pol | Loss tra | Low for | |
| Strengthen forest law enforcement | −0.173 | −0.391 ∗∗ | −0.173 | −0.218 ∗ | 0.08 | −0.056 | 0.08 | −0.218 ∗ | 0.044 | 0.013 | 0.142 | −0.434 ∗∗ | −0.033 | 0.145 | −0.038 |
| Remove illegal settlers | 0.095 | 0.076 | 0.095 | −0.134 | −0.05 | −0.133 | 0.095 | 0.083 | −0.084 | 0.144 | 0.172 | −0.156 | 0.246 ∗∗ | 0.025 | 0.06 |
| Increase agriculture land productivity | −0.058 | −0.143 | −0.058 | −0.188 ∗ | −0.09 | −0.047 | 0.09 | −0.234 ∗∗ | 0.053 | −0.123 | −0.035 | −0.179 ∗ | 0.014 | 0.056 | −0.180 ∗ |
| Community participation | −0.192 ∗ | 0.138 | −0.192 ∗ | 0.022 | 0.008 | 0.012 | 0.184 ∗ | −0.082 | −0.052 | −0.012 | −0.143 | −0.232 ∗∗ | −0.108 | 0.181 ∗ | −0.114 |
| Corruption reduction | −0.163 | −0.293 ∗∗ | −0.163 | 0.041 | −0.032 | −0.139 | −0.032 | −0.212 ∗ | 0.064 | 0.025 | 0.039 | 0.021 | 0.273 ∗∗ | 0.207 ∗ | 0.054 |
| Control grazing | 0.00 | 0.06 | 0.00 | 0.00 | 0.00 | −0.107 | 0.00 | 0.124 | 0.056 | −0.004 | −0.060 | −0.068 | 0.032 | −0.001 | 0.009 |
| Payment for ecosystem service | 0.015 | 0.015 | 0.015 | 0.159 | 0.145 | −0.009 | −0.157 | 0.137 | 0.027 | 0.009 | 0.139 | 0.320 ∗∗ | −0.014 | −0.018 | −0.105 |
| Agroforestry expansion | −0.115 | 0.038 | −0.115 | −0.051 | 0.006 | 0.106 | −0.165 | 0.033 | 0.043 | −0.012 | 0.030 | 0.174 | 0.153 | 0.041 | 0.056 |
| Community-based forest management | −0.056 | −0.12 | −0.056 | 0.104 | −0.056 | 0.038 | 0.109 | 0.004 | −0.033 | −0.206 ∗ | 0.077 | 0.06 | −0.049 | −0.108 | 0.015 |
| Redrawing forest border | 0.054 | 0.324 ∗∗ | 0.054 | −0.093 | −0.058 | −0.082 | −0.058 | 0.114 | 0.295 ∗∗ | 0.266 ∗∗ | −0.098 | 0.038 | 0.063 | 0.165 | 0.099 |
| Environmental education | −0.068 | 0.092 | −0.068 | 0.024 | −0.178 ∗ | −0.175 | −0.068 | −0.126 | −0.011 | −0.002 | −0.002 | 0.089 | 0.029 | 0.054 | −0.125 |
| Control illegal forest product marketing | 0.107 | −0.297 ∗∗ | 0.107 | −0.266 ∗∗ | −0.091 | −0.13 | −0.004 | −0.127 | −0.073 | −0.230 ∗∗ | 0.110 | −0.127 | 0.08 | −0.141 | −0.045 |
| Afforestation and reforestation | −0.191 ∗ | 0.196 ∗ | 0.113 | −0.127 | 0.332 ∗∗ | −0.679 ∗∗ | 0.061 | 0.055 | 0.093 | 0.038 | −0.033 | 0.066 | −0.087 | 0.023 | −0.068 |
- Note: Fuel coll, fuel wood collection; land degrd, farmland degradation; land grab, forest land grabbing; low for, low forest law enforcement; inc wood, increasing wood processing industry; loss tra, loss of traditional forest conservation; low com, low community participation.
- Abbreviations: Agri Exp, agriculture expansion; Char mak, charcoal making; Corrup, corruption; Free graz, free grazing; Gov pol, government policy; Illeg log, illegal logging; Pop groz, population growth; Settle, settlement.
- ∗p < 0.05.
- ∗∗p < 0.001.
The attitude survey reveals that 59.5% of respondents strongly support forest conservation, while 40.5% show moderate to low support (Figure 7). This hesitance may arise from concerns about potential livelihood loss due to conservation measures such as relocation, boundary adjustments, and regulations on illegal commercialization, which could affect communities dependent on forest resources for their income and livelihoods. To build stronger support for conservation initiatives, it is crucial to address these concerns through inclusive dialog, involve affected communities in decision-making, and offer alternative livelihoods or compensation for those facing relocation.
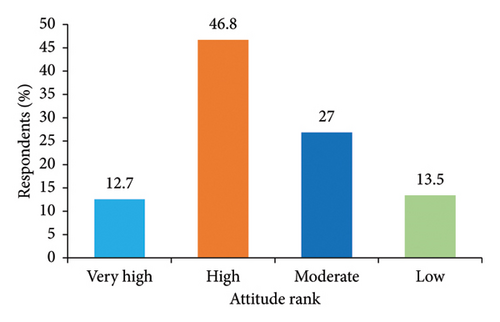
The study highlights the importance of community involvement in forest conservation. While top-down approaches have been ineffective, CFM initiatives have shown promise but are often driven by NGOs and lack sustainability. Addressing deforestation requires a comprehensive approach focusing on sustainable land use, including improving agricultural productivity, promoting agroforestry, and strengthening law enforcement.
4. Conclusion
Analyzing changes in forest ecosystems—focusing on patterns, causes, consequences, and conservation options—is crucial for understanding their dynamics and formulating effective conservation strategies. The study shows a significant decline in moist evergreen Afromontane forests, largely due to conversion to other land types, driven by 15 key factors. The top five drivers include agricultural expansion, population growth, land grabbing, fuelwood collection, and illegal logging. Perceived drivers of LU/LC changes varied among respondents from different kebeles, with notable influences from settlement, weak law enforcement, government policies, and the loss of traditional conservation methods. Socioeconomic factors such as sex, age, education, income, landholding size, and residency duration also shaped perceptions of forest cover changes. The ESV decreased from approximately US$226.75 million in 1986 to US$172.81 million in 2019, reflecting a 23.79% loss, primarily due to wetland and deforestation and forest degradation. Addressing forest cover changes and ecosystem service loss requires community insights and engagement. Historical management analyses demonstrate that top-down approaches often fail without local involvement, resulting in ongoing deforestation. While CFM shows promise but are often driven by NGOs and lack sustainability. The correlation analysis reveals that various forest conservation strategies are negatively correlated with deforestation drivers, indicating that integrated approaches can effectively mitigate deforestation and promote sustainable resource management. The study revealed that conservation strategies must address both ecological goals and the immediate socioeconomic needs of forest-dependent communities to gain their full support and involvement. To achieve sustainable conservation, enhancing community engagement and governance, along with a comprehensive policy and management plan targeting these areas, is essential for combating forest cover changes and their impacts on ecosystem services in the region.
Conflicts of Interest
The authors declare no conflicts of interest.
Funding
No funding was received for this research.
Open Research
Data Availability Statement
The data are included within the manuscript.


