A Diagnostic Biomarker Model for Chronic Fibrosis After Liver Transplantation
Abstract
Background: Liver transplantation is a critical treatment for chronic liver disease; however, rejection and chronic fibrosis of the transplanted liver remain significant challenges. Understanding the mechanisms and high-level factors contributing to these complications has garnered considerable interest.
Methods: Gene expression matrices from homozygous liver samples in the Gene Expression Omnibus database were screened for inclusion. Differentially expressed genes (DEGs) between nonfibrotic and fibrotic liver groups were identified to construct a diagnostic biomarker model using logistic regression and functional enrichment analysis. Additionally, the relationships between immune cell infiltration, fibrosis, and differential gene expression were explored through immune infiltration analysis.
Results: The gene expression matrix from frequent liver puncture biopsy samples in the GSE193135 dataset identified 11 DEGs (STMN2, JCHAIN, IGHA1, IGHG3, DCDC2, GSN, KRT7, HLA-DRB5, CRP, CXCL13, and SPINK1). These genes were utilized to construct a predictive model, achieving robust performance (area under the curve = 0.805, 95% confidence interval: 0.736–0.862). Enrichment and immune infiltration analyses further elucidated the differential gene pathways and immune cell infiltration patterns associated with liver fibrosis.
Conclusion: We developed a predictive model for identifying the risk of fibrosis in transplanted livers and investigated the role of immune cell infiltration during fibrosis progression. This model provides valuable insights for understanding and managing fibrosis in liver transplantation.
1. Introduction
Liver transplantation remains the primary treatment for advanced chronic liver disease [1, 2]. Advances in surgical techniques and immunosuppressive therapies have significantly improved short-term outcomes for patients undergoing liver transplantation. However, long-term complications, such as graft rejection and chronic fibrosis of the transplanted liver, continue to pose challenges for both clinicians and patients [3].
Liver fibrosis is a common outcome of recurrent or chronic liver damage and, in its advanced stages, progresses to cirrhosis, characterized by structural disorganization and concomitant functional impairment [4]. The development of liver fibrosis is a complex systemic pathology involving various cells and signaling molecules. Hepatocytes, activated hepatic stellate cells (HSCs), endothelial cells, and immune cells, particularly macrophages [5], play pivotal roles in liver fibrosis progression. Hepatocyte death serves as an important initial step in nearly all forms of liver disease. The resulting dead cells contribute to fibrosis and inflammation primarily through the release of intracellular compounds known as damage-associated molecular patterns (DAMPs), which influence neighboring cells, including HSCs and Kupffer cells [6]. The activation of HSCs and the subsequent secretion of extracellular matrix components—including proinflammatory mediators, fibronectin, laminin, proteoglycans, and Types I, III, and IV collagens—are central to the pathological process of liver fibrosis [7].
HSC activation is triggered by apoptotic bodies, oxidative stress, and stimulation by lipopolysaccharides [8]. Additionally, Kupffer cell infiltration and activation lead to the production of cytokines such as transforming growth factor-beta (TGF-β), which further activates HSCs [9]. TGF-β binds to its receptors and translocates to the nucleus, where it regulates HSC activation and fibrosis [10]. The recent research has explored the roles of cell signaling pathways, autophagy, and epigenetic regulation in liver fibrosis. While these findings have identified numerous potential therapeutic targets, tissue biopsy remains the gold standard for assessing liver dysfunction. Consequently, the identification of biomarkers for liver fibrosis is an important research field.
The advent of gene sequencing technologies has facilitated the discovery of differentially expressed genes (DEGs) for the prediction and diagnosis of fibrosis. This trend underscores the growing focus on elucidating the genetic underpinnings of fibrosis development following liver transplantation. In this study, we retrieved datasets related to fibrosis severity in transplanted livers from the Gene Expression Omnibus (GEO) database. By analyzing differential gene expression and investigating the roles of these genes in fibrosis through immune cell infiltration and functional enrichment analyses, we aimed to develop a robust model for predicting liver fibrosis following transplantation.
2. Methods
2.1. Datasets and Organization
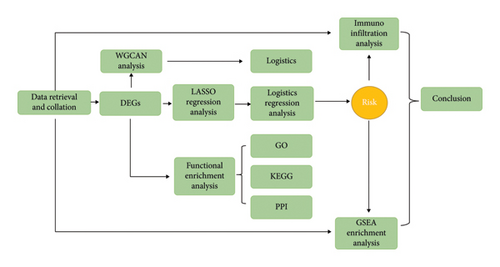
We searched the official GEO database for datasets related to liver transplantation and transcriptome sequencing of post-transplant percutaneous biopsy samples. After careful screening, the GSE193135 dataset was selected for this study. Detailed information about the GSE193135 dataset is presented in Table 1. All samples in this dataset consisted of post–liver transplantation biopsy specimens, along with transcriptome sequencing results for each sample. Based on pathological diagnoses, the samples were categorized into two groups: a liver fibrosis group and a nonfibrosis group. The complete study workflow is illustrated in Figure 1. Data processing and analysis were conducted independently by two bioinformatics experts.
| GEO no. | Platform | Species | Tissues | Nonfibrosis | Fibrosis | Total |
|---|---|---|---|---|---|---|
| GSE193135 | GPL15207 | Homo sapiens | Liver biopsy | 286 | 51 | 337 |
- Note: Madill-Thomsen K. S., Abouljoud M., Bhati C., Ciszek M. et al. The molecular phenotypes of injury, steatohepatitis, and fibrosis in liver transplant biopsies in the INTERLIVER study.
2.2. Analysis of DEGs
We identified DEGs from the dataset using the “Limma” package in R with the criteria of logFoldChange = 0.5 and adjusted p = 0.05. All statistical analyses and visualizations were performed using R software Version v.4.0.4. Limma is an R package specifically designed for analyzing gene expression microarray data. It employs linear models to evaluate differential expression in designed experiments. The package allows for comparisons among multiple RNA targets simultaneously, even in complex experimental designs. Limma also provides normalization and data analysis functions for two-color microarrays and supports linear modeling and differential expression analysis across all microarray technologies, including Affymetrix and other single-channel oligonucleotide platforms [10–12].
3. Results
3.1. Gene Ontology (GO) and Kyoto Encyclopedia of Genes and Genomes (KEGG) Analysis and Protein-Protein Interaction
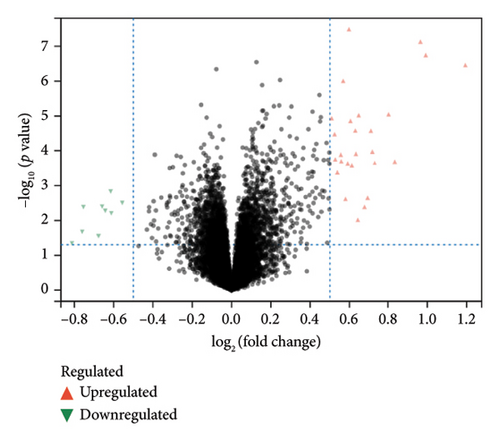
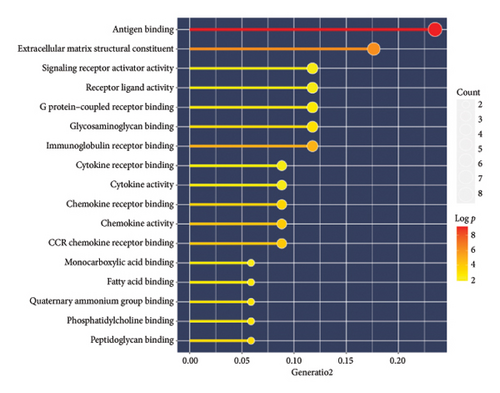
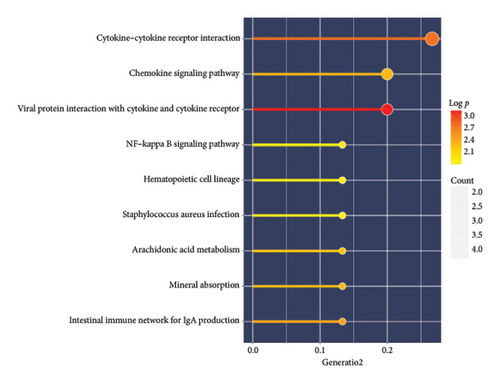
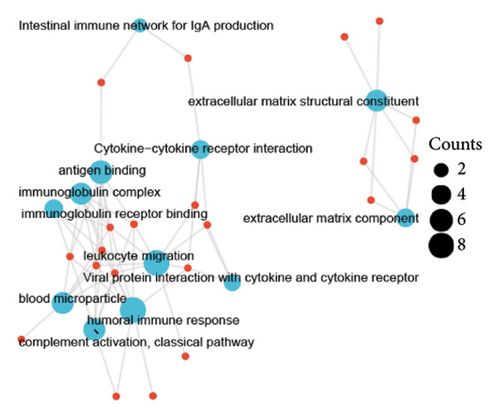
A total of 36 DEGs, including 27 upregulated and nine downregulated genes, were identified from the GSE193135 dataset using the Limma package (logFoldChange > 0.5, p > 0.05; Figure 2(a)). Functional enrichment analysis (GO and KEGG) of these DEGs was conducted using the “clusterProfiler” and “org.Hs.eg.db” packages in R. The enriched GO pathways included biological processes such as antigen binding, cytokine receptor binding, and extracellular matrix structural constituents. The enriched KEGG pathways included the cytokine-cytokine receptor interaction, viral protein interaction with cytokines and cytokine receptors, and the NF-kappa B signaling pathway. These results, shown in Figures 2(b), 2(c), and 2(d), highlight the significant association of the identified DEGs with critical pathways, including antigen binding and cytokine-cytokine receptor interaction.
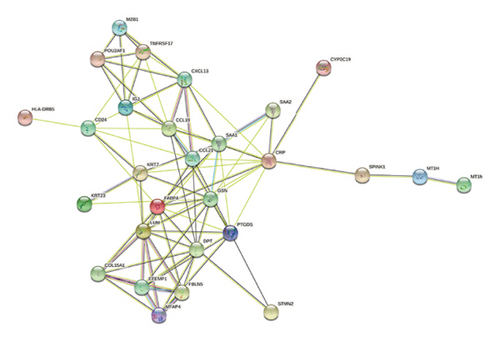
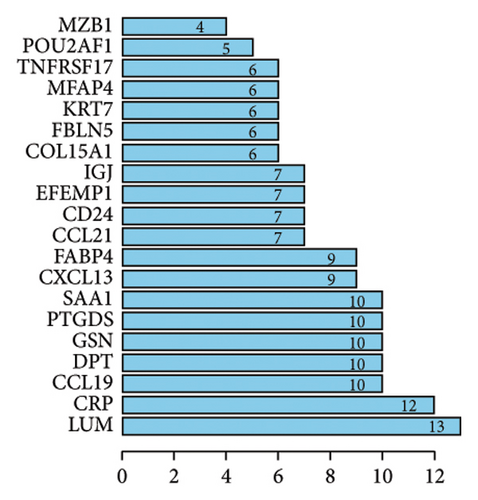
To explore the potential functional interactions between the DEGs, protein-protein interaction network analysis was performed using the STRING database (https://www.string-db.org/). Filtering criteria were applied to construct a protein-protein interaction network graph consisting of 20 nodes and 160 interaction pairs (Figures 2(e) and 2(f)). Among the proteins identified, lumican (LUM), a protein known to bind to laminin, exhibited the highest number of interactions. Other key proteins with high interaction counts included C-reactive protein (CRP), CC chemokine ligand 19 (CCL19), dermatopontin (DPT), gelsolin (GSN), prostaglandin D2 synthase (PTGDS), and serum amyloid A1 (SAA1). These results suggest that the identified DEGs may influence these proteins, which are involved in the pathogenesis of fibrosis in transplanted livers.
3.2. Construction of a Predictive Model for Transplanted Liver Fibrosis Occurrence
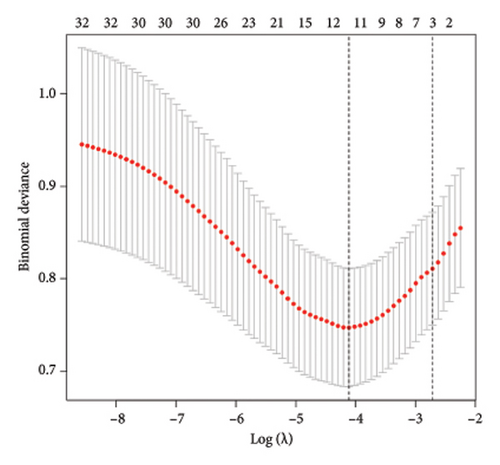
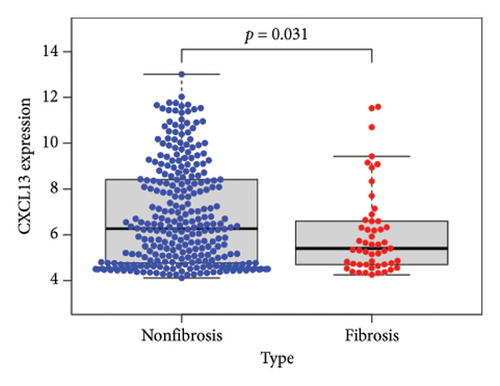
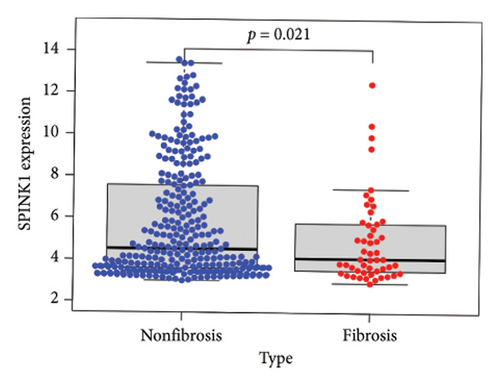
To identify DEGs associated with the occurrence of transplanted liver fibrosis, we performed least absolute shrinkage and selection operator (LASSO) regression analysis to reduce the dimensionality of all DEGs. This analysis identified 11 DEGs: STMN2, JCHAIN, IGHA1, IGHG3, DCDC2, GSN, KRT7, HLA-DRB5, CRP, CXCL13, and SPINK1. These 11 genes were used to predict fibrosis-related gene expression patterns from the 36 initial DEGs (Figures 3(a) and 3(b)). The expression levels of these genes were determined and are presented in Figures 3(c), 3(e), 3(f), 3(g), 3(h), 3(i), 3(j), 3(k), 3(l), 3(m), 3(n), and 3(o). Notably, the expressions of STMN2, JCHAIN, IGHA1, IGHG3, DCDC2, GSN, KRT7, HLA-DRB5, CRP, CXCL13, and SPINK1 were significantly higher in fibrosis tissues compared to nonfibrosis tissues.
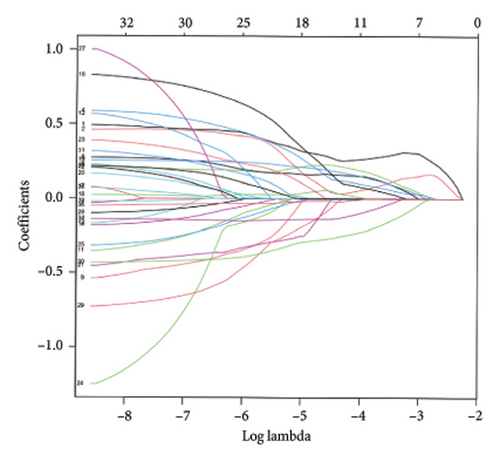
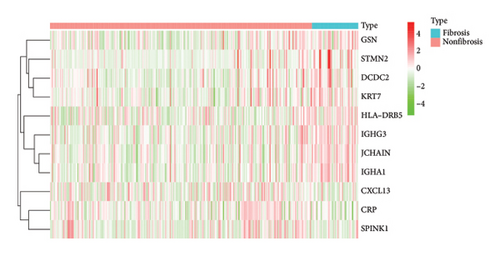
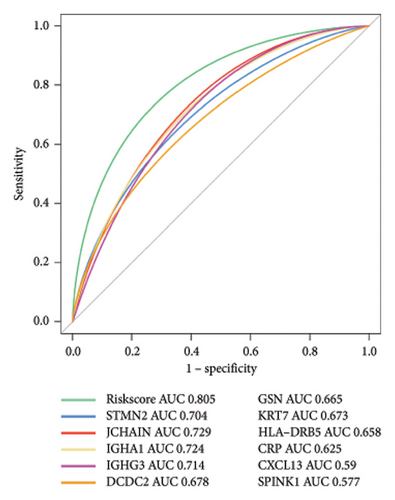
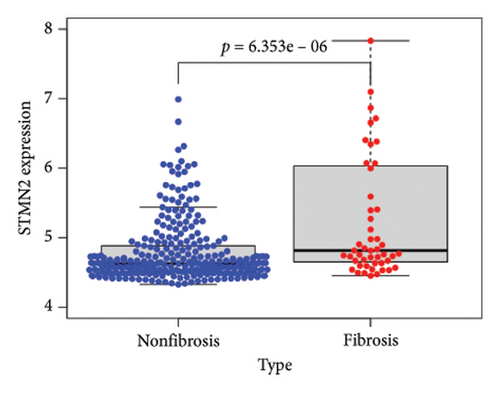
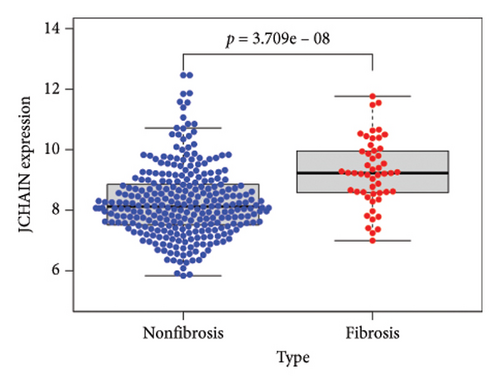
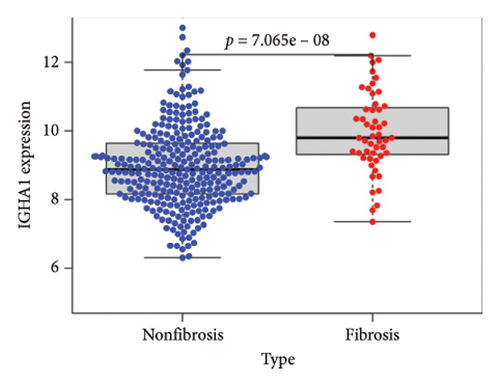
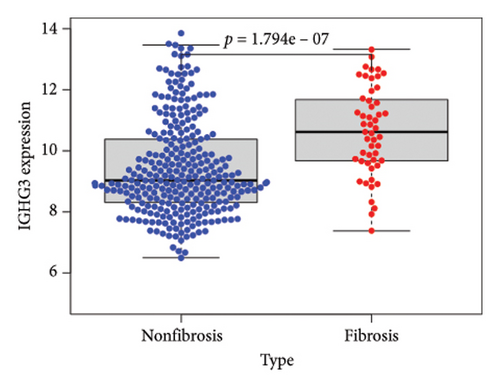
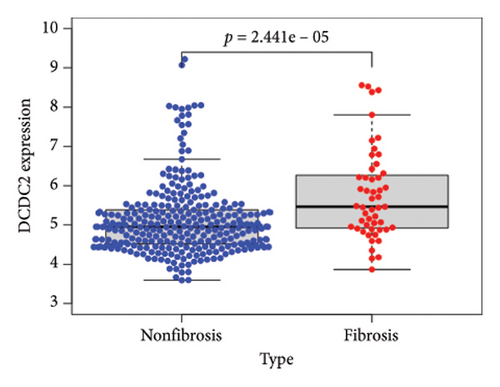
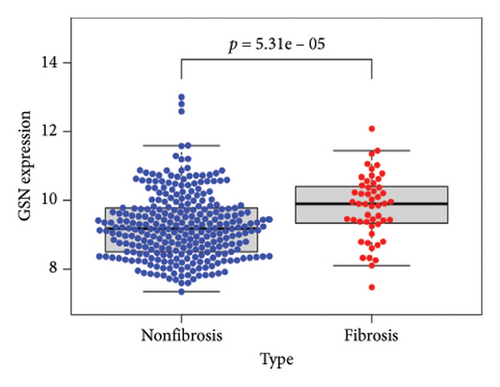
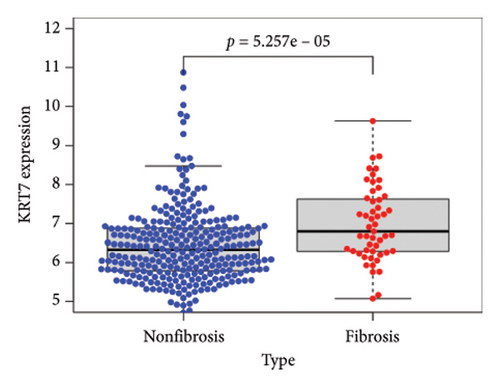
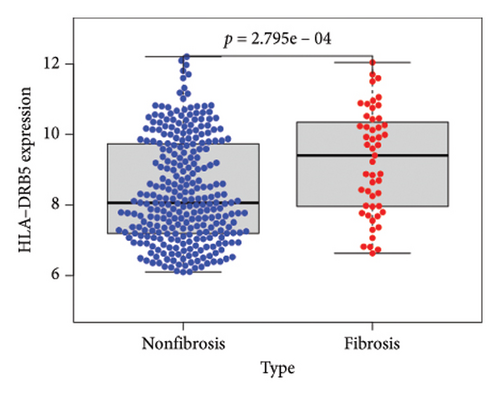
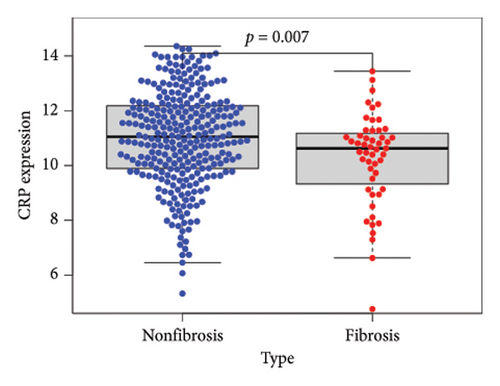
Using the pathological diagnoses of all biopsy specimens, we conducted logistic regression analysis to develop a predictive model for transplanted liver fibrosis. Risk scores were calculated for each sample, and receiver operating characteristic (ROC) curves were used to assess the model’s predictive performance. The area under the curve (AUC) values for the 11 DEGs ranged from 0.577 to 0.704 (Figure 3(d)). Combining all 11 DEGs further improved the model’s performance, achieving an AUC of 0.805. These findings suggest that the identified DEGs have strong predictive potential for the occurrence of transplanted liver fibrosis.
3.3. Gene set enrichment analysis (GSEA) Functional Enrichment and Immune Cell Infiltration Analysis
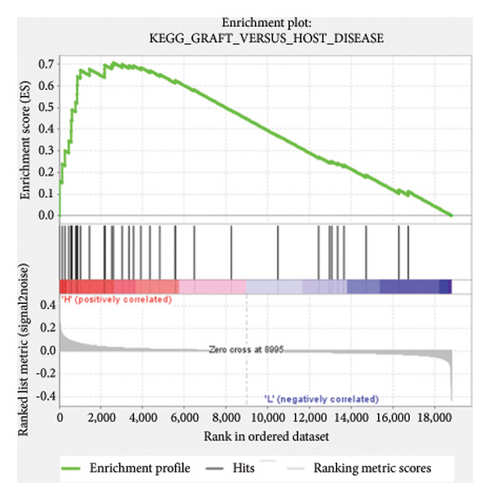
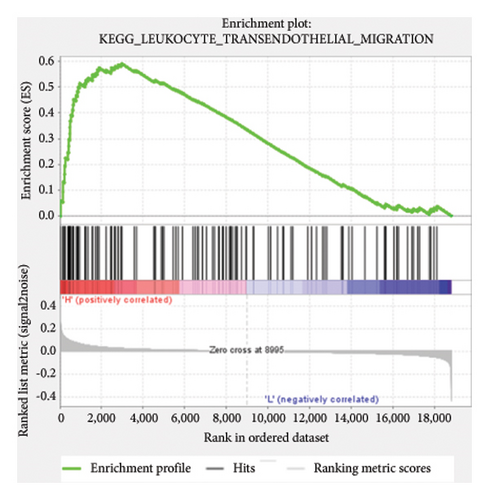
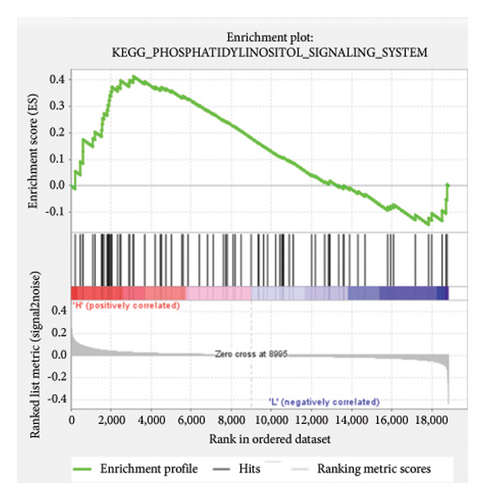
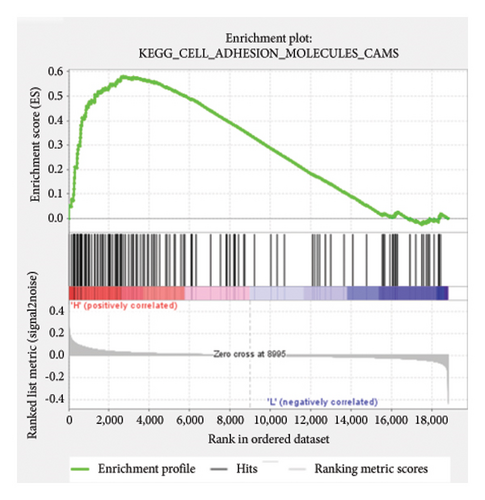
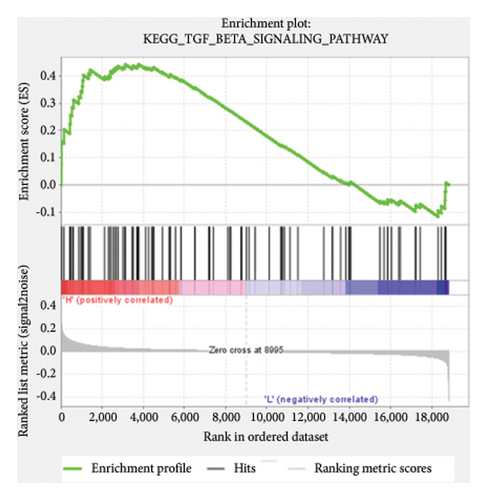
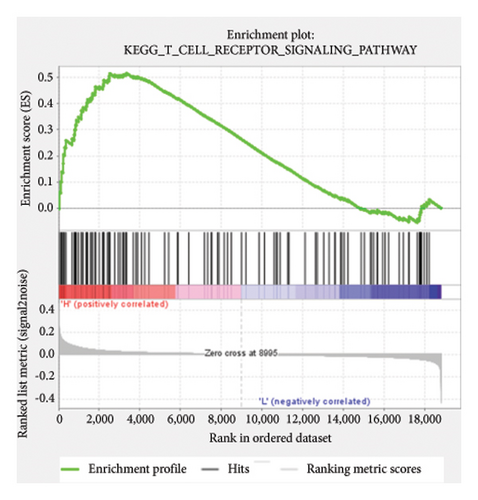
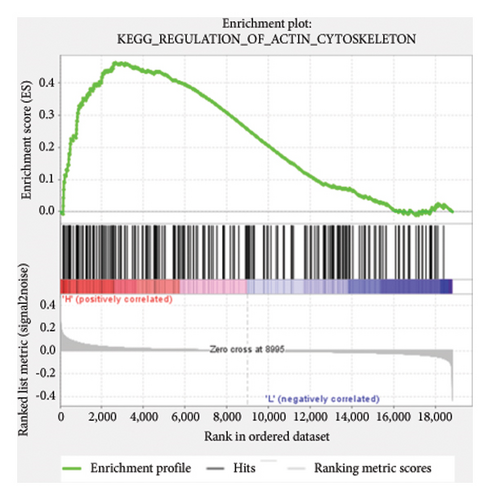
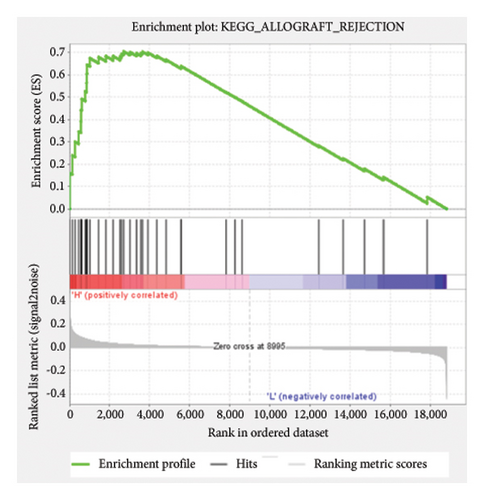
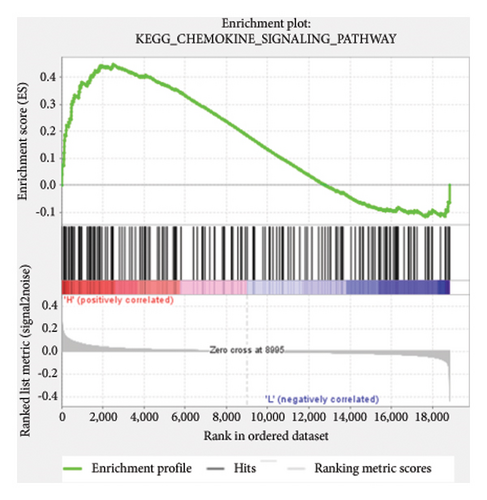
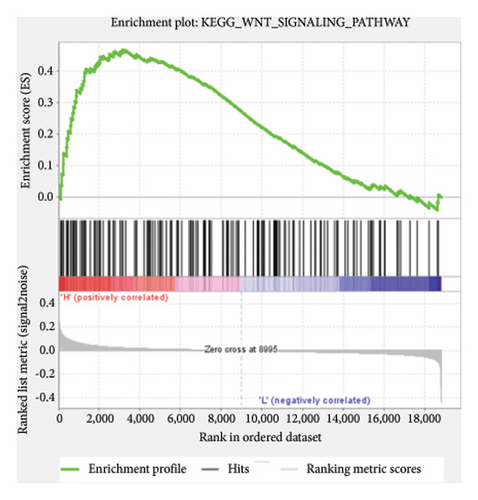
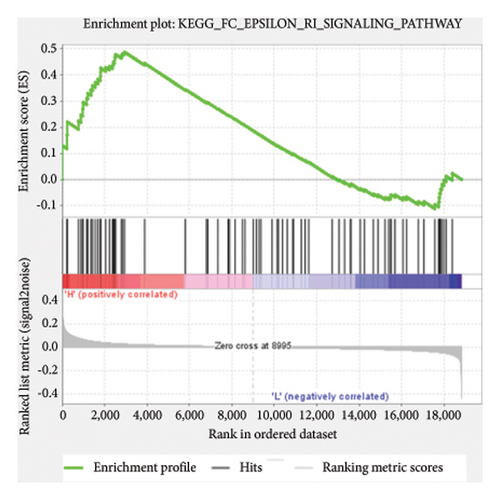
Based on the risk scores obtained from the predictive model, functional enrichment analysis was performed on the training set using GSEA (Version 4.1.0). Pathways associated with liver fibrosis were identified by comparing high- and low-risk groups. The GSEA results, presented in Figure 4 and Table 2, highlight pathways involved in liver fibrosis, including the Wnt signaling pathway, phosphatidylinositol signaling, leukocyte transendothelial migration, actin cytoskeleton regulating, cell adhesion molecules, FcεR signaling pathway, TGF-β signaling pathway, T-cell receptor signaling pathway, allograft rejection, graft-versus-host disease, cytokine-cytokine receptor interactions, and chemokine signaling pathway.

| Name | Size | ES | NES | NOM p val | FDR q-val | Rank at Max |
|---|---|---|---|---|---|---|
| KEGG_WNT_SIGNALING_PATHWAY | 148 | 0.47 | 1.67 | 0.006 | 0.167 | 3157 |
| KEGG_LEUKOCYTE_TRANSENDOTHELIAL_MIGRATION | 113 | 0.59 | 1.6 | 0.008 | 0.226 | 2973 |
| KEGG_PHOSPHATIDYLINOSITOL_SIGNALING_SYSTEM | 74 | 0.41 | 1.53 | 0.038 | 0.23 | 3124 |
| KEGG_REGULATION_OF_ACTIN_CYTOSKELETON | 207 | 0.46 | 1.52 | 0.023 | 0.236 | 2662 |
| KEGG_CELL_ADHESION_MOLECULES_CAMS | 126 | 0.58 | 1.5 | 0.046 | 0.236 | 2701 |
| KEGG_FC_EPSILON_RI_SIGNALING_PATHWAY | 77 | 0.49 | 1.48 | 0.063 | 0.23 | 2934 |
| KEGG_T_CELL_RECEPTOR_SIGNALING_PATHWAY | 106 | 0.52 | 1.43 | 0.038 | 0.283 | 3345 |
| KEGG_ALLOGRAFT_REJECTION | 35 | 0.71 | 1.31 | 0.026 | 0.369 | 2701 |
| KEGG_GRAFT_VERSUS_HOST_DISEASE | 37 | 0.71 | 1.3 | 0.014 | 0.358 | 2598 |
| KEGG_TGF_BETA_SIGNALING_PATHWAY | 85 | 0.44 | 1.26 | 0.064 | 0.417 | 3781 |
| KEGG_CYTOKINE_CYTOKINE_RECEPTOR_INTERACTION | 250 | 0.45 | 1.24 | 0.074 | 0.42 | 2701 |
| KEGG_CHEMOKINE_SIGNALING_PATHWAY | 177 | 0.45 | 1.15 | 0.098 | 0.525 | 2499 |
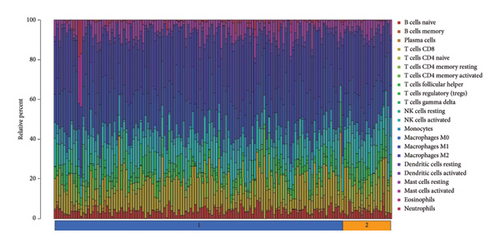
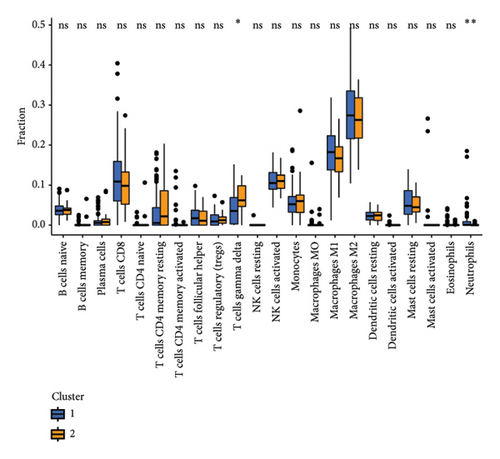
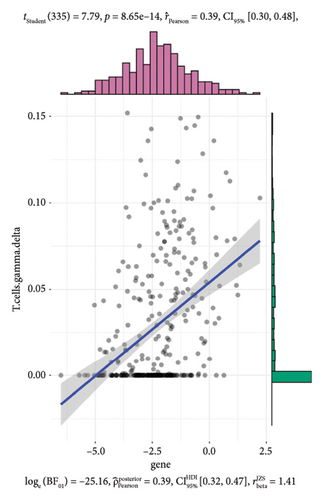
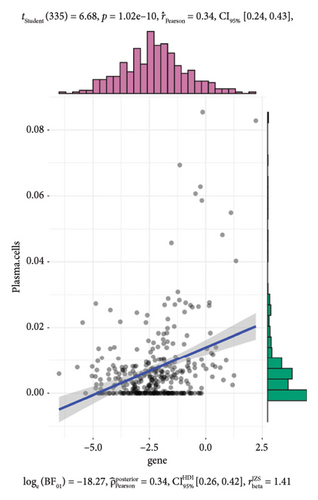
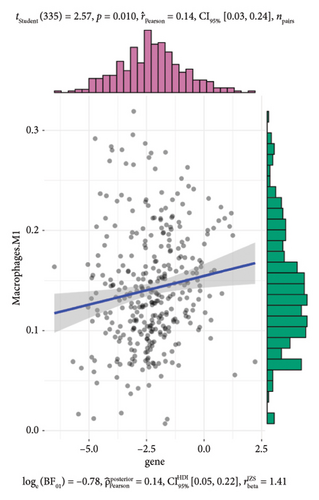
To further investigate the immune microenvironment, we applied the CIBERSORT algorithm to analyze immune cell infiltration in the biopsy samples. Combining these results with the risk scores from our predictive model, we found that T-cells and M1 macrophages were positively associated with the presence of transplanted liver fibrosis. These findings, shown in Figures 5(a), 5(b), 5(c), 5(d), 5(e), and 5(f), suggest that T-cells and M1 macrophages play important roles in the pathogenesis of transplanted liver fibrosis.

3.4. Prediction Model Verification and Immunohistochemical Detection in Liver Tissues
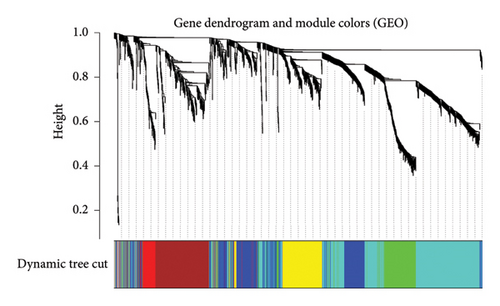
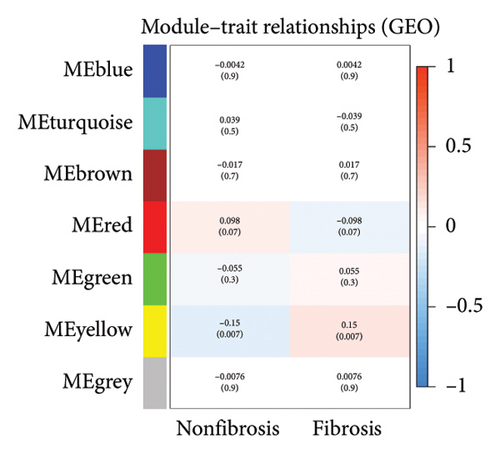
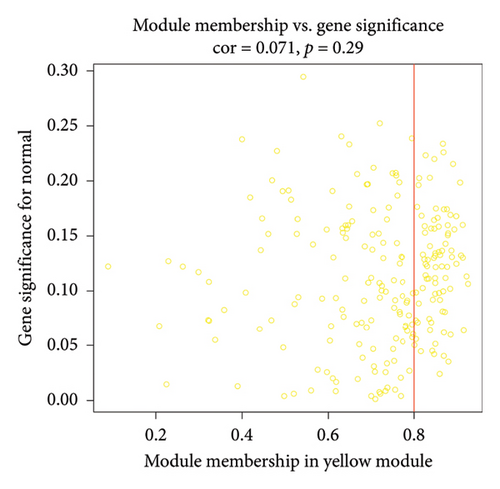
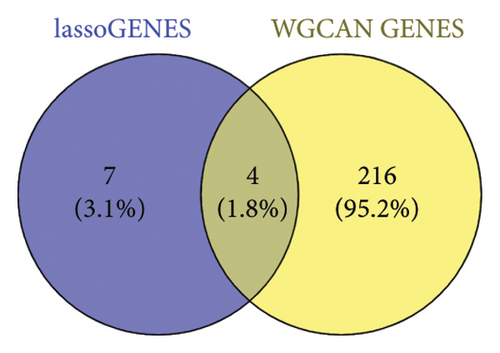
After sorting and classifying the samples in our data, we performed a weighted gene coexpression network analysis (WGCNA) to identify functional modules associated with transplanted liver fibrosis. Genes from the expression matrix were clustered into modules for further analysis. As shown in Figures 6(a), 6(b), and 6(c), the genes in the YELLOW module demonstrated the strongest correlation with transplanted liver fibrosis. To further validate the predictive power of the DEGs identified in liver transplantation-related fibrosis, we examined the intersection of genes from the YELLOW module (identified by WGCNA) with the 11 DEGs from the LASSO regression analysis. This interaction yielded four target genes: STMN2, DCDC2, GSN, and KRT7 (Figure 6(d)).
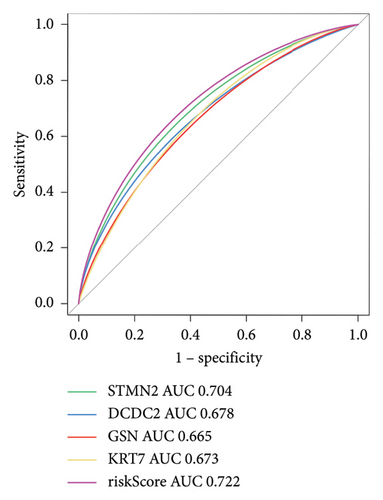
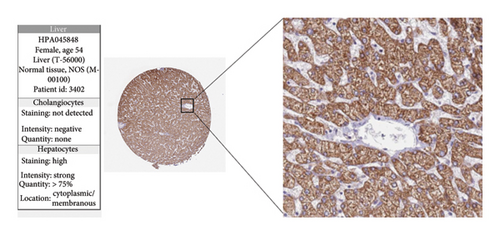
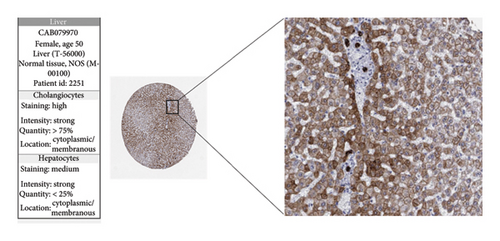
The expression levels of these four target genes were evaluated, followed by logistic regression analysis to verify their predictive validity for liver transplantation fibrosis. ROC curve analysis demonstrated that these four genes had AUC scores ranging from 0.673 to 0.704 (Figure 6(e)), indicating good predictive performance for the development of transplanted liver fibrosis. Further validation was conducted using immunohistochemistry data from the Human Protein Atlas (https://www.proteinatlas.org/), which provided images showing the expression levels of the coupregulated genes and corresponding proteins in liver tissues. As illustrated in Figures 7(a) and 7(b), the target proteins were either not expressed or expressed at low levels in normal liver tissues, indirectly demonstrating that these four genes are upregulated in liver fibrosis.
4. Discussion
Liver transplantation is one of the most effective treatments for advanced liver diseases [13]. With advancements in medical technology and the standardization of perioperative care, short-term outcomes following liver transplantation have significantly improved [14]. However, chronic inflammation and rejection remain key contributors to chronic fibrosis in transplanted livers, ultimately leading to a decline in liver function. Delaying the progression of fibrosis in transplanted livers is a shared objective among researchers worldwide [15]. Fibrosis is a hallmark of various liver diseases and serves as one of the most critical diagnostic and prognostic markers of chronic liver disease [16]. This principle is equally applicable to the postoperative evaluation of transplanted livers. Histopathological features of progressive liver disease include fibrosis, abnormal matrix deposition, and remodeling of hepatic vascular structures [17]. After liver transplantation, the recipient’s immune system mounts various rejection responses, which in the early stages, involve humoral immunity mediated by B-cells and cellular immunity mediated by T-cells, leading to liver injury [18]. Although the administration of immunosuppressive drugs allows most liver transplant recipients to overcome acute rejection, chronic inflammation and damage caused by immune rejection persist. The activation of intrahepatic immune cells plays a crucial role in the development of liver fibrosis [19]. Among immune cells, macrophages play a particularly important role. Excessive activation of M2 macrophages drives the continuous production of TGF-β and related growth factors, which promote the proliferation of myofibroblasts, epithelial-mesenchymal transition (EMT), endothelial-mesenchymal transition (EndoMT), and ECM deposition [20]. However, the specific molecular mechanisms underlying fibrosis after liver transplantation remain unclear, as does the precise role of immune cells in this process. This study analyzed publicly available data to identify DEGs associated with transplanted liver fibrosis and constructed a predictive model for the onset of fibrosis based on these DEGs.
One of the identified genes, STMN2, encodes a member of the stathmin family of phosphoproteins. This protein is known to regulate neuronal growth and is also implicated in osteogenesis [21]. Stathmin mediates hepatocyte resistance to oxidative stress by downregulating JNK signaling [22]. Additionally, stathmin functions as a key regulator of microtubules [23]. It binds to unpolymerized microtubule proteins, destabilizing microtubules by sequestering free tubulin or promoting microtubule mutations. In the liver, stathmin expression is developmentally regulated. It is present during embryogenesis, downregulated after birth, and re-expressed in hepatocytes and other cells in response to regenerative stimuli such as partial hepatectomy. Elevated stathmin levels are frequently observed in hepatocellular carcinomas and are associated with high tumor grade, vascular infiltration, and early recurrence [24].
The doublecortin domain-containing 2 (DCDC2) gene encodes a member of the doublecortin family, characterized by a structural bicortin domain. This domain is known to bind microtubule proteins and enhance microtubule polymerization. DCDC2 is believed to play a role in neuronal migration and may influence primary ciliary signaling. Studies on DCDC2 knockout mice have demonstrated multiple disruptions in memory capacity and speech processing, as well as bile duct proliferation and liver fibrosis [25, 26]. Moreover, mutations in DCDC2 disrupt Wnt signaling, leading to renal–liver ciliopathy [26]. One notable condition associated with mutations in DCDC2 is neonatal sclerosing cholangitis (NSC) [27], a severe cholestatic liver disease that often progresses to end-stage liver disease during childhood.
GSN, another gene of interest, encodes a calcium-regulated protein that binds actin monomers and caps the “positive” end of actin filament, thereby preventing monomer exchange. This protein plays a role in the assembly and disassembly of actin filaments. Mutations in GSN are linked to Finnish-type familial amyloidosis (FAF) [28]. As a member of the gliadin superfamily, GSN functions as a multistructural domain regulator of the calcium-dependent actin cytoskeleton [29]. The ability of GSN to cleave actin filaments underscores its important role in various cellular processes.
Keratin 7 (KRT7) belongs to the keratin gene family, specifically the Type II cytokeratins, which consist of basic or neutral proteins organized into heterotypic keratin chains. These keratins are coexpressed during the differentiation of simple and stratified epithelial tissues [30, 31]. KRT7 is particularly expressed in simple epithelial cells lining the lumens of internal organs, as well as in glandular ducts and blood vessels. KRT7 expression in hepatocytes has been found to significantly correlate with cholestasis type, bile duct loss, and fibrosis stage. Increased KRT7 expression is observed in patients with mild acute cholestatic hepatitis and shows a negative correlation with hepatocyte proliferation and serum transaminase levels [32]. Furthermore, KRT7-positive hepatocyte appearances are frequently observed in a various liver diseases, including viral and autoimmune hepatitis, alcoholic and nonalcoholic steatohepatitis, and cirrhosis of various etiologies [33].
The early rejection response mediated by T-cells plays an important role in the progression of liver fibrosis [34]. In this study, immune cells were positively associated with the development of fibrosis in transplanted livers. The recent research has demonstrated that inflammatory factors secreted by plasma cells can sustain the inflammatory environment of the transplanted liver, exacerbating the fibrosis process. Additionally, macrophages serve as critical regulators of liver architecture, maintain homeostasis, and contribute to disease progression. During perioperative phase of liver transplantation, macrophages respond to ischemia/reperfusion injury and interact with recipient-derived peripheral blood mononuclear cells. These interactions, along with those between macrophages and hepatocytes or T-cells, influence immune mechanisms and metabolic homeostasis [35, 36]. Further investigation into the mechanisms linking immune cells to hepatic fibrosis is necessary.
Nomenclature
-
- GEO
-
- Gene Expression Omnibus database
-
- GO
-
- Gene Ontology Analysis
-
- KEGG
-
- Kyoto Encyclopedia of Genes and Genomes
-
- GSEA
-
- Gene Set Enrichment Analysis
Conflicts of Interest
The authors declare no conflicts of interest.
Author Contributions
Concept and design: Zhihan Xiao and Lian Gu; data collection and analysis: Meicheng Pan, Yawei Qian, Junjie Zhou and Yi Liu; drafting of the manuscript: Meicheng Pan, Yawei Qian and Junjie Zhou. Critical revision of the article for important intellectual content: Meicheng Pan; study supervision: Lian Gu. All the authors contributed to the article and approved the submitted version.
Meicheng Pan, Yawei Qian, and Junjie Zhou contributed equally to this work.
Funding
This study was supported by grants from the National Natural Science Foundation of China (81802442).
Acknowledgments
The authors acknowledge the open databases of GEO.
Open Research
Data Availability Statement
The original data come from the GEO public database. The data used to support the findings of this study are available from the corresponding author upon request.


