Clinical Subtypes and Prognostic Outcomes of Rhabdomyolysis in ICU Patients
Abstract
Background: Rhabdomyolysis (RM) is a severe clinical syndrome with substantial heterogeneity that involves the rapid dissolution of skeletal muscles. The condition has a high prevalence and poor prognosis, particularly in critically ill patients. Subtypes of RM in critically ill patients have not been investigated.
Objective: The study aimed to link the clinical RM heterogeneity with distinct prognoses and associated characteristics among different subtypes using an unsupervised analysis.
Methods: Patients diagnosed with RM in the intensive care unit (ICU) from the Medical Information Mart for Intensive Care-IV (MIMIC-IV) database and the eICU Collaborative Research Database (eICU) were retrospectively enrolled. K-means clustering, guided by correlation coefficients and expert opinions in intensive care medicine, was applied to identify distinct RM clinical subtypes using routinely available parameters from the first 24 h after patient ICU admission. The primary endpoint was 28-day mortality. We assessed associations between subtypes and 28-day mortality, as well as between treatments and 28-day mortality in the derived subtypes, using multivariate Cox proportional hazards regression. The eICU database patients served as an external validation set. The SHapley Additive exPlanations (SHAPs) were used to visualize features of each clinical subtype.
Results: A total of 2269 eligible subjects were extracted from the MIMIC-IV. Two distinct subtypes were identified (A and B) using 17 readily available clinical and biological variables. Patients assigned to Subtype A (n = 511) had a higher 28-day mortality. The proportion of organ support, comorbidity index, SAPS II, and SOFA scores were all significantly higher in the Subtype A group than in the Subtype B group (n = 1836). After adjusting for relevant covariates, Subtype A patients were independently associated with increased 28-day mortality (HR [95% CI] = 1.70 [1.36–2.11], p < 0.001). These findings were further validated using an external cohort from the eICU dataset. Notably, Subtype A patients showed a higher mortality risk associated with sodium bicarbonate use (HR [95% CI] 1.62 [1.20–2.19], p = 0.002).
Conclusions: We identified two subtypes with distinct clinical features and outcomes. Subtype A is independently associated with poor outcomes and shows increased mortality risk with sodium bicarbonate use. These findings may help clinicians better distinguish prognoses and treatment responses among RM patients.
1. Introduction
Rhabdomyolysis (RM) is a pathological syndrome in which skeletal muscle cells are injured due to trauma, inflammation, ischemia, systemic toxicity, or genetic factors, affecting the integrity of the skeletal sarcolemma and releasing harmful substances into the blood [1, 2]. The prevalence of RM is high, and its prognosis is poor in critically ill patients [3, 4]. Previous studies have found that acute kidney injury (AKI) occurred in up to 37.8%–87.4% of RM patients [5–7], and the mortality of RM was as high as 37% [8].
It is widely acknowledged that RM is a clinical syndrome with large heterogeneity in epidemiology, etiology, and treatment [4]. Currently, RM is only classified based on etiology, and the patterns are not uniform. For example, Zimmerman and Shen classified RM based on the mechanism of injury into hypoxia, physical, chemical, and biological-related [9]. Other patterns have also been reported, including physical/nonphysical, exertional/nonexertional, and acquired/genetic. [10, 11]. The severity of RM can range from asymptomatic to life-threatening. The nonspecific symptoms, diverse etiologies, and complex systemic complications lead to varying prognoses and treatment responses among RM patients. Therefore, it is important to identify groups of RM patients who share similar clinical and biomarker characteristics based on their clinical parameters.
In the era of big data and precision medicine, unsupervised machine learning algorithms have gained prominence for revealing underlying structures and hidden patterns within datasets. Among these algorithms, k-means clustering stands out as a simple yet popular choice. It has been extensively utilized to categorize patients into distinct subtypes, particularly in diseases characterized by notable heterogeneity, such as sepsis and acute respiratory distress syndrome (ARDS). Each subtype has different prognostic characteristics and different responses to specific treatments [12–15]. Unfortunately, no studies targeting clinical subtypes have been conducted in RM patients.
We hypothesize that distinct RM subtypes with different clinical outcomes and biological mechanisms could be identified using available clinical and routine laboratory data and that differential treatment responses exist among these subtypes. Our aim is to identify these subtypes, analyze their prognosis and associated characteristics, and subsequently provide effective bedside approaches for risk stratification. To achieve these goals, we employed the k-means clustering method to categorize RM patients based on multiple variables. These variables were routinely collected from the Medical Information Mart for Intensive Care-IV (MIMIC-IV) database, a widely utilized public resource in critical care research [16].
2. Patients and Methods
2.1. Data Source
All relevant data were obtained from the MIMIC-IV database and the eICU Collaborative Research Database (eICU). The MIMIC database stands as the most widely utilized open-access database in critical care medicine. MIMIC-IV Version 2.0, updated on June 22, 2022, comprises comprehensive data from ICU admissions at Beth Israel Deaconess Medical Center (Boston, Massachusetts) between 2008 and 2019, complemented by out-of-hospital death records. The eICU database represents a multicenter ICU resource containing detailed, high-granularity data from over 2,00,000 ICU admissions across various eICU programs throughout the United States [17]. Our investigators who accessed the database and extracted the data have completed the National Institutes of Health’s web-based course and passed the Protecting Human Research Participants exam (Record ID: 36743986).
2.2. Study Population
Patients in the MIMIC-IV database and eICU who met the inclusion criteria were selected as subjects for the present study. The upper reference limit of normal for creatine kinase (CK) was established at 200 U/L. RM was defined as a blood CK level 5-fold greater than the upper reference limit of normal (CK > 1000 U/L) in patients with nonacute myocardial infarction or acute myocarditis during hospitalization [18]. Inclusion criteria included those [1] who met the RM definition [2] and those with a length of ICU stay of ≥ 24 h. Exclusion criteria [1] included age < 18 years or the length of ICU stay < 24 h [2] and diagnosis of acute myocardial infarction (ICD-9 code :410%, ICD-10: I21%) or acute myocarditis (ICD-9 code :422%, ICD-10: I40%). Only data from the first admission were analyzed for patients who were hospitalized multiple times.
Patients who met the criteria from the MIMIC-IV 2.2 database were designated as the discovery set. We used k-means clustering to determine clinical subtypes. The identified clinical subtypes were then used as outcome labels, and patients from the MIMIC-IV 2.2 database were randomly allocated into a training set and an internal validation set at a 7:3 ratio to develop the predictive model for clinical subtypes. Patients who met the criteria from the eICU database were utilized as the external validation set.
2.3. Study Outcomes
The primary endpoint in this study was 28-day mortality. The secondary endpoints were length of ICU stay, length of hospital, ICU mortality, in-hospital mortality, 90-day mortality, and 365-day mortality.
2.4. Data Collection and Candidate Variables for Phenotyping
All the data in this study were extracted by structured query language (SQL), including the general demographic characteristics (e.g., age, gender, and weight), laboratory parameters (e.g., hemoglobin, white blood count [WBC], platelet, CK, plasma prothrombin time [PT], activated partial thromboplastin time [APTT], and blood gas), vital signs, comorbidities (e.g., hypertension, diabetes, and Charlson comorbidity index [CCI]), severity scores (e.g., Simplified Acute Physiology Score II [SAPS II] and sequential organ failure assessment [SOFA]), organ support (vasoactive agents, mechanical ventilation and continuous renal replacement therapy [CRRT], and extracorporeal membrane oxygenation [ECMO]), and prognostic factors. Laboratory parameters with > 25% missing values were excluded from this study, and parameters with ≤ 5% missing were filled with median or mean. Multiple imputations were performed for data with 5%–25% missing values.
The final variables for performing k-means clustering were selected based on routine clinical and biological parameters within 24 h of admission. The absolute value of the correlation coefficient for continuous variables had to be < 0.5 within 24 h of admission to meet the criteria for screening variables. Variables for k-means clustering were selected based on expert consensus from two critical care physicians (Dan Zhang and Kaixiu Qin).
2.5. Statistical Analysis
All data from this study were analyzed using the STATA 16.0, Python (3.11) and R (R4.2) software. Continuous variables were expressed as mean ± standard deviation (X ± SD) or median within the interquartile range (M [IQR]), and a t-test or rank-sum test was used depending on whether the distribution was normal. Categorical variables were presented as percentages and tested using X2 tests.
The correlation analysis was performed according to the routine parameters within 24 h of ICU admission. We employed the multiple imputation by chained equations (MICE) method to handle the data with 5%–25% missing values (MICE package in R) and 17 variables were ultimately included for k-means clustering based on the correlation coefficient (“see” package and “correlation” package) and expert opinion of intensive care medicine. The subtypes of RM patients were determined based on the k-means clustering results (“cluster” package and “factoextra” package). The K value of k-means clustering was determined by the “elbow method” and “contour coefficient method.”
The subtypes identified through k-means clustering served as outcome labels, and we employed the extreme gradient boosting (XGBoost) algorithm to develop predictive models for each clinical subtype. These models were then applied to both the internal and external validation sets, followed by ROC curve plotting and AUC calculation. The SHapley Additive exPlanation (SHAP) method was implemented to analyze and interpret the prediction model. These analyses were performed using the Python Pandas library, NumPy library, Matplotlib library, XGBoost library, and SHAP library.
The characteristics of each subtype after k-means clustering were further analyzed, and the differences of each variable between subtypes were compared using a t-test or rank-sum test according to whether the distribution was normal. Multivariate Cox proportional hazards regression models were used to investigate the relationship with the 28-day mortality of RM patients. All probability values were 2-sided, and p values < 0.05 were considered statistically significant.
3. Results
3.1. Subject Characteristics
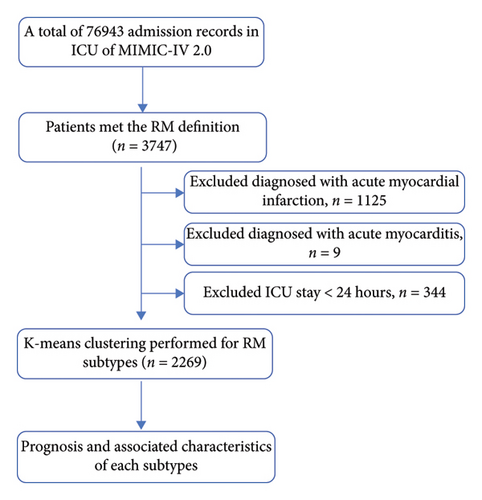
After the stepwise screening, 2269 patients were included for analysis. The patient selection process is illustrated in Figure 1. Based on 28-day mortality, patients were categorized into nonsurvival (n = 433) and survival (n = 1836) groups. The general demographic characteristics, laboratory parameters, vital signs, comorbidities, disease severity scores, and prognosis of patients in the two groups are shown in Table 1. Patients in the nonsurvival group were older and had elevated WBC, creatinine, PT, APTT, lactate, and CCI. Their SAPS II score, SOFA score, and SIRS were also significantly higher than the survival group. However, there was no statistically significant difference between the two groups in CK levels at admission and the highest CK values during hospitalization. In addition, the ICU stay was not statistically different between the two groups, but the length of hospital was statistically longer in the nonsurvival group.
| Viables | Nonsurvival group (n = 433) | Survival group (n = 1836) | H/F/χ2 | p value |
|---|---|---|---|---|
| Demographic characteristics | ||||
| Age (years) | 63.66 ± 18.17 | 56.89 ± 17.51 | 7.189 | < 0.001 |
| Male, n (%) | 280 (67.67%) | 1215 (66.18%) | 0.356 | 0.551 |
| Weight (kg) | 83.69 ± 23.45 | 88.68 ± 26.41 | −3.615 | < 0.001 |
| White, n (%) | 214 (49.42%) | 1119 (60.95%) | 19.203 | < 0.001 |
| Admission ICU | 58.256 | < 0.001 | ||
| MICU | 124 (28.64%) | 411 (22.39%) | ||
| TSICU | 81 (18.71%) | 567 (30.88%) | ||
| SICU | 54 (12.47%) | 276 (15.03%) | ||
| CVICU | 50 (11.55%) | 165 (8.97%) | ||
| CCU | 57 (13.16%) | 101 (5.50%) | ||
| M/SICU | 51 (11.78%) | 235 (12.80%) | ||
| NSICU | 16 (3.70%) | 81 (4.41%) | ||
| Laboratory parameters | ||||
| Hemoglobin (g/dL) | 11.61 ± 2.87 | 11.75 ± 2.42 | −1.129 | 0.259 |
| WBC (× 109/L) | 13.8 (9.6–19.5) | 12.5 (9.0–17.0) | 3.106 | 0.002 |
| Platelet (× 109/L) | 206.99 ± 114.15 | 223.73 ± 106.33 | −2.905 | 0.004 |
| RDW (%) | 15.16 ± 2.47 | 14.44 ± 1.91 | 6.675 | < 0.001 |
| Creatinine (mg/dL) | 1.4 (1.0–2.3) | 1.1 (0.8–1.7) | 8.297 | < 0.001 |
| BUN (mg/dL) | 26.0 (17.0–43.0) | 19.0 (13.0–30.0) | 7.927 | < 0.001 |
| PT (S) | 14.7 (12.9–18.7) | 13.2 (12.0–15.0) | 9.171 | < 0.001 |
| APTT (S) | 33.5 (27.9–47.4) | 28.8 (25.6–34.7) | 9.811 | < 0.001 |
| INR | 1.3 (1.1–1.7) | 1.2 (1.1–1.4) | 9.030 | < 0.001 |
| AST (U/L) | 138.5 (57.5–455) | 83 (44–197) | 6.625 | < 0.001 |
| CK (U/L) | 1493 .0 (756.0–3148.0) | 1493.0 (910.0–3283.0) | −0.760 | 0.447 |
| CK max (U/L) | 2494 .0 (1423.0–5967.0) | 2460.0 (1456.0–5831.0) | −0.314 | 0.759 |
| Potassium (mmol/L) | 4.61 ± 1.19 | 4.38 ± 0.93 | 4.309 | < 0.001 |
| Sodium (mmol/L) | 139.47 ± 6.35 | 138.89 ± 5.97 | 3.475 | < 0.001 |
| Chloride (mmol/L) | 103.92 ± 7.86 | 103.38 ± 7.29 | 1.346 | 0.179 |
| Calcium (mg/dL) | 8.00 ± 1.10 | 8.17 ± 0.97 | −3.221 | 0.001 |
| Glucose (mg/dL) | 152 .0 (115.0–214.0) | 134.0 (109.0–169.0) | 5.393 | < 0.001 |
| Blood gas | ||||
| pH | 7.28 ± 0.14 | 7.33 ± 0.11 | −8.019 | < 0.001 |
| PaO2 (mmHg) | 100 (61–201) | 115 (72–205) | −2.073 | 0.038 |
| PaCO2 (mmHg) | 42.23 ± 14.95 | 44.07 ± 12.53 | −2.529 | 0.012 |
| Anion gap (mmol/L) | 20.49 ± 7.26 | 16.56 ± 5.62 | 12.335 | < 0.001 |
| Bicarbonate (mmol/L) | 18.67 ± 5.61 | 21.92 ± 4.88 | −12.104 | < 0.001 |
| Lactate (mmol/L) | 2.9 (1.8–5.9) | 1.7 (1.2–2.7) | 12.211 | < 0.001 |
| Vital signs | ||||
| Heart rate (beats/minute) | 95.79 ± 22.02 | 94.08 ± 20.87 | 1.5118 | 0.131 |
| Respiratory rate (beats/minute) | 21.78 ± 6.22 | 20.08 ± 6.03 | 5.2320 | < 0.001 |
| Temperature (°C) | 36.29 ± 1.55 | 36.86 ± 0.94 | −9.824 | < 0.001 |
| MBP (mmHg) | 83.12 ± 22.07 | 86.02 ± 19.84 | −2.676 | 0.008 |
| SPO2 (%) | 95.73 ± 6.72 | 96.99 ± 4.23 | −4.907 | < 0.001 |
| Comorbidities, n (%) | ||||
| COPD | 173 (39.95%) | 740 (40.31%) | 0.018 | 0.893 |
| Congestive heart failure | 34 (9.01%) | 106 (5.77%) | 2.615 | 0.106 |
| Diabetes | 104 (24.02%) | 477 (25.98%) | 0.708 | 0.400 |
| Hypertension | 22 (5.08%) | 80 (4.36%) | 0.427 | 0.513 |
| CCI | 6 (3–8) | 4 (2–6) | 7.752 | < 0.001 |
| Severity scoring systems | ||||
| SAPS II | 86.60 ± 31.13 | 52.79 ± 25.04 | 24.050 | < 0.001 |
| SOFA | 11.0 (7.0–14.0) | 5.0 (3.0–8.0) | 18.166 | < 0.001 |
| Treatment | ||||
| Furosemide, n (%) | 45 (10.39%) | 175 (9.43%) | 0.296 | 0.586 |
| Sodium bicarbonate, n (%) | 151 (34.87%) | 219 (11.80%) | 135.157 | < 0.001 |
| Total of 24 h infusion (L) | 6.40 (3.55–11.27) | 4.97 (2.77–8.34) | 5.236 | < 0.001 |
| Outcome | ||||
| Length of ICU (days) | 3.66 (2.00–7.08) | 3.29 (1.95–7.22) | 0.357 | 0.721 |
| Length of hospital stay (days) | 4.83 (2.33–10.58) | 10.41 (6.50–19.12) | −15.722 | < 0.001 |
- Note: PaO2, arterial partial pressure of oxygen; PaCO2, arterial partial pressure of carbon dioxide; SPO2: peripheral capillary oxygen saturation.
- Abbreviations: CCU, coronary care unit; COPD, chronic obstructive pulmonary disease; CVICU, cardiac vascular intensive care unit; MICU, medical intensive care unit; M/SICU, medical/surgical intensive care unit; NSICU, neurosurgical intensive care unit; S, seconds; SICU, surgical intensive care unit; TSICU, trauma surgical intensive care unit.
3.2. Identification of RM Subtypes Based on k-Means Clustering
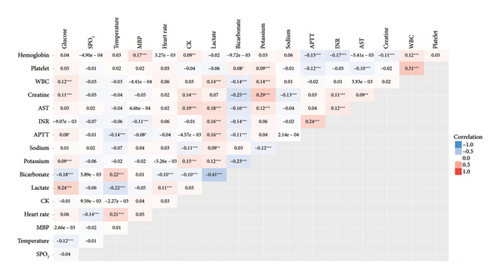
K-means clustering and heat map plots were performed according to the clinical and laboratory parameters within 24 h of admission, and 17 variables were eventually selected for k-means clustering. The absolute values of correlation coefficients between each parameter were < 0.5 (Figure 2).
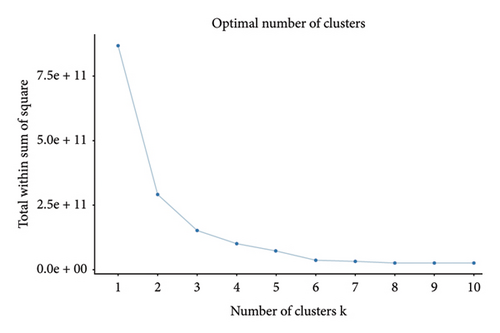
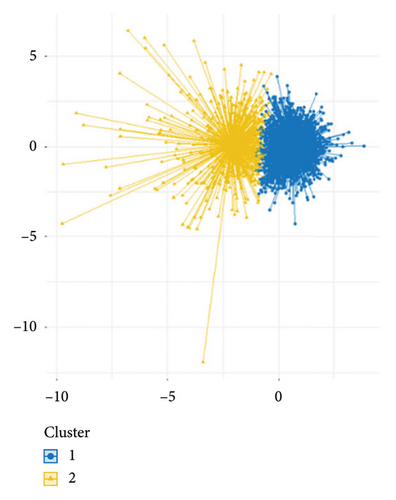
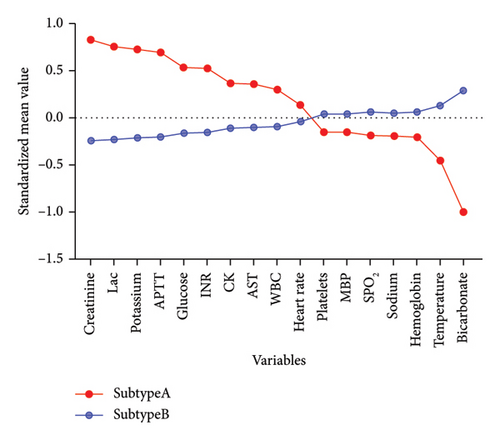
In this study, the optimal k value was determined as “2” using the “contour coefficient method” and “elbow method” (Figures 3(a) and 3(b)), which meant that RM patients could be clustered into 2 subtypes by the k-means method. Among them, 511 patients (22.52%) were classified into Subtype A and 1758 patients (77.48%) into Subtype B (Figure 3(c)). After normalizing the clustering variables, Subtype A patients showed higher creatinine, lactate, potassium (K+), APTT, international normalized ratio (INR), CK, aspartate aminotransferase (AST), and WBC than Subtype B. Subtype A patients had more rapid heart rate at admission, while their platelets count, hemoglobin, bicarbonate levels, sodium ion levels, mean blood pressure (MBP), blood glucose, and peripheral capillary oxygen saturation (SPO2) were lower than Subtype B patients (Figure 3(d)).

3.3. Clinical Characteristics of Different Subtypes of RM
The clinical characteristics of different subtypes after k-means clustering were further analyzed (Table 2). There was no statistically significant difference in age, gender, and weight between Subtypes A and B, but the CCI was higher in Subtype A than in Subtype B. In terms of severity score, the SAPS II and SOFA scores were higher in the Subtype A group than in Subtype B. The proportion of organ support was also significantly higher in Subtype A than in Subtype B.
| Variables | Subtype A (n = 511) | Subtype B (n = 1758) | H/F/χ2 | p value |
|---|---|---|---|---|
| Demographic characteristics | ||||
| Age (years) | 57.77 ± 17.67 | 58.30 ± 17.88 | −0.588 | 0.557 |
| Male, n (%) | 344 (67.32%) | 1151 (65.47%) | 0.601 | 0.438 |
| Weight (kg) | 89.51 ± 26.13 | 87.21 ± 25.87 | 1.759 | 0.079 |
| Comorbidities, n (%) | ||||
| COPD | 25 (4.89%) | 77 (4.38%) | 0.242 | 0.623 |
| Congestive heart failure | 34 (6.65%) | 106 (6.03%) | 0.266 | 0.606 |
| Diabetes | 165 (32.29%) | 416 (23.66%) | 15.466 | < 0.001 |
| Hypertension | 159 (31.12%) | 754 (42.89) | 22.825 | < 0.001 |
| CCI | 5 (3–7) | 4 (2–6) | 3.981 | < 0.001 |
| Severity scoring systems | ||||
| SAPS II | 83.19 ± 31.05 | 52.28 ± 25.01 | 23.209 | < 0.001 |
| SOFA | 11 (7–14) | 5 (3–8) | 20.629 | < 0.001 |
| Organ support, n (%) | ||||
| Vasoactive agents | 357 (69.86%) | 669 (38.05%) | 161.711 | < 0.001 |
| Mechanical ventilation | 370 (72.41%) | 983 (55.92%) | 44.729 | < 0.001 |
| CRRT | 147 (28.77%) | 105 (5.97%) | 208.365 | < 0.001 |
| ECMO | 18 (3.52%) | 11 (0.63%) | 26.331 | < 0.001 |
| Treatment | ||||
| Furosemide, n (%) | 62 (12.13%) | 158 (8.99%) | 4.474 | < 0.001 |
| Sodium bicarbonate, n (%) | 202 (39.53%) | 168 (9.56%) | 260.637 | < 0.001 |
| Total of 24 h infusion (L) | 7.23 (3.71–13.23) | 4.82 (2.77–7.92) | 7.874 | < 0.001 |
| Outcome | ||||
| AKI, n (%) | 466 (91.19%) | 1390 (79.07%) | 39.104 | < 0.001 |
| Length of ICU (days) | 4.12 (2.16–8.87) | 3.16 (1.91–6.75) | 3.805 | < 0.001 |
| Length of hospital stay (days) | 9.62 (4.16–18.75) | 9.31 (5.95–16.83) | 1.280 | 0.201 |
| ICU mortality, n (%) | 178 (34.83%) | 177 (10.07%) | 183.990 | < 0.001 |
| In-hospital mortality, n (%) | 195 (38.16%) | 203 (11.55%) | 193.871 | < 0.001 |
| 180-day mortality, n (%) | 228 (44.62%) | 298 (16.95%) | 170.187 | < 0.001 |
| 365-day mortality, n (%) | 254 (49.71%) | 403 (22.92%) | 138.055 | < 0.001 |
- Note: Vasoactive agents included noradrenaline, vasopressin, phenylephrine, epinephrine, and dopamine.
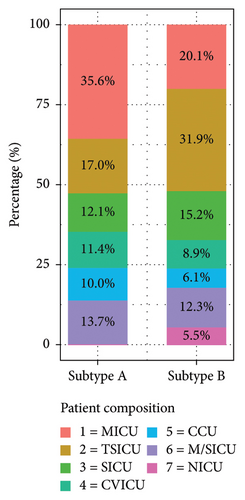
To further investigate the clinical characteristics of different subtypes, the distribution of patients among RM subtypes was analyzed. In Subtype A, the majority of patients were from the medical intensive care unit (MICU) (35.6%), followed by trauma surgical ICU (TSICU) (17.0%), medical/surgical ICU (M/SICU) (13.7%), SICU (12.1%), cardiac vascular ICU (CVICU) (11.4%), and coronary care unit (CCU) (10.0%) (Figure 4).
3.4. Association Between RM Subtypes and Outcomes
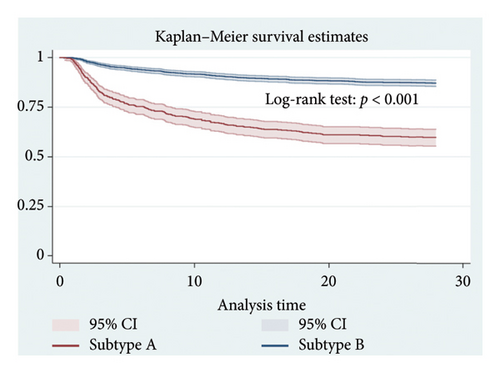
The 28-day mortality was 40.31% (206/511) in the Subtype A group and 12.91% (227/1758) in the Subtype B group. By plotting Kaplan–Meier curves for 28 days, the prognosis of the subtype A group was worse than that of the subtype B group, and the log-rank test revealed a statistically significant difference (p < 0.001) (Figure 5). The length of ICU stay in the Subtype A group was significantly longer than in the Subtype B group. ICU mortality, in-hospital mortality, 180-day mortality, and 365-day mortality were all significantly higher in the Subtype A group than in the Subtype B group. However, the length of hospital stay was not statistically different between the two groups (Table 2).
We analyzed the association between RM subtypes and 28-day mortality through a Cox proportional hazards regression model. Using Subtype B as a reference, Model I was not adjusted for other parameters. Model II was adjusted for general demographic parameters, including gender and age and weight and race. Model III was adjusted for admission ICU, CCI, SOFA score, SAPS II score, organ support, and treatment based on Model II. The results showed that patients in the Subtype A group had a significantly increased risk of 28-day mortality. Specifically, the risk of death in the Subtype A group was 3.82 times that of Subtype B in Model I and 1.70 times that of Subtype B in Model III after adjusting for multiple covariates, and the differences were statistically significant (Table 3).
| Model I | Model II | Model III | ||||
|---|---|---|---|---|---|---|
| HR (95% CI) | p value | HR (95% CI) | p value | HR (95% CI) | p value | |
| Subtype A | 3.82 (3.16–4.61) | < 0.001 | 3.91 (3.24–4.73) | < 0.001 | 1.61 (1.26–2.05) | < 0.001 |
| Subtype B | Reference | Reference | Reference | Reference | Reference | Reference |
- Note: Models were derived from Cox proportional hazards regression models. Model I adjusted for none. Model II adjusted for age, weight, race, and gender. Model III adjusted for age, weight, race, gender, admission ICU, ventilation, CRRT, ECMO, furosemide, sodium bicarbonate, total of 24 h infusion, CCI, SOFA score, and SAPS II score.
- Abbreviations: CI, confidence interval; HR, hazard ratio.
3.5. Evaluation of Treatment Effects in RM Subtypes
We employed a multifactorial Cox proportional hazards regression model to assess treatment responses across different RM subtypes. The analysis showed that furosemide administration reduced 28-day mortality risk in both Subtype A and B patients. No significant correlation was found between 24-h intravenous fluid intake and 28-day mortality risk. Importantly, our analysis revealed that sodium bicarbonate use was associated with increased mortality risk specifically in Subtype A patients (HR [95% CI] 1.62 [1.20–2.19], p = 0.002) (Table 4).
| All patients | Subtype A | Subtype B | ||||
|---|---|---|---|---|---|---|
| HR (95% CI) | p value | HR (95% CI) | p value | HR (95% CI) | p value | |
| Furosemide | 0.59 (0.42–0.82) | 0.002 | 0.48 (0.28–0.81) | 0.007 | 0.52 (0.34–0.81) | 0.003 |
| Sodium bicarbonate | 1.52 (1.21–1.93) | < 0.001 | 1.62 (1.20–2.19) | 0.002 | 1.44 (0.99–2.11) | 0.055 |
| Total of 24 h infusion | 0.99 (0.98–1.01) | 0.358 | 1.00 (0.99–1.02) | 0.853 | 0.99 (0.97–1.01) | 0.224 |
- Note: Furosemide vs. no use furosemide: adjusted for age, weight, race, gender, admission ICU, ventilation, CRRT, ECMO, sodium bicarbonate, total of 24 h infusion, CCI, SOFA score, and SAPS II score. Sodium bicarbonate vs. no use sodium bicarbonate: adjusted for age, weight, race, gender, admission ICU, ventilation, CRRT, ECMO, furosemide, total of 24 h infusion, CCI, SOFA score, and SAPS II score. Total of 24 h infusion: adjusted for age, weight, race, gender, admission ICU, ventilation, CRRT, ECMO, furosemide, sodium bicarbonate, CCI, SOFA score, and SAPS II score.
3.5.1. Validation of RM Subtypes
The external validation set comprised 1719 patients from the eICU database, with the study flowchart presented in Supporting Figure 1. Following the identification of RM subtypes through k-means clustering, we developed predictive models for each clinical subtype using XGBoost in the training set. The ROC curves for the internal validation set demonstrated an AUC of 0.98 (Supporting Figure 2). Using these models, RM patients in the eICU database were classified into Subtypes A and B. Supporting Table 1 details the comparison of general demographic characteristics, laboratory parameters, vital signs, comorbidities, and prognosis between the two subtypes. The 28-day mortality rates were 29.17% for Subtype A and 18.11% for Subtype B, showing a statistically significant difference through the log-rank test as illustrated in the 28-day Kaplan–Meier plot (Supporting Figure 3). The SHAP analysis revealed that the five most influential features in the prediction model were bicarbonate, creatinine, APTT, K+, and lactate (Supporting Figure 4).
4. Discussion
RM presents with high incidence and heterogeneous manifestations in critically ill patients [3]. In this study, k-means clustering of 17 routinely monitored laboratory parameters within 24 h of ICU admission revealed two subtypes of RM in critically ill patients. Patients in Subtype A had a higher 28-day mortality. The proportion of organ support, comorbidity index, and SAPS II and SOFA scores were significantly higher than those in Subtype B. After adjusting for relevant covariates, Subtype A patients were independently associated with increased 28-day mortality. The incidence of AKI, ICU stay, ICU mortality, in-hospital mortality, 180-day mortality, and 365-day mortality was also significantly higher in the Subtype A group than in the Subtype B group.
Supervised machine learning has been used to predict mortality in critically ill RM patients [19]. Using Lasso regression, a prior study developed a predictive model for the need for renal replacement therapy in RM patients [20]. However, there are currently no reports on the classification of clinical parameters by unsupervised learning, which can identify similar patients in heterogeneous populations. K-means clustering is a commonly used method in unsupervised learning and has been extensively applied in the critically ill patients [21–24]. This study identified patients with the worst prognosis by dividing RM patients into different subtypes. Our results demonstrated the application of k-means clustering in identifying the subtypes of RM patients and predicting prognosis and differential response of treatment in specific subtype populations.
Our findings revealed two subtypes of RM in critically ill patients. Subtype A patients had higher Cr, lactate, K+, APTT, INR, CK, AST, and WBC levels; more rapid heart rate at admission; lower platelet count, hemoglobin, bicarbonate, sodium, MBP, blood glucose, and SPO2; and worse prognosis than Subtype B patients. Understanding the pathophysiological mechanisms underlying the clinical subtypes of RM can help identify the essence of the disease.
CK, produced during skeletal muscle cell damage, serves as the most specific diagnostic indicator for RM and represents a key marker of myocyte membrane destruction [18, 25], and CK levels are positively correlated with serum creatinine. Moreover, increased CK levels are generally associated with increased mortality in patients with RM-related renal injury [26, 27], consistent with our findings. Elevated WBC indicates a more severe inflammatory response, while elevated lactate could indicate the presence of acidosis, which is common in RM patients due to severe muscle injury. On the other hand, elevated lactate is a marker of abnormal microcirculation, reflecting tissue hypoperfusion and cellular hypoxia. Lactate has been identified as a sensitive predictor for the prognosis of sepsis and critically ill patients [28].
In terms of organ function, we found that Subtype A patients had higher creatinine and more prolonged APTT and INR, decreased platelets, and increased AST, indicating more severe organ injury. In terms of vital signs, Subtype A patients had more rapid heart rates and lower MAP, suggesting that the body might not have enough effective circulating volume. Many body fluids enter the interstitial space during RM due to tissue ischemia, edema, increased vascular permeability, or combined vascular injury; therefore, it has become an important indicator of poor prognosis for RM patients.
In terms of metabolism, this study found that Subtype A patients had elevated blood glucose, high K+ levels, and low sodium levels, which was common in critically ill patients. Excessive blood glucose may lead to immunosuppression and oxidative stress, which could lead to a poor prognosis for RM patients [29, 30]. Electrolyte disturbances in patients with RM are the result of the breaking down of skeletal muscle cells and releasing electrolytes into the blood. Cellular K+ is released into the blood and accumulates, which cannot be excreted due to oliguria or anuria, resulting in hyperkalemia and arrhythmia during RM, further worsening the prognosis [9, 31, 32]. Therefore, Subtype A patients exhibited more severe muscle tissue damage, more severe inflammatory response and oxidative stress, and more complex metabolic disturbances. Collectively, the clinical outcome of Subtype A patients was worse than that of Subtype B.
We identified distinct clinical subtypes of RM patients using data from the MIMIC-IV database. Subtype A and Subtype B patients exhibited different prognoses. By considering these subtypes, clinicians can provide more accurate prognostic information to patients and their families, leading to more informed decisions about treatment and care plans. We found that Subtype A patients had a worse prognosis, and identifying the high-risk subtype can help prioritize interventions and allocate resources to those who need them the most.
Currently, RM is typically categorized into traumatic and nontraumatic causes. Among the nontraumatic causes, infections are the most frequently observed. This study revealed notable differences in patient composition between Subtype A and Subtype B. Subtype A predominantly comprised patients from the MICU, while Subtype B was primarily composed of patients from the TSICU. We found that trauma-related RM is more likely to be Subtype B, while nontrauma-related RM is more likely to be Subtype A. Moreover, nontrauma-related RM was associated with a worse prognosis compared to traumatic-related RM. This observation aligned with the findings of Baeza-Trinidad et al. [27], who also reported that patients with infection-related RM exhibited the highest mortality.
The identification of distinct RM subtypes represents a crucial step toward personalized medicine, potentially enhancing both risk stratification and treatment decision-making. Currently, there is limited clinical evidence supporting the use of urinary alkalinization through sodium bicarbonate infusion for improving prognosis [33]. Our findings revealed an increased mortality risk associated with sodium bicarbonate administration in Subtype A patients. The underlying mechanism likely relates to these patients’ severe organ damage and electrolyte imbalances, where excessive sodium bicarbonate administration can cause a leftward shift in the oxygen dissociation curve, thereby reducing tissue oxygen availability [34]. In addition, sodium bicarbonate use can lead to decreased ionized calcium levels, potentially resulting in diminished cardiac contractility and hypotension. Based on these findings, we recommend avoiding sodium bicarbonate for urinary alkalinization in Subtype A patients, except in cases complicated by severe acidosis.
The present study had some limitations. First, given the complexity of the etiology of RM, it might not be sufficient to employ a limited number of variables to identify all the subtypes. Moreover, due to the retrospective nature of this study, there may have been some missing data. Second, this study only collected baseline data within 24 h after ICU admission and did not include dynamic changes in relevant parameters, which limited the dynamic classification of RM subtypes. Further validation studies are needed to confirm these RM subtypes.
5. Conclusions
This study investigated potential subtypes of RM using a classification method based on routinely available clinical data and discovered that critically ill RM patients could be divided into Subtypes A and B. Subtype A patients showed higher creatinine, lactic acid, K+ ion, APTT, INR, CK, AST, and WBC; more rapid heart rate at admission; lower platelet count, hemoglobin, bicarbonate levels, sodium ion levels, MBP, blood glucose, and SPO2; and worse prognosis than Subtype B patients. Our findings could aid in distinguishing the different prognoses of RM patients and their diverse responses to treatment. However, this RM classification requires further external validation before it can be applied in clinical settings.
Conflicts of Interest
The authors declare no conflicts of interest.
Author Contributions
Study design was conducted by Dan Zhang and Kaixiu Qin. Shan Xu performed statistical analysis, data interpretation, and drafted the manuscript. Dan Zhang revised the final version.
Funding
All authors received no funding in this study. The present study was not supported by any fund.
Acknowledgments
We would like to express our deepest gratitude to our colleagues from both the Emergency Department of The Second Affiliated Hospital of Chongqing Medical University and the Emergency Department of Critical Care Medicine of The First Affiliated Hospital of Chongqing Medical University. Their continuous support and collaboration have been instrumental in the successful completion of this research.
Supporting Information
Supporting Table 1. Patient characteristics of different subtypes of RM in the eICU database.
Supporting Figure 1. The study flowchart of the eICU database for external validation of clinical subtypes of RM.
Supporting Figure 2. ROC curve for the establishment of the predictive model for the clinical subtype of RM in the training set of the MIMIC-IV database using XGBoost machine learning.
Supporting Figure 3. The Kaplan–Meier curve of 28-day mortality based on dfferent clinical subtypes of RM in the eICU database.
Supporting Figure 4. The interpretation of the XGBoost model. Feature importance ranking based on SHAP values. The position on the Y-axis implied the importance ranking, and the X-axis reflected the association between each value of features and the corresponding SHAP value.
Open Research
Data Availability Statement
The data that support the findings of this study are available from the corresponding author upon reasonable request.


