Oxidative Stress-Related Targets POR and MAPK13 Elucidated for Sarcoidosis Therapy Through Multiomics Analysis
Abstract
Purpose: We aimed to identify potential plasma protein targets genetically associated with oxidative stress genes in sarcoidosis.
Methods: We performed summary data-based Mendelian randomization (SMR) analyses using summary statistics from the FinnGen cohorts and multiomics data on quantitative trait loci (QTLs) linked to oxidative stress genes at protein, RNA, and methylation levels. We validated the findings with two independent datasets from published studies. Bayesian colocalization analysis confirmed shared genetic bases and excluded pleiotropy. We also identified relevant plasma regulatory transcription factors (TFs) and constructed protein–protein interaction (PPI) networks. In addition, molecular docking was conducted for drug ligand-protein binding assays.
Results: MAPK13 and POR were identified as significant in proteome-wide SMR, transcriptome-wide SMR, and methylation-wide SMR analyses. These findings were validated through Bayesian colocalization and confirmed in two additional sarcoidosis cohorts. In PSMR analysis, the A allele of rs10447396 near MAPK13 (p38δ) (p = 0.0068 and β = 0.6009) and the A allele of rs59882870 at POR (p = 0.0006 and β = 0.3924) were associated with increased sarcoidosis risk. NFATC3 and NFKB1 were identified as common TFs influencing MAPK13 and POR expression in plasma. Molecular docking identified two potential MAPK13-targeting drugs, ilorasertib and SNS-314, both showing strong affinities for MAPK13.
Conclusion: This study is the first to identify MAPK13 and POR as potential drug targets for sarcoidosis. In addition, molecular docking preliminarily identified potential therapeutic compounds targeting these proteins, suggesting avenues for future experimental validation and the potential development of targeted therapies.
1. Introduction
Sarcoidosis is a systemic inflammatory disorder of uncertain etiology characterized by the formation of noncaseating granulomas across multiple organ systems. In the United States, the incidence of sarcoidosis ranges from 5 to 10 cases per 100,000 individuals [1, 2]. The condition typically manifests between the ages of 20 and 50; however, some studies have reported a bimodal age distribution, with the incidence peaking between 50 and 65 years of age [3]. While pulmonary involvement is the most common presentation, sarcoidosis can also affect the heart (increasing the risk of arrhythmias and sudden death), eyes (often manifesting as uveitis), kidneys (leading to granulomatous nephritis or hypercalcemia), and skin [4].
Immunologically, the granuloma core contains multinucleated giant cells derived from macrophages, with surrounding CD4+ and CD8+ T cells, fibroblasts, and occasional B cells. In this process, oxidative stress plays a significant role in the formation of chronic granulomas [5–7]. Immune dysregulation in sarcoidosis primarily involves CD4+ T cells, which accumulate in affected tissues, particularly the lungs, and secrete proinflammatory cytokines such as tumor necrosis factor-alpha (TNF-α), IL-12, and IL-18. Oxidative stress exacerbates this immune response by modulating the activity and recruitment of immune cells, including CD4+ T cells and macrophages. These immune cells, in turn, contribute to further oxidative damage by producing additional proinflammatory factors, thereby creating a vicious cycle that intensifies inflammation and promotes granuloma formation [5, 8]. Furthermore, the presence of oxidative DNA damage markers, such as 8-hydroxy-2-deoxyguanosine (8-OHdG), is correlated with disease severity, particularly in patients with cardiac sarcoidosis [9]. On the basis of these insights, inhibiting oxidative stress has therapeutic potential for impeding the progression and development of sarcoidosis.
Currently, the treatment of sarcoidosis primarily involves corticosteroids in combination with traditional immunosuppressants such as mycophenolate mofetil, azathioprine, methotrexate, and infliximab. However, these traditional immunosuppressants exert broad immunosuppressive effects, which not only inhibit proinflammatory responses but also increase the risk of adverse events, including severe infections, increased risk of tumors, and bone marrow suppression, due to the suppression of critical immune cell production and function, such as that of CD4+ T cells, B cells, and other key immune cells. Therefore, exploring targeted therapeutic strategies that focus on specific pathogenic proteins is becoming increasingly important [10, 11].
Our objective was to identify potential plasma targets of oxidative stress genes as therapeutic candidates for sarcoidosis by utilizing multiomics-based quantitative trait loci (QTL) data. In addition, we aimed to uncover their regulatory networks and evaluate preliminary drug candidates through drug-protein molecular docking analyses.
2. Methods
2.1. Overview
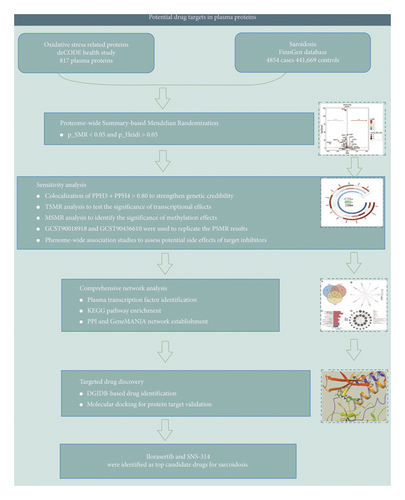
The study design of this research is outlined in Figure 1. protein quantitative trait loci (pQTLs) related to oxidative stress in plasma were selected as the initial tool for genome-wide association studies (GWASs) to identify proteins involved in the formation of sarcoidosis through Proteome-wide summary data-based Mendelian randomization (PSMR) analysis. Sensitivity analyses, including transcriptome-wide SMR (TSMR), methylation-wide SMR (MSMR), Bayesian colocalization, two independent sarcoidosis PSMR replication cohorts, and phenome-wide Association studies (PheWAS), were conducted to confirm the final target proteins. Finally, drug–target interactions were simulated through molecular docking to identify a preliminary drug candidate.
2.2. Data Source
This study utilized data from the deCODE consortium (https://www.decode.com/) [12] to obtain plasma pQTL data, expression QTL (eQTL) data from the eQTLGen consortium (https://eqtlgen.org/) [13], and methylation QTL (mQTL) data from published datasets by YangLab (https://yanglab.westlake.edu.cn/software/smr/) [14]. The GWAS data for the discovery cohort of sarcoidosis patients were sourced from the FinnGen Release 11 database, which includes 4854 cases of European ancestry and a total of 441,669 samples. Two replication cohorts for sarcoidosis were obtained from the GCST90018918 study [15], which included 1938 cases and 662,622 samples, and the GCST90436610 study, which included 548 cases and 403,220 samples (Additional file2, Table S1) [16]. Genes associated with oxidative stress were identified via a GeneCards database query for “oxidative stress,” yielding an initial set of 14,042 genes. These were filtered using the GeneCards “Relevance Score,” an indicator of the evidence strength connecting a gene to the term. We applied a stringent threshold, selecting genes with a Relevance Score ≥ 7 to focus on high-confidence candidates (Additional file2, Table S2). This criterion significantly surpassed the third quartile score (3.952) and was based on precedent studies [17–19].
2.3. PSMR Analysis
A significance threshold of p < 0.05 was applied, with multiple selected SNPs used for the calculations. Simultaneously, the Heterogeneity in Dependent Instruments (HEIDIs) test was conducted, with pQTLs yielding pHEIDI < 0.05 excluded from further analysis. The p value calculation for the HEIDI test followed the method described by Zhu et al. [20].
2.4. Bayesian Colocalization
To determine whether shared signals can be attributed to a single variant and reduce the risk of false positives, we performed Bayesian colocalization analysis on the basis of posterior probabilities. The posterior probabilities hypotheses (PPHs) are defined as follows: H0: no variants for either trait; H1/H2: a variant affecting the expression of only one trait; H3: distinct variants within the same region influencing both traits independently; and H4: a single variant within the same region influencing both traits. We applied a selection threshold of PPH3 + PPH4 > 0.8, indicating a strong genetic correlation, to strengthen the credibility of the PSMR results and minimize the likelihood of Type I errors. This criterion was chosen considering, on one hand, that the threshold represents evidence of a shared genetic signal (rather than absence of shared variants), and on the other hand, the limited statistical power for colocalization in this analysis. Therefore, the selection was informed by previous similar studies exploring plasma protein targets [21–23].
2.5. Sensitivity Analysis
To further validate the PSMR results, we employed TSMR and MSMR analyses to assess whether the transcriptional and methylation effects of specific genes were also significant. The inclusion criteria for expressing eQTLs and mQTLs were consistent with those used for pQTLs. For MSMR, p values were adjusted via the false discovery rate (FDR) method. In addition, GWAS summary statistics from two independent cohorts (GCST90018918 and GCST90436610) were utilized to replicate the PSMR findings. Proteins exhibiting opposite β-SMR directions were excluded from further analysis. To assess the potential side effects of the candidate targets, we conducted a PheWAS analysis in the https://www.azphewas.com to explore their associations across a wide range of phenotypes.
2.6. Comprehensive Network Analysis
To further explore the regulatory mechanisms underlying pathological gene expression and associated pathways, we analyzed plasma transcription factors (TFs) via the KnockTF 2.0 tool (https://bio.liclab.net/) [24], focusing on genes with a fold change greater than 1.5 or less than 0.667 in plasma samples. Pathway enrichment analysis was conducted via the MSigDB database. In addition, we investigated protein–protein interaction (PPI) networks through STRING (https://cn.string-db.org/) and GeneMANIA (https://genemania.org/) [25] to gain deeper insights into the regulatory networks governing protein expression.
2.7. Candidate Drug Investigation
Based on the multiomics results and TF predictions, serum proteins exhibiting the strongest genetic associations with sarcoidosis were prioritized as candidate therapeutic targets. We then utilized the Enrichr (https://maayanlab.cloud/Enrichr/) [26] and DGIdb (https://www.dgidb.org/downloads) [27]databases to identify drugs listed as potentially interacting with these candidate proteins. Drug sequences and structures were obtained from PubChem (https://pubchem.ncbi.nlm.nih.gov/compound/) [28] whereas protein sequences and structures were sourced from the PDB database (https://www.rcsb.org/) [29]. The predicted drug candidates with FDR-adjusted p values < 0.05 were considered potential therapeutic options. For each drug–protein pair, we evaluated the binding capabilities and interaction patterns through atomic-level molecular docking. A more negative binding score indicates stronger binding stability, with scores < −5 generally reflecting stable interactions. This process involved protein optimization, ligand optimization, binding site identification, and molecular docking, all of which were conducted via the Maestro Materials software suite.
3. Results
3.1. SMR Analysis of cis-xQTLs
In the discovery cohort, 22 oxidative stress genes containing cis-pQTLs in plasma were significantly genetically associated to sarcoidosis (Table 1 and Figures 2(a) and 2(d)). Among these, 14 out of 22 had a HEIDI test p value > 0.05. The colocalization results (Additional file1. Figure S1) indicated that only 5 of the 14 genetic loci—MAPK13, POR, ICAM1, PRDX6, and TNFRSF1A—passed the criteria (PPH3+PPH4 > 0.8) and were included in subsequent analyses.
| Gene symbol | SNP | Allele | Coefficient of SMR | p value of SMR | Coefficient of sarcoidosis | Coefficient of QTLs | p value of HEIDI test |
|---|---|---|---|---|---|---|---|
| PARK7 | rs226251 | C | −0.2288 | 0.0393 | −0.0258 | 0.1128 | 0.6285 |
| SELE | rs10919230 | G | −0.4447 | 0.0446 | 0.0513 | −0.1154 | 0.9777 |
| PRDX6 | rs6660804 | A | −0.1424 | 0.0068 | −0.0175 | 0.1228 | 0.1136 |
| IL1RN | rs55709272 | C | −0.4005 | 0.0356 | 0.0715 | −0.1784 | 0.5035 |
| ADH5 | rs28894371 | A | −0.0236 | 0.0184 | 0.0084 | −0.3572 | 0.238 |
| NFKB1 | rs230539 | A | 1.0005 | 0.0039 | −0.0657 | −0.0657 | 0.9254 |
| G3BP1 | rs2964576 | G | −0.8241 | 0.0142 | 0.0569 | −0.0691 | 0.6864 |
| MICB | rs3134900 | G | −0.4296 | 0 | 0.4402 | −1.0246 | 0 |
| VARS1 | rs550671 | T | −0.2662 | 0 | −0.0446 | 0.1677 | 0.3321 |
| HSPA1A | rs6929057 | C | −2.2506 | 0 | −0.223 | 0.0991 | 0 |
| HSPA1B | rs28414666 | A | −4.4309 | 0 | −0.269 | 0.0607 | 0.0005 |
| AGER | rs2070600 | T | 0.0664 | 0 | −0.0494 | −0.744 | 0.0004 |
| MAPK13 | rs10447396 | A | 0.6009 | 0.0068 | 0.0695 | 0.1156 | 0.1415 |
| POR | rs59882870 | A | 0.3924 | 0.0006 | 0.0757 | 0.193 | 0.354 |
| HSPB1 | rs2868371 | G | 0.1108 | 0 | −0.0558 | −0.5036 | 0.0439 |
| GSTP1 | rs1254123 | C | −0.2228 | 0.0148 | 0.0281 | −0.1262 | 0.1018 |
| TNFRSF1A | rs4149584 | T | −0.5926 | 0.0004 | 0.2526 | −0.4263 | NA |
| GAPDH | rs12425927 | G | −0.8863 | 0.0458 | −0.0715 | 0.0807 | 0.0456 |
| ALDH2 | rs10849939 | A | 0.8654 | 0.001 | −0.079 | −0.0913 | 0.0069 |
| ACADVL | rs507506 | G | 1.261 | 0.009 | −0.0608 | −0.0482 | 0.1915 |
| ELANE | rs10409474 | G | 0.0322 | 0.0428 | 0.0146 | 0.4542 | 0.442 |
| ICAM1 | rs5498 | G | −0.033 | 0.0001 | 0.0376 | −1.1399 | 0.2359 |
- Note: PSMR = proteome-wide SMR.
- Abbreviations: HEIDI = heterogeneity in dependent instruments, QTL = quantitative trait loci, SNP = single nucleotide polymorphism.
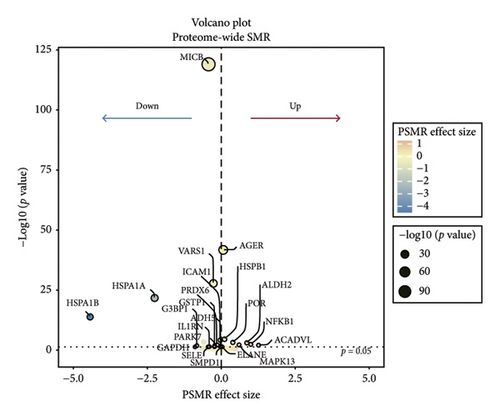
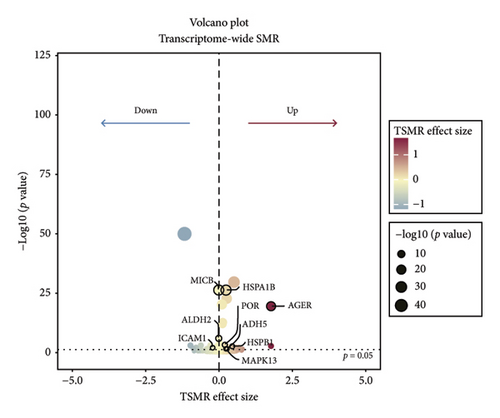
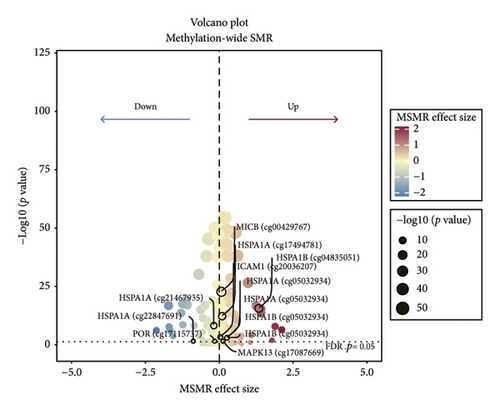
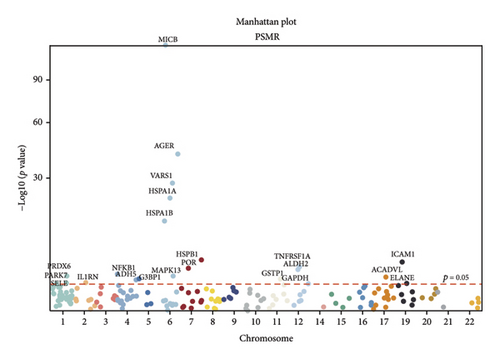
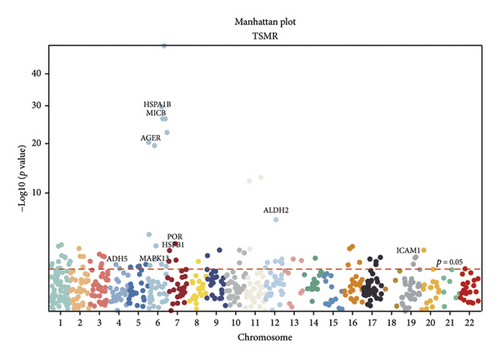
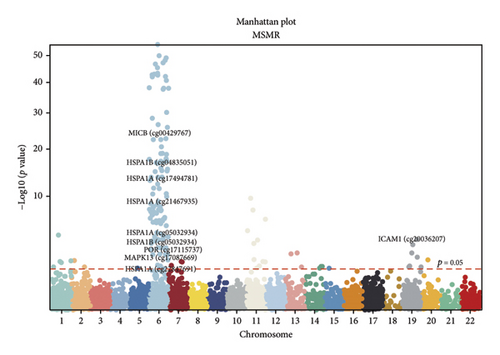
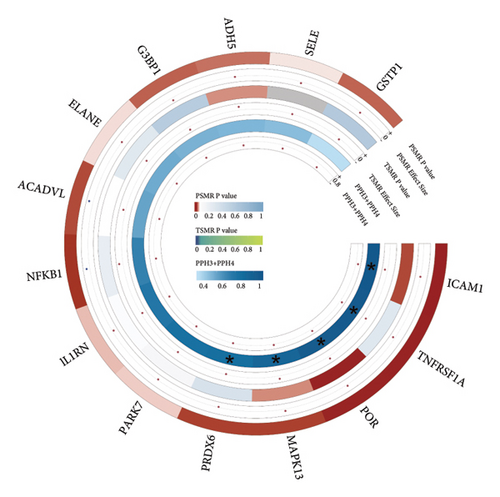
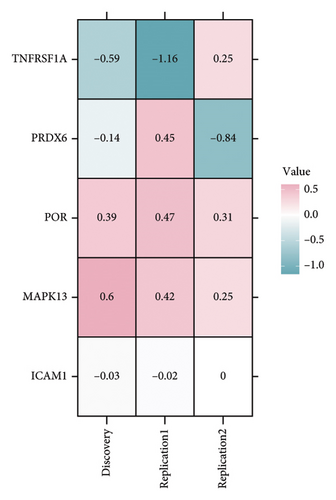
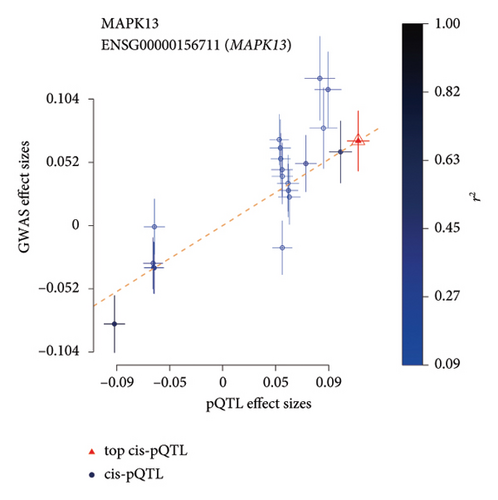
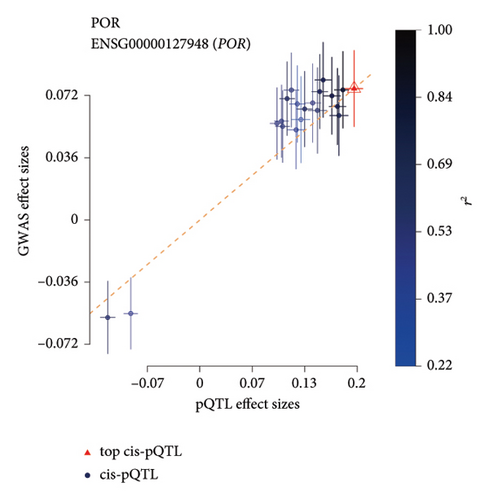
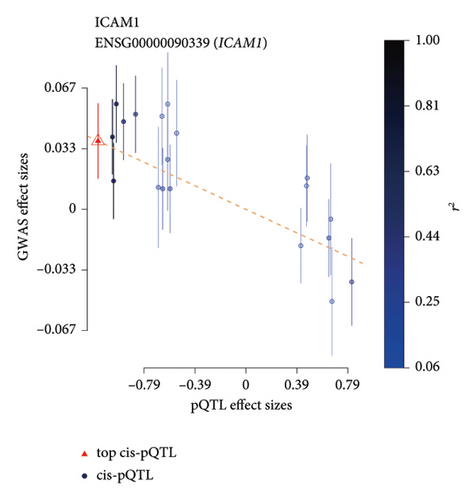
TSMR analysis identified significant associations (p < 0.05) including POR (β = 0.196 and p = 0.005), MAPK13 (β = 0.234 and p = 0.024), and ICAM1 (β = −0.220 and p = 0.008). The directions of the β coefficients for these genes were consistent with those observed in the PSMR analysis (Figures 2(b) and 2(e), Additional file2, and Table S3). According to the MSMR analysis, the CpG site cg20036207 within ICAM1 was significantly correlated with a greater risk of sarcoidosis (β = 0.037 and PFDR = 0.005); the CpG site cg17087669 within MAPK13 was also significantly correlated with a greater risk (β = 0.130 and PFDR = 0.032); and the CpG site cg17115737 within POR was significantly correlated with a lower risk of sarcoidosis (β = −0.156 and PFDR = 0.028) (Figures 2(c), 2(f), Additional file2, and Table S4). A summary of the PSMR, TSMR, and colocalization analyses for sarcoidosis candidate genes is presented in Figure 3(a). Sensitivity analyses utilizing two independent sarcoidosis cohorts were performed. The β-SMR effect directions for TNFRSF1A and PRDX6 were inconsistent between the discovery and replication cohorts. Therefore, these two loci did not meet our predefined criterion for consistent effect direction across cohorts and were excluded from further analysis (Figure 3(b)). Genetically predicted levels of POR (β = 0.392 and p = 0.006) and MAPK13 (β = 0.601 and p = 0.007) were positively associated with sarcoidosis risk, while genetically predicted ICAM1 levels (β = −0.033 and p = 0.001) showed a negative association (Figures 3(c), 3(d), and 3(e)). The expression patterns of POR, MAPK13, and ICAM1 across a wide spectrum of normal human tissues are depicted in Figure 3(f), suggesting that the expression of these genes varies across a range of tissues. POR transcripts are widely detected, showing moderate-to-high relative abundance in several metabolic and endocrine tissues, while MAPK13 expression is enriched in specific tissues, notably the lung, skin, and parts of the digestive tract; in addition, ICAM1 expression is prominent in the lung and tissues involved in immune responses. Following sensitivity analyses and replication, three genes—MAPK13, POR, and ICAM1—showed evidence of association based on our multiomics SMR criteria and replication. The PSMR analysis indicated positive associations for MAPK13 (β = 0.601 and p = 0.007) and POR (β = 0.392 and p = 0.006), while ICAM1 showed a negative association with a smaller effect size (β = −0.033 and p = 0.001). Based on the consistent positive associations and comparatively larger effect sizes observed across multiple analyses (PSMR and TSMR) and replication cohorts for MAPK13 and POR, these were prioritized for downstream regulatory network and drug docking analyses.

3.2. Comprehensive Regulatory Network Analysis
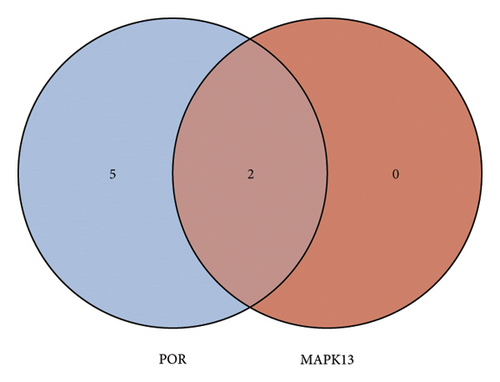
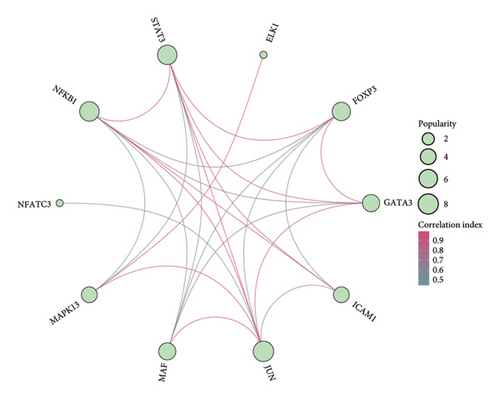
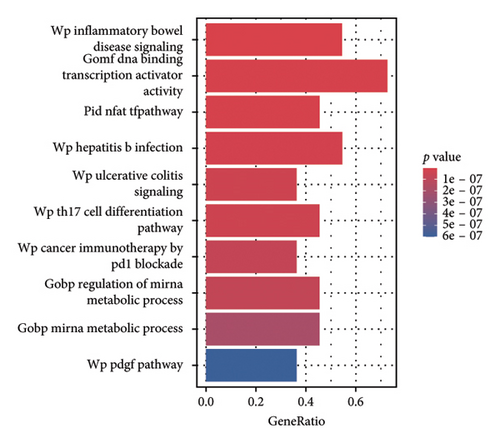
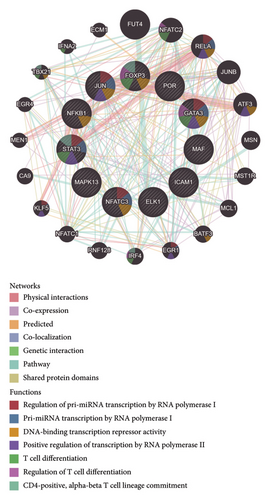
Analysis using the KnockTF 2.0 database identified 2 potential plasma TFs predicted to regulate the expression of MAPK13 and 7 predicted to regulate POR (Figure 4(a)). Among these, NFATC3 and NFKB1 were the common TFs identified for MAPK1 and POR (Additional file2, Table S5). The PPI regulatory network of TFs, shown in Figure 4(b), suggests that STAT3 and JUN may play crucial downstream roles in the development of sarcoidosis. Pathway enrichment analysis identified significantly enriched pathways, including inflammatory bowel disease signaling, DNA binding transcription activator activity, the NFAT-TF pathway, hepatitis B infection, and ulcerative colitis signaling (Figure 4(c)). In addition, GeneMANIA provided insights into the physical and functional interaction networks (Figure 4(d)).
3.3. Candidate Drug Investigation
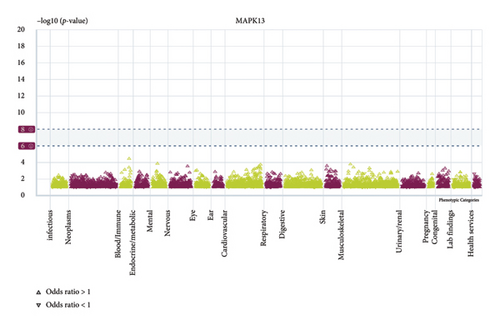
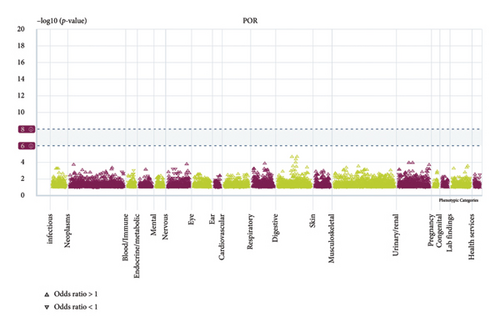
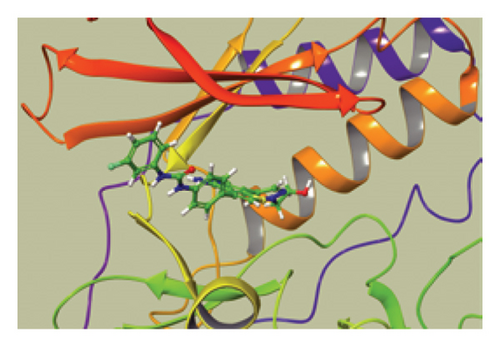
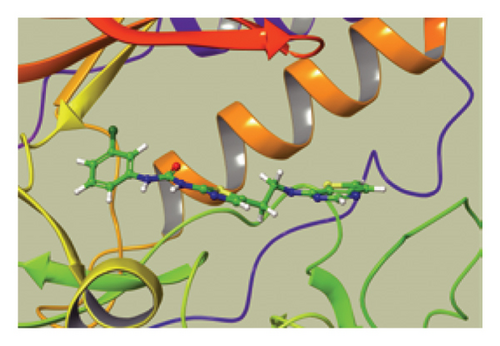
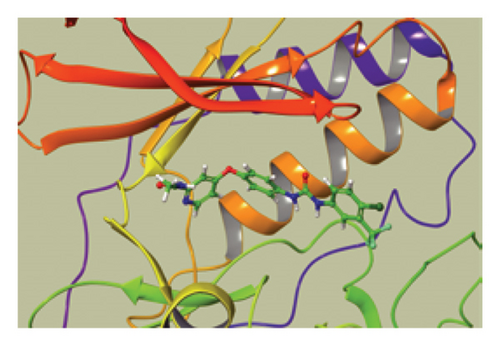
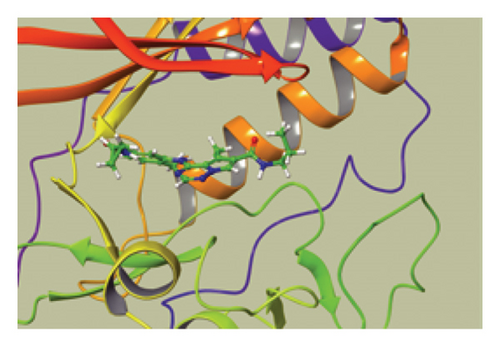
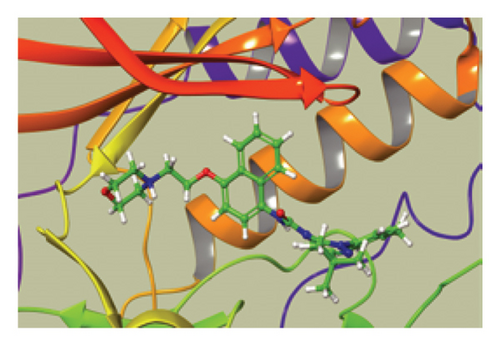
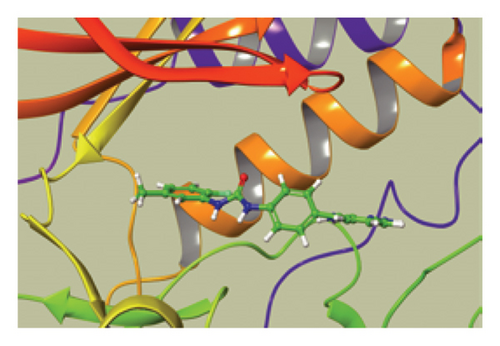
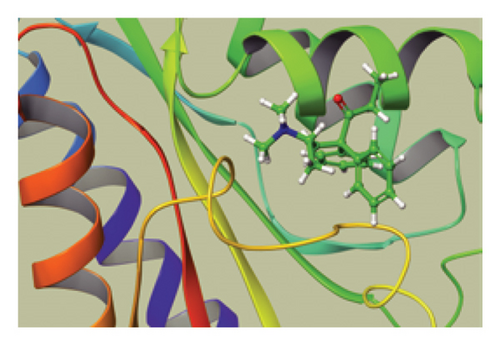
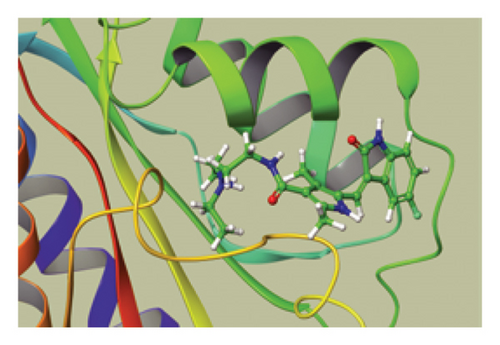
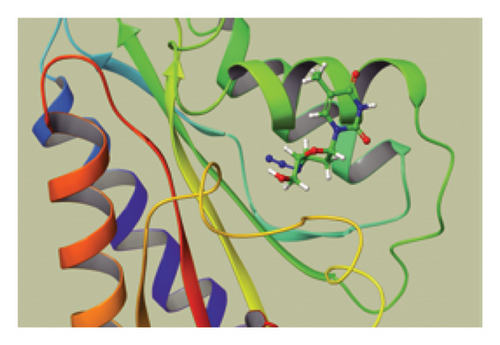
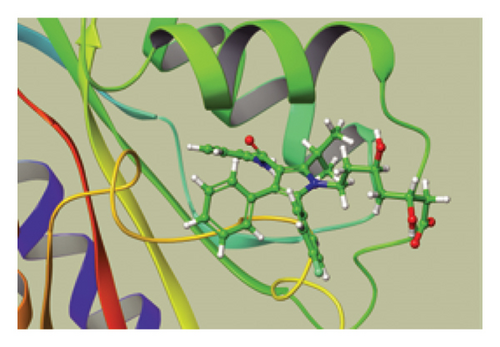
We conducted a PheWAS analysis for these genes. As shown in Figure 5, no significant correlations with phenotypes related to POR or MAPK13 were observed. Using the Enrichr and DGIdb databases, we identified 11 relevant drugs, which are listed in Additional file2, Table S6. Consequently, we performed molecular docking for specific drug–protein pairs and obtained the binding energy (Figure 6). The binding sites of the proteins were developed via the sitemap module of the MAESTRO software. The site score, size, D score, and volume for MAPK13 are 1.047, 136, 1.035, and 483.287, respectively. For the POR protein, these values are 0.492, 19, 0.43, and 43.218, respectively. The top three binding energies were −7.156 for ilorasertib-MAPK13, −5.578 for sorafenib-MAPK13, and −5.392 for SNS 314-MAPK13 (Table 2).
| Target | Potential drug | Molecular docking score |
|---|---|---|
| MAPK13 | Ilorasertib | −7.156 |
| MAPK13 | SNS-314 | −6.392 |
| MAPK13 | Sorafenib | −5.578 |
| MAPK13 | BMS 582949 | −5.118 |
| MAPK13 | Doramapimod | −5.08 |
| MAPK13 | Linifanib | −4.755 |
| POR | Methadone | −4.491 |
| POR | Suntinib | −3.498 |
| POR | Zidovudine | −4.34 |
| POR | Atorvastatin | −3.271 |
4. Discussion
Recently, Arkema et al. employed the Olink Inflammation Panel technique to demonstrate that 44 out of 92 proinflammatory plasma proteins were significantly elevated in sarcoidosis patients compared with the general population. Notably, these plasma proteins were elevated prior to the diagnosis of sarcoidosis, with an average lead time of 13.4 years, underscoring the potential pathogenic role of plasma oxidative stress-related genes in sarcoidosis [30]. This study demonstrated that the expression of specific plasma oxidative stress-related genes, particularly MAPK13 and POR, which we examined through SMR and sensitivity analyses, may play a key role in the pathogenesis of sarcoidosis.
ICAM1 (CD45) is a crucial glycoprotein involved in the inflammatory response and is expressed predominantly on the surface of endothelial cells. It plays a pivotal role in leukocyte adhesion and migration, primarily through its involvement in the NF-kB and MAPK signaling pathways. Interestingly, while ICAM1 met our statistical criteria for association, the direction of effect in the PSMR (β = −0.033) was negative despite the coefficient being very weak, suggesting that higher genetically predicted ICAM1 levels are associated with lower sarcoidosis risk in this analysis. This finding contrasts with literature reports of elevated ICAM-1 protein levels in sarcoidosis patients and its known proinflammatory functions [31]. Given our aim to identify targets where higher expression relates to higher disease risk, and the positive associations found for MAPK13 and POR across multiple evidence levels, we prioritized MAPK13 and POR for further investigation as potential therapeutic targets. The unexpected genetic association for ICAM1 might reflect complex feedback mechanisms, specific SNP effects captured by pQTLs that differ from overall protein levels, or other unmeasured confounding.
MAPK13 is a member of the p38 MAPK family and is characterized by similar structural features and biological functions. In mammalian cells, the p38 MAPK family comprises four isoforms: p38α (MAPK14), p38β (MAPK11), p38γ (MAPK12), and p38δ (MAPK13). Previous studies have demonstrated that p38 MAPK plays a significant role in the pathogenesis of sarcoidosis. A study by Talreja et al. indicated that p38 MAPK plays a crucial role in the pathogenesis of sarcoidosis. In alveolar macrophages from sarcoidosis patients, p38 is activated by MAPK kinase 4 (MKK4) and Rip2, leading to its phosphorylation and subsequent promotion of proinflammatory cytokines, such as IL-6 and TNF-α, which induce Th1 activation [32]. Conversely, the inhibition of Rip2 and IRAK1/4 significantly reduces p38 expression, ultimately resulting in decreased levels of activated T cells, IL-6, and interferon gamma (IFN-γ) [33]. Furthermore, SB203580, a p38 inhibitor, has demonstrated efficacy in reducing the inflammatory response in alveolar macrophages from sarcoidosis patients [34]. Furthermore, a recent study corroborated the findings of Jaya’s team, revealing that MIF regulates the activation of p38/ERK through MKP-1. This regulation inhibits the activation of alveolar macrophages, CD14+ monocytes, and peripheral blood mononuclear cells (PBMCs), leading to a reduction in the production of inflammatory cytokines such as IL-6 while simultaneously increasing the proportions of T cells (Tregs) and anti-inflammatory factors. Notably, the use of the p38 inhibitor SB203580 can further modulate p38 activity by increasing MIF expression [35]. The MKK4 signaling pathway plays a critical role in regulating TGF-β production in macrophages expressing transmembrane TNF-α (mTNF-α). Resting macrophages exhibit baseline levels of mTNF-α, which become activated upon exposure to anti-TNF-α antibodies, leading to the activation of the MKK4 pathway. This activation subsequently induces the synthesis of TGF-β, a process regulated by Jun kinase and p38 MAPK. Moreover, exposure to lipopolysaccharide (LPS) further enhances mTNF-α expression, and the subsequent activation of mTNF-α significantly suppresses LPS-induced proinflammatory responses. Neutralizing TGF-α with antibodies effectively blocks the immunosuppressive effects mediated by mTNF-α, indicating that the immunosuppressive action of mTNF-α is dependent on TGF-β [36].
Currently, there is limited direct evidence linking MAPK13 (p38δ) specifically to the pathogenesis of sarcoidosis. Ten years ago, the role of MAPK13 in regulating inflammation was reported. Paloma’s research team analyzed the roles of MAPK13 and MAPK14 in colitis-associated colorectal cancer and reported that the deletion of these kinases significantly reduced tumor formation. This reduction was accompanied by a decrease in the production of proinflammatory cytokines and chemokines, such as IL-1β and TNF-α, as well as reactive oxygen species (ROS) and reactive nitrogen intermediates, which can directly cause DNA damage and mutations. The combined deletion of MAPK13/14 impairs proinflammatory cytokine production in macrophages and dendritic cells (DCs) in response to bacterial LPS [37]. MAPK13/14 may serve as critical regulators of immune responses within the p38 MAPK family. Neither the deletion of p38α nor p38β alone nor the combined deletion of both leads to defects in thymocyte development, despite their essential roles in T-cell differentiation and maturation [38, 39]. However, both single and combined deletions of MAPK13/14 resulted in specific defects in thymocyte development. Thymocyte cellularity, including the counts of various subsets (various CD4+ and CD8+ thymocytes), was significantly lower in MAPK13−/−, MAPK14−/−, and MAPK13/14−/− mice than in wild-type (WT) mice [40]. Other studies have demonstrated that both myeloid-specific and global MAPK13 knockout (KO) models result in reduced neutrophil accumulation in the alveoli and attenuate acute lung injury [41].
These findings suggest that the inhibition of MAPK13, either alone or in combination with MAPK14, may regulate CD4+ and CD8+ thymocytes as well as proinflammatory responses, making it a potential therapeutic target for sarcoidosis. In this study, we identified a total of 19 significant pQTLs within 2000 kb of the MAPK13 position on chromosome 6, specifically at position 36,136,166, with a p value < 5 × 10⁻⁸. The results indicated that the p value of the SMR was significant (β = 0.6 and p = 0.006) and was further validated in two additional cohorts. We also identified a significant methylation site (cg17087669 A allele) that positively affects sarcoidosis by increasing MAPK13 expression levels. The consistent associations observed across methylation, transcript, and protein levels for the MAPK13 gene support its potential involvement in the pathogenesis of sarcoidosis. It is crucial to emphasize that while molecular docking provides valuable insights into potential drug–target interactions, these findings are predictive and preliminary. The therapeutic potential of inhibiting MAPK13 or POR and the efficacy of compounds such as ilorasertib and SNS-314 require rigorous experimental validation. Future studies involving in vitro binding assays, cell-based functional assays, and in vivo testing are essential to confirm these computational predictions and assess actual therapeutic efficacy and safety profiles.
Owing to the limited research on MAPK13, drug development efforts targeting this kinase are still in the early design stages. Most existing drugs are aimed primarily at other members of the p38 MAPK family, such as SM-101, which is used primarily for the treatment of Alzheimer’s disease and idiopathic thrombocytopenic purpura. Recent key findings indicate that a new generation of potent MAPK13-14 inhibitors, designated NuP-3, effectively downregulates mucus production stimulated by type 2 cytokines. This inhibitor has promising efficacy at the air–liquid interface and in human airway epithelial cell organoid cultures [42]. For our analysis, we utilized molecular docking techniques to identify potential targeted drugs on the basis of the drug prediction results from DGIdb. Among the evaluated compounds, ilorasertib, sorafenib, and SNS-314 presented the lowest binding energies, with ilorasertib showing particularly strong affinity. Notably, ilorasertib is an inhibitor of Aurora/VEGF kinases, whereas SNS-314 specifically inhibits Aurora kinases, both of which play significant roles in cancer progression [43]. Both Aurora and VEGF serve as upstream regulators of p38 MAPK [44]. Mutations in Aurora/VEGF can lead to the phosphorylation of the upstream kinases MKK3 and MKK6, promoting the activation of p38 MAPK, which in turn results in inflammation, apoptosis, ferroptosis, and pulmonary fibrosis in the lungs. Therefore, ilorasertib and SNS-314 hold promise as potential therapeutic targets for sarcoidosis, providing a solid foundation for further research. In hepatocellular carcinoma, sorafenib acts as a RAF inhibitor, deactivating the MAPK pathway by inhibiting the ERK1/2 pathway. It can also induce tumor cell apoptosis by activating the JNK/p38-MAPK pathway. Thus, the effect of sorafenib on MAPK13 is likely to be promoting but not inhibitory, making it unsuitable as a treatment for sarcoidosis.
The POR gene is located at the 7q11.2 locus on chromosome 7 and functions primarily to transfer electrons from nicotinamide adenine dinucleotide phosphate (NADPH) to cytochrome P450 enzymes, facilitating steroid synthesis. Currently, very few studies have reported an association between POR and sarcoidosis. Our analyses suggest an association between the A allele of the rs59882870 locus in the POR gene and an increased risk of sarcoidosis. In addition, MSMR analysis indicated that genetically predicted methylation at the cg17115737 locus is associated with a reduced risk of the disease, consistent with a potential modulatory role of POR expression or regulation in sarcoidosis susceptibility. The findings of Meguro et al. are consistent with our findings, as they demonstrated that increased expression of POR in various tissues is significantly associated with the risk of sarcoidosis [45]. They proposed that this relationship may be linked to elevated endogenous corticosteroid levels induced by increased POR expression, which further leads to immunosuppression and decreased host resistance to exogenous agents, ultimately contributing to the development of sarcoidosis. Moreover, positive results from SMR and colocalization analyses of POR transcriptomics and proteomics data validated both the transcriptional and translational activity of POR, suggesting that the POR gene may serve as a potential target for early monitoring and treatment of sarcoidosis. The integration of multiomics SMR provided complementary evidence streams. While MAPK13 exhibited consistent positive associations with sarcoidosis risk across protein, transcript, and methylation levels, strengthening its candidacy, the MSMR signals for POR and ICAM1 showed directions opposing their respective PSMR/TSMR associations. This divergence is biologically plausible and potentially informative, hinting at distinct regulatory mechanisms captured by each omic layer. DNA methylation’s functional impact is highly dependent on its genomic location: methylation within CpG islands in promoter regions typically correlates inversely with gene expression whereas methylation within gene bodies or distal regulatory elements can have variable, sometimes positive, correlations with transcription or influence processes like alternative splicing or enhancer activity.
This study utilized plasma multiomics data, including pQTL, eQTL, and mQTL data, to investigate gene expression related to oxidative stress associated with the occurrence of sarcoidosis, thereby identifying potential therapeutic targets and laying the groundwork for unraveling the complexities of the disease. However, this research has several limitations. First, owing to the limited GWAS data on proteins available in the deCODE database, we could not fully explore the impact of all oxidative stress-related proteins on sarcoidosis, which may have resulted in omissions. Second, a significant limitation of this study is its reliance solely on computational and statistical analyses. While our multiomics SMR approach provides robust genetic evidence linking MAPK13 and POR expression to sarcoidosis risk, and molecular docking suggests potential drug interactions, these findings lack direct experimental validation. The actual functional roles of MAPK13 and POR in sarcoidosis pathophysiology, their precise regulatory mechanisms, and the in vitro/in vivo efficacy and specificity of the identified potential drug candidates remain to be confirmed. Therefore, the therapeutic implications discussed should be interpreted as hypothesis generating and require substantial experimental follow-up before any clinical translation can be considered. In addition, while the colocalization analysis indicated a strong genetic correlation with PPH4 + PPH4 > 0.8, the individual PPH4 values in the colocalization analysis did not exceed 0.8, suggesting the potential for false positive results.
5. Conclusion
This study utilized plasma multiomics data, including pQTL, eQTL, and mQTL data, to investigate the genetic associations between oxidative stress-related gene expression and sarcoidosis. In the PSMR analysis, the A allele of rs10447396 near MAPK13 (p38δ) (p = 0.0068 and β = 0.6009) and the A allele of rs59882870 at POR (p = 0.0006 and β = 0.3924) were associated with an increased risk of sarcoidosis. Analyses based on the TSMR and MSMR further confirmed that the transcriptional processes and methylations of these two genes are significantly associated with sarcoidosis risk. Notably, this study is the first to report a significant positive correlation between MAPK13 gene expression and sarcoidosis. Through network pharmacology analysis, we identified two drugs—iodorasertib and SNS-314—that are likely to stably bind to the plasma protein-binding domain of MAPK13, providing a foundation for future experimental studies aimed at validating these targets and exploring their potential for the development of novel therapeutic strategies for sarcoidosis.
Ethics Statement
This study was conducted via openly available GWAS summary statistics and, therefore, did not require ethical approval.
Consent
The authors have nothing to report.
Conflicts of Interest
The authors declare no conflicts of interest.
Author Contributions
Xun Yang conceived and supervised the study. Hao Jiang collected the data and conducted the analysis. Xun Yang prepared the final draft and approved the final submission. Xun Yang and Hao Jiang contributed equally.
Funding
The authors received no specific funding for this work.
Acknowledgments
We sincerely acknowledge all those who selflessly share their publicly available GWAS statistical data and open-source computational software.
Supporting Information
Additional supporting information can be found online in the Supporting Information section.
Open Research
Data Availability Statement
All relevant data generated or analyzed during this study are included within the article or can be obtained from the corresponding author upon reasonable request.


