Safety Assessment of Electromagnetic Exposure for 24 GHz Anticollision Antenna Mounted on the Side of Electric Vehicle
Abstract
This study aims to investigate the effects of radio frequency electromagnetic field (RF-EMF) generated by 24 GHz anticollision antennas on passengers and pedestrians under exposure from different numbers of the antenna, each fed with 0.1 W. The proposed array antenna operates from 23.75 to 24.15 GHz with high gain for 21.7 dBi and low sidelobe level for −20 dB at 24 GHz, which can meet the design requirements of automotive anticollision radar antenna. By means of computational dosimetry, the specific absorption rate (SAR) distribution, the whole-body average SAR (SARwb), the absorbed power density (Sab), the temperature rises on surface and cross-section of human head are calculated for measuring RF-EMF doses of passengers and pedestrians. In all exposure scenarios where the passengers are exposed to the antenna radiation, the SARwb value and the Sab value of the driver are the largest. In the single-antenna exposure scenario, the SARwb value is 1.67 × 10⁻⁶ W/kg and the Sab value is 0.97 W/m2. In the two-antenna exposure scenario, the SARwb value is 1.56 × 10⁻⁵ W/kg and the Sab value is 1.8356 W/m2. In the four-antenna exposure scenario, the SARwb value is 1.50 × 10⁻⁵ W/kg and the Sab value is 2.7301 W/m2. In all exposure scenarios where the pedestrians are exposed to the antenna radiation, the SARwb value of the rear pedestrian frontal to the antenna is the largest with 2.68 × 10⁻⁸ W/kg. Moreover, the Sab value of the front pedestrian frontal to the antenna is the largest with 0.00289 W/m2. And the maximum local temperature rises on human heads of passengers and pedestrians are all 0.220°C. In a word, all calculated values are well below the International Commission on Nonionizing Radiation Protection (ICNIRP) basic restrictions and reference levels.
1. Introduction
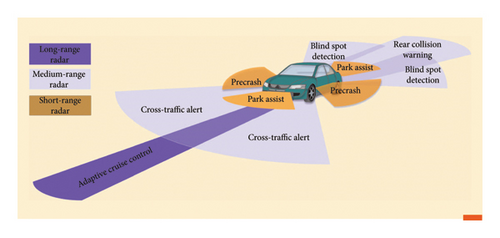
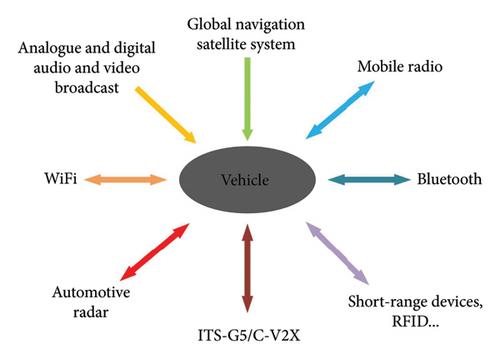
In our daily life, the electric vehicle as an important means of transportation, its significance is self-evident. With the rapid development of electronic technology and integrated packaging technology, more and more electronic equipment and electrical systems have been widely used in electric vehicles. As part of in-vehicle electronic equipment, the automotive radar system plays a key role. The concept of automotive radar was first proposed in 1960s. In that decade, radars were mainly used for vehicle speed monitoring, precollision, and obstacle detection, which could help drivers to perform emergency braking [1–3]. Radar frequencies first were around 10 or 16 GHz, resulting in reasonably large antenna areas for the required beamwidths. Following this, the advent of higher-frequency radars changed that situation. The first commercial radar was the 24-GHz sensor from VORAD mounted to many buses and trucks in the United States [4]. It used planar integration technology to improve the integration of antennas and reduce the volume of radar sensors. Then, the first generation of automotive radar sensors in the 77 GHz band became available in 1998 [5]. Among this period, most major vehicle manufactures offered a radar system in their upper class segments. For example, Bosch officially launched a 77 GHz vehicle radar in 2003, which was soon put into commercial use; 77 GHz radar sensors can provide a comfort function, where sensors measure the speed and distance of other vehicles for achieving forward collision warning and adaptive cruise control (ACC). The continuous development of the driver assistance market has led to a substantial diversity in automotive radar sensor implementations. The Bosch LRR3 sensor is distinguished by its innovative dielectric lens antenna, which facilitates high gain essential for achieving a maximum detection range of 250 m [6]. The radar employs a configuration of four patch antennas aligned along the focal line of the dielectric lens, resulting in the formation of four spatially offset beams. Each antenna functions as a receiving unit, while the two central antennas additionally serve as transmitters. By leveraging the phase and amplitude data across all four channels, the radar can accurately derive angular information for detected objects. Notably, the LRR3 is the first sensor to incorporate silicon–germanium (SiGe) integrated circuits operating at 77 GHz, marking a significant advancement in automotive radar technology. The ARS 300 presented by Continental employs mechanical scanning to survey its field of view [7]. The radar utilizes a grooved rolling spindle to generate a narrow, scanning antenna beam [8]. Through specific patterning on the spindle, the radar can alternate between long-range and mid-range modes, thereby adjusting its field of view. Additionally, by pivoting a reflector plate, the antenna is capable of multilevel elevation scanning, which facilitates automatic alignment functionality. Today, with the rapid development of radio frequency (RF) devices and circuits as well as signal processing technology, the functionality of high-performance automotive radar sensors is no longer limited to anticollision detection. Radar systems, formed by combining radars with different operating frequencies, now provide robust hardware support for advanced driver assistance systems (ADAS). These sensors gather information about surrounding environment, including road conditions, the position and speed of other vehicles and pedestrians, to enable precise perception. The data are then collected, processed, and analyzed by using machine learning and other artificial intelligence technologies, so as to realize driverless. Among them, different range radar with its unique superiority plays a key role in the automotive radar system. The different range radars used in ADAS are shown in Figure 1 [9]. It can be observed that the radar system achieves many functions, such as blind spot detection (BSD), lane change assistance (LCA), rear collision warning (RCW), ACC, parking assistance, and so on. In future, the addition of four-dimensional (4D) radar can better achieve autonomous driving. And, 4D radar can provide precise environmental perception and identify three-dimensional (3D) position as well as velocity of objects. This is particularly crucial for accurately detecting the posture and motion status of pedestrians, obstacles, and other vehicles [10]. Moreover, vehicle-mounted radars combined with V2X technology enable multivehicle collaborative perception. By sharing radar information with each other, real-time traffic information is updated to guarantee personal safety [11]. In a word, future radar networks can assist vehicles in achieving L4 and higher levels of autonomous driving and helping to identify various dynamic objects as well as moving obstacles in complex urban road environments [12]. In addition, the realization of driverless technology relies on complex in-vehicle radio systems. As shown in Figure 2, it illustrates the classification of various wireless standards and services used within the vehicle [13]. Radio systems covering different frequency bands interact with the electric vehicle’s overall environment, thereby affecting the electromagnetic environmental exposure of traffic participants inside the electric vehicle as well as outside.
Since the dimensions of transportation equipment, such as electric vehicles and high-speed trains, are much larger than the radiation wavelength, the transportation equipment can be regarded as an electrical large size. The high-power electrical systems and electronic devices on the transportation equipment occupy a chaotic range of frequency bands. At the same time, the electromagnetic environment pollution caused by the composite electromagnetic field (EMF) and electromagnetic wave radiation from those systems and devices is becoming increasingly serious. The EMF exposure of transmitting antennas and other components will affect the safety and reliability of electronic equipment and systems. It also causes potential concerns on human health and safety even though there is no evidence suggesting health effects for EMF exposure below the limits provided by the International Commission on Non-Ionizing Radiation Protection (ICNIRP) [14]. To measure the impact of electromagnetic exposure on human health, bioelectromagnetics came into being. Since the 1990s, people have been increasingly concerned about electromagnetic exposure from different sources of EMFs in living and working circumstances, such as large medical equipment, electronic devices, and communication equipment. Since then, the impacts of complex electromagnetic environment on humans have gradually gained widespread attention from scholars. For example, in 2012 Lu et al. [15] conducted simulations to calculate the specific absorption rate (SAR) of human head models exposed to a 1750 MHz universal mobile phone model at different ages. The results showed that the distribution of SAR values in head models was age-dependent, with deeper penetration observed in the children’s head model. In 2022, Lu et al. [16] simulated and calculated the electromagnetic exposure levels of healthcare workers using an H-coil for deep transcranial magnetic stimulation (TMS). The results indicated that healthcare workers should maintain the distance of 100 cm from the H-coil. Furthermore, with the rapid development of electric vehicles, the research on electromagnetic exposure for electric vehicles has become a new topic in bioelectromagnetics. Conducting safety assessments of electromagnetic exposure in electric vehicles can elucidate the health implications of the internal electromagnetic environment on humans and address existing research gaps. Rigorous evaluation of human electromagnetic exposure levels can inform the development of safety standards for the electric vehicle industry, enhance public comprehension of electromagnetic environments, and provide a foundational basis for safety protocols in electromagnetic exposure. Furthermore, the research on human electromagnetic exposure holds significant potential to advance efforts in mitigating electromagnetic pollution, safeguarding public health, and facilitating progress in electromagnetic technologies.
This study focuses on the electromagnetic exposure radiation source as the vehicle-mounted antenna. In the recent studies, Ammar Guellab [17] et al. used an efficient finite difference time domain (FDTD) method to evaluate the electromagnetic exposure of antennas mounted on military vehicles to heterogeneous human models at different positions inside the cabin. The local SAR value and the whole-body average SAR (SARwb) value of each occupant were calculated at 1 W CW radiated power. All values were significantly lower than the dosimetry reference limits (DRLs) in the Institute of Electrical and Electronics Engineers (IEEE) guidelines [18]. Baramili [19] et al. investigated the influence of multiband 4G/5G antennas on drivers when antennas were located at different positions of vehicle window glass. They calculated the electric field strength of the driver and finally found the optimal antenna installation position was above the vehicle backplane. Gabriella Tognola [20] et al. evaluated the radio frequency electromagnetic field (RF-EMF) exposure dose generated by vehicle-to-vehicle (V2V) antennas operating in the ITS-5.9 GHz band through calculating the SAR value of an adult driver in a vehicle. It was proved that the SAR value of whole-body exposure to EMF in the range of 100 kHz to 300 GHz was always lower than the public exposure restriction recommended in the ICNIRP guideline. Moreover, Gabriella Tognola [21] et al. also conducted a comprehensive investigation on the EMF generated by the whole-vehicle connected technology. The results showed that the EMF exposure in the vehicle did not exceed the public exposure restrictions in ICNIRP guidelines and IEEE guidelines under any circumstance. Ibrahim [22] et al. analyzed the performance of a cellular vehicle-to-everything (C-V2X) monopole antenna mounted on vehicular panoramic glass. The SAR values of passengers at different positions were calculated under exposure by a C-V2X monopole antenna excited with 23 dBm at 5.9 GHz. The results showed that the maximum SAR values for all passengers were well below the safety limits recommended by the Federal Communication Commission (FCC).
Most of the radiation sources are antennas in the field of personal wireless communication or V2X communication technologies. Few studies focus on the short-range vehicle-mounted 24 GHz radar antenna. The 24-GHz radar, as one of the main components of ADAS, is used to provide technical support. Then, radars with different functions are also installed in different positions on the vehicle body [23]: Radars for BSD and LCA are usually used to remind the driver of the situation behind the vehicle and can be integrated in the rear bumper of the vehicle. Radars for ACC enable the vehicle to cruise at a constant speed, maintain a reasonable distance from the vehicle ahead of the road, and can be integrated into the front bumper of the vehicle. With the continuous development of driverless technology, modern vehicles will be equipped with more complex radar sensors in the future. Considering the size of the vehicle body and the limited installation positions of vehicle-mounted radars, the 24-GHz radar for precrash function is installed inside the door of the electric vehicle in this study. It is used to provide the driver with the side-coming collision warning function and to supplement other short-range radar coverage on the side of the electric vehicle [9, 24, 25].
However, most of the studies only focus on the SARwb values and the local maximum SAR values permitted by various electromagnetic exposure guidelines, without discussing the temperature rise of in human tissues. On this basis, this study will focus on the 24-GHz radar antennas installed on the side of the electric vehicle for anticollision function. It will also investigate the electromagnetic exposure generated by antennas on traffic participants inside the electric vehicle as well as outside. The SAR value distribution, the SARwb value, the absorbed power density (Sab) value, the temperature rises on surface and cross-section of human head are analyzed and calculated. In Chapter 2, this study constructs the 3D model based on a real electric vehicle, the driver sitting model, the passenger sitting model, and the pedestrian standing model in COMSOL Multiphysics software. The human head tissues adopt a three-layer spherical model consisting of the scalp layer, the skull layer, and the brain layer. Then, an antenna working at 24 GHz for anticollision function is designed and the relevant simulation results are given. In Chapter 3, electromagnetic wave propagation and heat conduction of passengers and pedestrians at different positions are analyzed according to Maxwell’s equation [26] and Pennes’ bioheat equation [27]. In Chapter 4, the SAR value distribution, the SARwb value, the Sab value, the temperature rises on surface and cross-section of human head are calculated at different positions with different numbers of the antenna. Finally, the SARwb value, the Sab value, and the local temperature rise on human head are compared with the basic restrictions and reference levels recommended in the ICNIRP guidelines to complete the electromagnetic exposure safety assessment for passengers and pedestrians.
2. Models and Materials
2.1. The Electric Vehicle Model
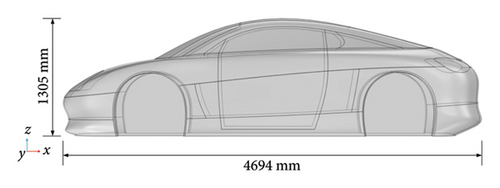
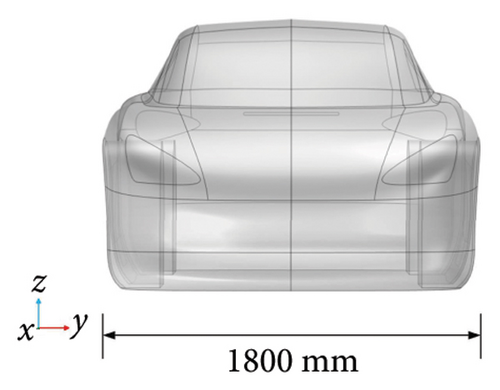
The electric vehicle model is shown in Figure 3. The size and material of the model used are similar to those of a typical city vehicle [28], whose size is 4694 × 1800 × 1305 mm. The body material is mainly made of aluminum (conductivity σ = 3.77 × 10⁷ S/m; relative permittivity εr = 1) and glass (conductivity σ = 1 × 10⁻¹⁴ S/m; relative permittivity εr = 4.2). The door material is polycarbonate and acrylonitrile butadiene styrene (PC + ABS; conductivity σ = 1 × 10⁻¹⁶ S/m; relative permittivity εr = 2.644) composite [29]. On this basis, according to research [30], the EMF generated in the vehicle by external or internal sources is only slightly affected by materials used in the vehicle, such as foam and thin plastic. Therefore, the interior simulation of the electric vehicle model is filled with air to reduce the overall computational grid size.
2.2. The Human Model
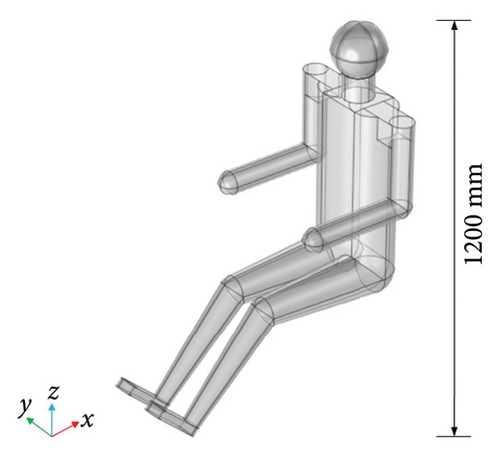
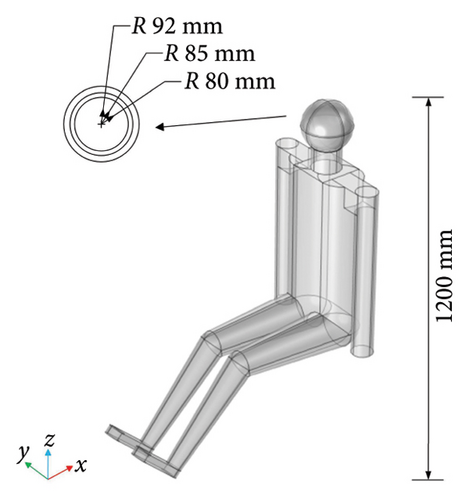
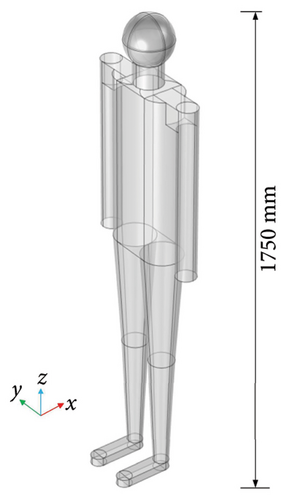
The driver sitting model, the passenger sitting model, and the pedestrian standing model are shown in Figure 4. All human models refer to a male adult with a standing height of about 1.75 m, which is commonly used in China. And the human sitting model is also built according to the scale. The size of standing model is 292 × 520 × 1750 mm, and the size of sitting model is 976 × 520 × 1200 mm. The human head model adopts the widely used three-layer spherical model [31–33]. The head tissues from outside to inside are the scalp layer, the skull layer, and the brain layer. And the corresponding radii are 92, 85, and 80 mm in turn. The simple model cannot meet the requirements for subsequent research, so the relative permittivity and conductivity of various human tissues operating at 24 GHz should be obtained according to the fourth-order Cole-Cole model [34–36]. Among them, the relevant dielectric parameters of the brain are taken as the average values of white matter, gray matter, and cerebrospinal fluid. And the relevant dielectric parameters of the torso are taken as the average values of skin, bone, muscle, and blood. The relative permittivity and conductivity of each tissue operating at 24 GHz are shown in Table 1.
| Tissue | Relative permittivity | Conductivity (S/m) |
|---|---|---|
| White matter | 18.041 | 19.037 |
| Gray matter | 23.618 | 26.755 |
| Cerebrospinal fluid | 31.921 | 38.856 |
| Brain | 24.527 | 28.216 |
| Skin | 18.993 | 22.841 |
| Skull | 5.544 | 4.481 |
| Blood | 27.077 | 32.951 |
| Muscle (skeletal muscle) | 27.395 | 29.437 |
| Torso | 19.752 | 22.428 |
2.3. The Antenna Model
2.3.1. The Single-microstrip Antenna Model
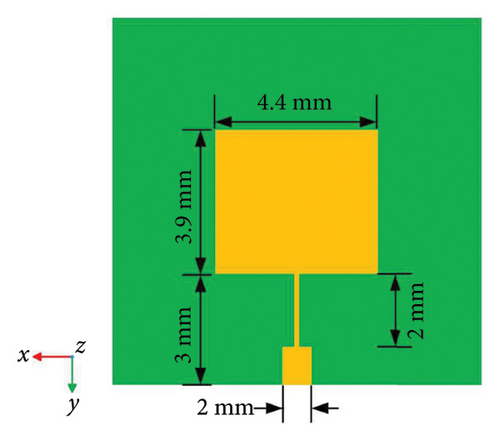
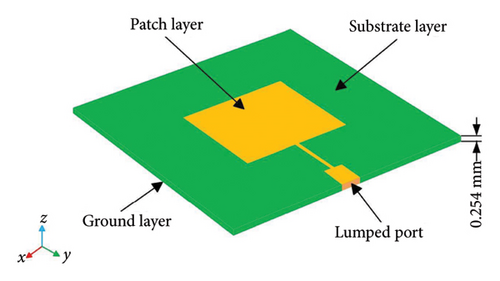
After optimizing the antenna parameters, the microstrip antenna with a resonant frequency of 24 GHz is shown in Figure 5. The size of the conductive patch is 4.4 × 3.9 mm. The size of the 1/4 wavelength impedance converter is 0.13 × 2 mm. The size of the 50 Ω microstrip line is 0.78 × 1 mm. And the thickness of the dielectric substrate is 0.254 mm. On this basis, the materials of patch layer and ground layer are set as perfect electric conductor (PEC). And the dielectric substrate is Rogers RT5880 [42] (relative permittivity εr = 2.2; loss angle tan δ = 0.0009).
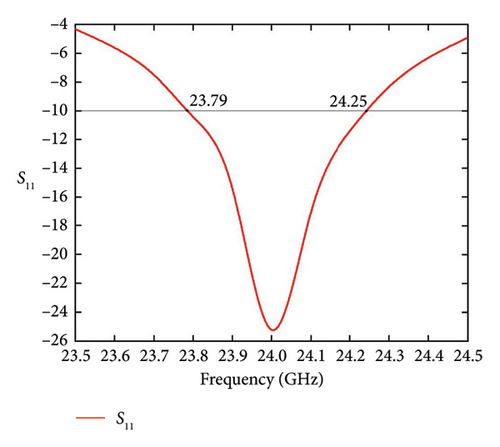
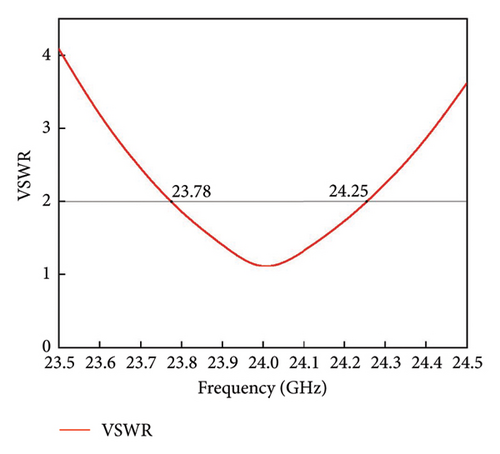
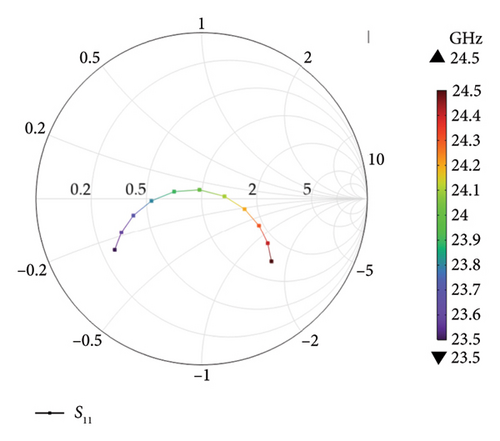
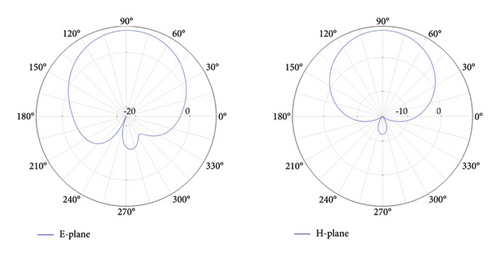
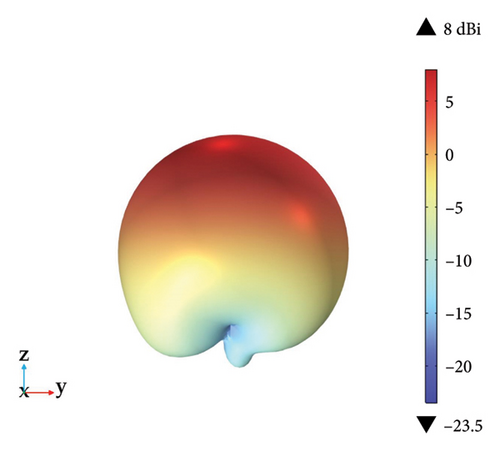
The specific characteristic parameters are shown in Figure 6. The designed microstrip antenna has the S11 parameter of −25.218 dB at 24 GHz. The bandwidth of −10 dB is from 23.79 to 24.25 GHz. And the bandwidth of VSWR < 2:1 is from 23.78 to 24.25 GHz. Smith diagram shows how the input impedance of the designed microstrip antenna varies with frequency. It can be seen that the antenna matches a transmission line with a characteristic impedance of 50 Ω at 24 GHz very well. Due to the transmission line, there is a slight asymmetry in the two-dimensional (2D) radiation pattern of E-plane, while 2D radiation pattern of H-plane is relatively symmetrical. And the 3D radiation pattern shows a maximum gain of about 8 dBi.
2.3.2. The Array Antenna Model
Since the performance of a single-microstrip antenna cannot meet the requirements of the short-range vehicle-mounted radar, studies [37–40] have employed feeding and spatial arrangement of individual microstrip antenna to form the array antenna. Thereby, it can be applied to vehicle-mounted radars. The physical characteristics of an array antenna are mainly reflected in its ability, such as directivity, gain, and beam control, to enhance or change the performance by combining multiple elements. By rationally arranging multiple elements, the array antenna can achieve higher gain in a specific direction, thereby improving the efficiency of signal reception or transmission. Moreover, it can reduce the radiation in undesired directions and achieve higher directivity as well as total gain. At the same time, the array antenna can adjust the direction and shape of the radiation beam as needed, enabling it to cover specific areas or track moving targets. Because the design and configuration of the array antenna can be adjusted according to specific application requirements, it is widely used in vehicle-mounted radars. On this basis, the vehicle-mounted radar has high accuracy requirements to achieve more accurate control and collision prevention for protecting the safety of drivers. The adoption of low sidelobe array antenna is more conducive to the realization of high precision and angular resolution in the vehicle-mounted radar system. It enables the vehicle to avoid collisions more accurately, while reducing the probability of false detection and misjudging objects [43]. In addition, the optimized low sidelobe array antenna can reach the high gain, which is critical for detecting objects at greater distances and improving the accuracy of whole radar systems [44].
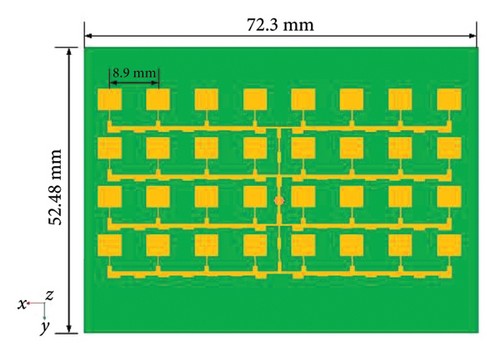
Generally, the array antenna with high gain and low sidelobe needs to meet the total gain above 20 dBi and the sidelobe level on E/H-plane below the main lobe level by 20 dB. The series-fed network based on Dolph–Chebyshev current distribution proposed in study [45] can meet the above requirements. As shown in Figure 7, the final design of a complete fed network is mirror-symmetric. Taking the design of eight-element Dolph–Chebyshev series-fed array antenna as an example, after presetting the sidelobe level required, the ratio of current flowing through each element I1: I2: I3: I4 can be calculated according to the Dolph–Chebyshev distribution and the number of elements in the network. Subsequently, a type of series-fed network used in this study is that the total transmission line is alternating distribution of main line impedance and different subline impedance. Finally, the array antenna and the whole series-fed network can be totally matched at 24 GHz, so that the optimized array antenna can achieve low sidelobe level and high gain. All impedance in the series-fed network can be calculated according to formulas in Table 2. On this basis, N represents the number of elements in the right half of the series-fed network, ZL represents the antenna impedance (50 Ω), Z0 represents the main line impedance of the single-frequency series-fed network (51.17 Ω), Zi represents the subline impedance of the single-frequency series-fed network (Ω), and ki represents the ratio of the current flowing through the adjacent elements.

| N | Z0 ~ ZN−1 |
|---|---|
| 2 | |
| 3 |
|
| 4 |
|
| … | … |
| N |
|
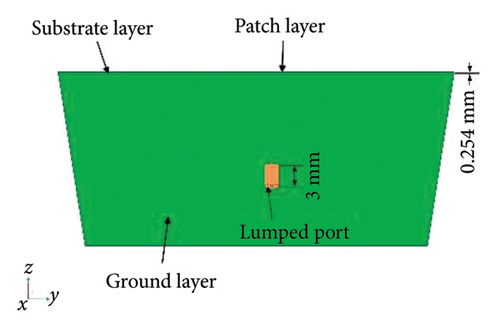
The array antenna is shown in Figure 8. The total size is 72.3 × 52.48 × 0.254 mm. The array antenna uses a lumped port and is fed by a coaxial cable. Among them, the characteristic impedance of the coaxial cable is 50 Ω. The inner conductor radius is 0.3 mm. The outer conductor radius is 1 mm. And the transmitted power is 0.1 W [21]. Finally, the harmonic signal with about 0° phase shift at 24 GHz is used to stimulate all elements.
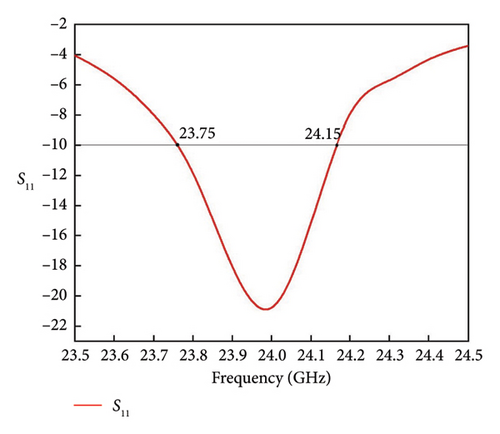
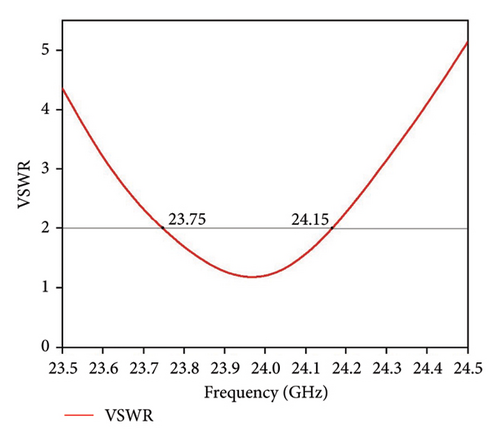
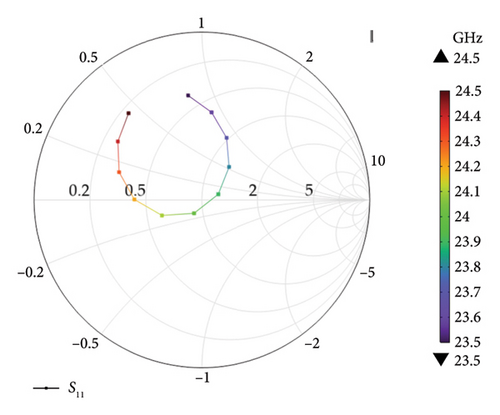
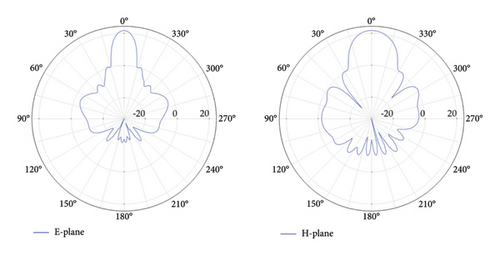
The specific characteristic parameters are shown in Figure 9. The designed array antenna has the S11 parameter of −20.786 dB at 24 GHz. The bandwidth of −10 dB is from 23.75 GHz to 24.15 GHz. The bandwidth of VSWR < 2:1 is from 23.75 GHz to 24.15 GHz. Smith diagram shows how the input impedance of the designed array antenna varies with frequency. It can be seen that the antenna matches a coaxial cable line with a characteristic impedance of 50 Ω at 24 GHz very well. The E/H-plane sidelobe level on average is 20 dB lower than the main lobe level in the 2D radiation pattern. Moreover, the beamwidth of E-plane is 11.2° and the beamwidth of H-plane is 21.9°. The 3D radiation pattern shows a maximum gain of about 21.7 dBi, where the main lobe of the array antenna is in the beam direction.
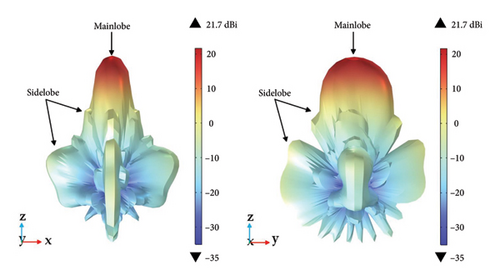
In addition, Table 3 compares the relevant work from references [37–40] with the 24-GHz antenna designed in this study. It can be seen that using different numbers of elements and different techniques has varying impacts on the performance of the microstrip array antenna.
| Ref. | Center frequency (GHz) | Bandwidth (%) | Element number | Peak gain (dBi) | Sidelobe level (dB) | Beamwidth (degree) | Features |
|---|---|---|---|---|---|---|---|
| [37] | 24 | 4.17 | 64 | 22.50 | −20 | N/A | Slot patch |
| [38] | 24 | 8.30 | 8 | 12.50 | −15 | 46 × 21.5 | Patch |
| [39] | 24 | 2.75 | 6 | 11.04 | −20.59 | 16.2 × 100.8 | Shorted parasitic |
| [40] (series) | 24 | 6.25 | 64 | 25.90 | −24.50 | 15 × 13.3 | E-shaped |
| [40] (corporate) | 24 | 4.17 | 64 | 25.20 | −14 | 8.2 × 8.5 | E-shaped |
| This study | 24 | 1.67 | 32 | 21.70 | −20 | 11.2 × 21.9 | Patch |
2.4. The Simulated Exposure Scenarios
The specific positions of antennas inside the electric vehicle are shown in Figure 10. All antennas are mirror-symmetric in terms of XOZ plane. Moreover, both the vehicle model and the antenna model are built geometrically based on the real size, with no scaling or approximation.
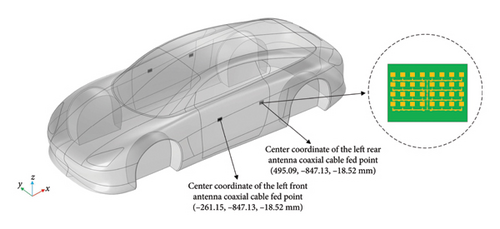
For evaluating the doses of RF-EMF absorbed by the passenger sitting model and the pedestrian standing model at different positions, the simulated exposure scenarios are shown in Figures 11, 12, and 13. Figure 11 simulates the passengers in the electric vehicle exposed to the radiation from the 24-GHz antennas at different positions. The simulated exposure scenario consists of a driver sitting model, three passenger sitting models, and antennas installed inside the electric vehicle doors. The positions of the driver sitting model, the passenger sitting models, and the antenna models are shown in Figure 11. In the whole exposure scenario, the positions of each model are mirror-symmetric with respect to XOZ plane.
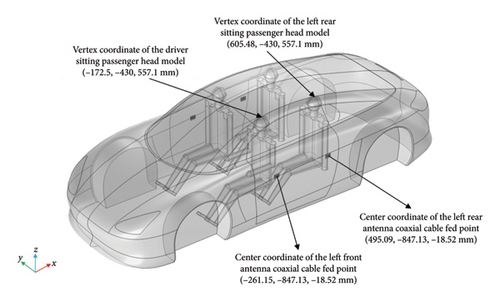
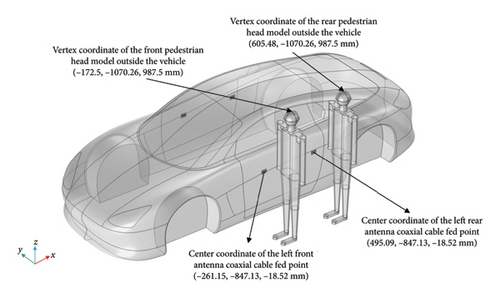
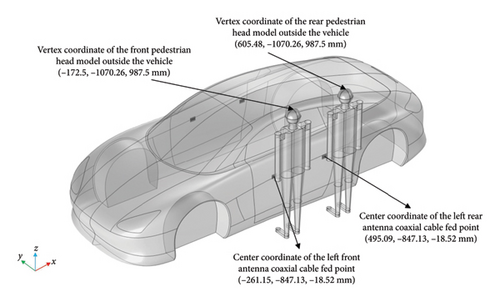
Figure 12 simulates the pedestrians outside the electric vehicle exposed to the radiation from the 24-GHz antennas at different positions. It consists of two pedestrian standing models orthogonal to antennas and the antennas installed inside the electric vehicle doors. Figure 12 shows the positions of the pedestrian standing models and the antenna models, in which the antenna models are also mirror-symmetric about the XOZ plane.
The simulated exposure scenario shown in Figure 13 is based on Figure 12. The angle between the pedestrian standing models and the antenna models is modified. In this scenario, the pedestrian standing models are frontal to the antenna models. The positions of the pedestrian standing models and the antenna models are shown in Figure 13.
For analyzing and calculating the influence of RF-EMF generated by antennas on humans, this study adopts COMSOL Multiphysics software to solve the coupling problem of EMF and thermal field. This software has been applied in bioelectromagnetic research widely. For example, Bhargava [46] et al. analyzed the SAR values and temperature rises of 3D heterogeneous human head model overexposed to the radiation from the mobile phone at different positions. The multiphysics field coupling problems finally were solved very well.
Moreover, EMFs are spatially and temporally discretized in the spatial computing domain during the calculation process. Therefore, the domain must be limited by appropriate boundary condition. On this basis, a perfectly matched layer (PML) is constructed at the boundary of the computational domain in this study. The computational domain in this study includes the 3D electric vehicle model, the driver sitting model, the passenger sitting model, the pedestrian standing model, and the 24-GHz antenna model. To make each simulation scenario closer to reality, different models are discretized with varying sizes of grids. As a result, the total number of grid units in the different exposure scenarios reaches approximately the million scale.
3. EMF Principles
3.1. Electromagnetic Wave Propagation Analysis Equation
In the designed array antenna, the lumped port is located at the bottom of the coaxial cable, which is between the outer conductor and the inner conductor, as shown in Figure 14.

3.2. The Interaction Between Electromagnetic Wave and Human Tissue
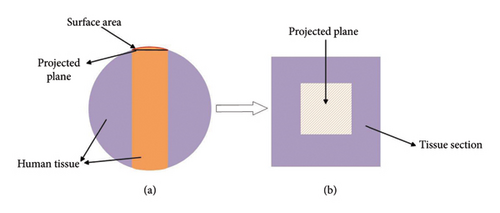
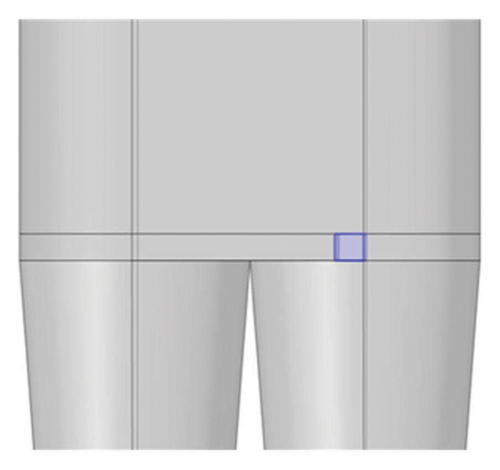
Since there is no clear definition of the Sab value calculation method in the existing standard, this study calculates the Sab value of nonplanar human tissues according to literature [48]. The human forearm model constructed in this paper is a cylindrical model. In the subsequent simulation process, a projected square of 4 cm2 is used to approximately replace the area of 4 cm2 on the surface of human tissues. The specific method is shown in Figure 15.
3.3. Heat Transfer Analysis Equation
In order to solve the heat transfer problem in the human model, particularly the temperature rise of head tissues, Pennes’ bioheat equation can be used. The equation takes into account heat conduction, blood perfusion effect, and external heat sources. The thermal characteristics of human head tissues required in the calculation process are shown in Table 4 [46, 49]. In addition, the materials of the electric vehicle may have an impact on the temperature rise of head tissues. All thermal characteristics of the electric vehicle materials are shown in Table 5, with all values obtained from the COMSOL Multiphysics software material library and reference [29].
| Tissue | ρ/(kg m−3) | k/(W (m °C)−1) | C/(J (kg °C)−1) | Qmet/(W m−3) | ωb/(s−1) |
|---|---|---|---|---|---|
| Scalp | 1125 | 0.42 | 3600 | 1620 | 0.02 |
| Skull | 1990 | 0.37 | 3100 | 610 | 0.000463 |
| Brain | 1038 | 0.53 | 3650 | 7100 | 0.00883 |
| Material | ρ/(kg m−3) | k/(W (m °C)−1) | C/(J (kg °C)−1) |
|---|---|---|---|
| Aluminum | 2700 | 238 | 900 |
| Glass | 2210 | 1.4 | 730 |
| PC + ABS | 1130 | 0.141 | 1760 |
3.4. Computational Verification
3.4.1. The Antenna Characteristic Parameter Verification
To verify the feasibility of using COMSOL software to design an antenna, this study has reproduced a dual-band patch antenna with paired L-shape slots from reference [50]. The schematic diagram of the published antenna is shown in Figure 16. The antenna is fabricated on a substrate called FR-4 (relative permittivity εr = 4.3; loss angle tan δ = 0.02) of 1.6 mm thickness. The concrete parameters of the antenna are listed in Table 6.
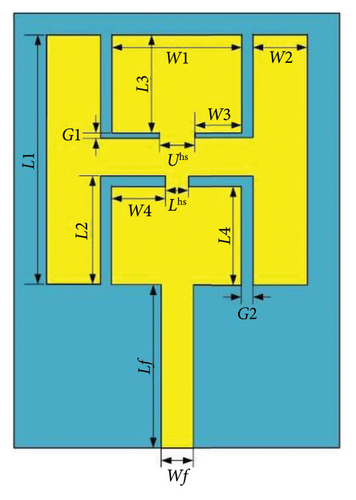
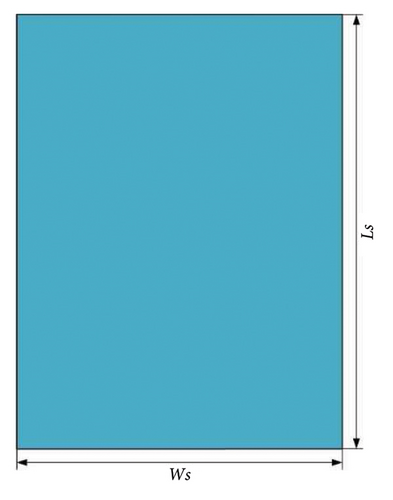

| Parameters | Values (mm) |
|---|---|
| Ls | 40 |
| Lf | 15 |
| L1 | 23 |
| L2 | 10 |
| L3 | 9 |
| L4 | 9 |
| G1 | 0.5 |
| Lhs | 2 |
| Ws | 30 |
| Wf | 3 |
| W1 | 12 |
| W2 | 5 |
| W3 | 4.4 |
| W4 | 5 |
| G2 | 1 |
| Uhs | 3.2 |
The characteristic parameters of the reproduced antenna are shown in Figure 17. It can be observed that the antenna resonates at 2.47 and 5.8 GHz. The reflection coefficients are −21.2 dB at 2.47 GHz and −25.0 dB at 5.8 GHz. The operational bandwidth of the antenna is from 2.44 to 2.5 GHz (2.429%) at 2.47 GHz, and from 5.76 to 5.93 GHz (2.931%) at 5.8 GHz. The 2D radiation patterns show an approximately omnidirectional arrangement (along the E-plane) and a directional arrangement (along H-plane) at 2.47 GHz. Moreover, a broadsided directional pattern emerges along the E-plane and an isotropic pattern emerges along the H-plane at 5.8 GHz. The peak gains of the antenna are found to be 4.98 dBi at 2.47 GHz and 6.27 dBi at 5.8 GHz.
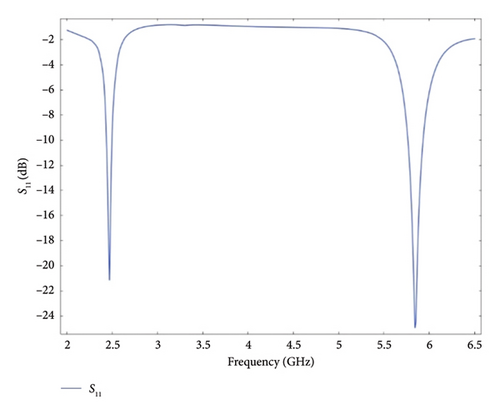
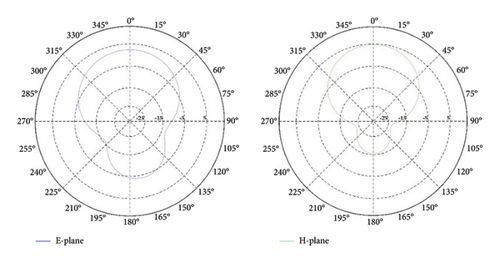
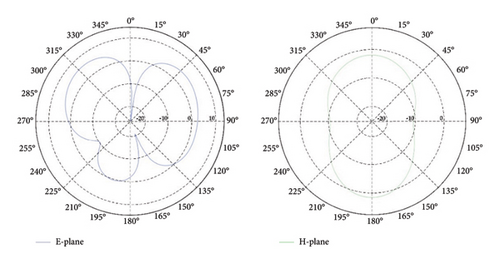
Table 7 compares the characteristic parameters of the antenna in reference [50] with the reproduced results in this study. It can be observed that all error ratios between the published results and the reproduced results are small. Except that the resonant frequency at 2.45 GHz is slightly shifted to 2.47 GHz and the 2D radiation patterns are slightly deformed compared to those at 2.45 GHz in reference [50], the other parameters can meet the antenna design requirements. It proves that the design of antennas in COMSOL software is viable.
| Parameters | Reference [50] | This work | ||
|---|---|---|---|---|
| Resonant frequency | 2.45 GHz | 5.8 GHz | 2.47 GHz | 5.8 GHz |
| S11 | −33.2 dB | −24.8 dB | −21.2 dB | −25.0 dB |
| Bandwidth | 2.4–2.48 GHz | 5.72–5.9 GHz | 2.44–2.5 GHz | 5.76–5.93 GHz |
| Peak gain | 5.08 dBi | 6.32 dBi | 4.98 dBi | 6.27 dBi |
3.4.2. The SAR and Temperature Verification
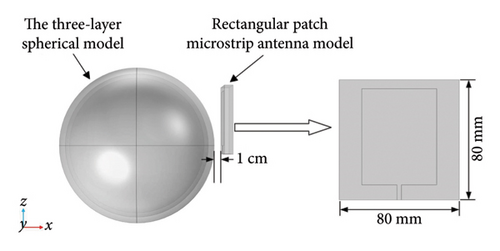
To verify the accuracy of models and methods constructed in this study, a comparison is made with SAR and temperature on cross-section of human head obtained in reference [49] when the mobile phone is positioned for voice communication. On this basis, the same mobile phone antenna in [49] is constructed as shown in Figure 18. At the same time, the antenna is kept 1 cm from human head tissues. The operating frequency is 900 MHz, and the input power is 1 W to stimulate. In addition, the human head model also uses a three-layer spherical model. The dielectric parameters of head tissues at 900 MHz are shown in Table 8. And the thermal parameters are the same as those in Table 4.
| Tissue | Relative permittivity | Conductivity (S/m) |
|---|---|---|
| Scalp | 41.41 | 0.87 |
| Skull | 20.79 | 0.34 |
| Brain | 45.80 | 0.76 |
The obtained SAR and temperature on cross-section of human head are compared with the corresponding values from the study by authors in [49]. The comparison results are shown in Figure 19.
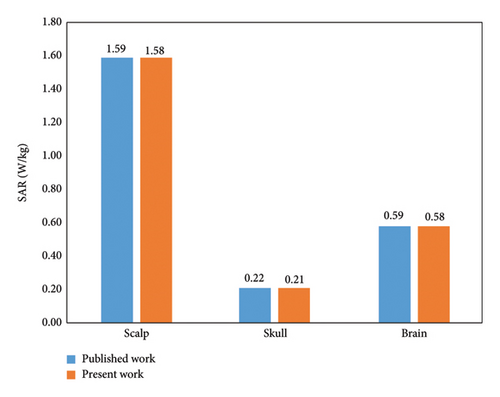
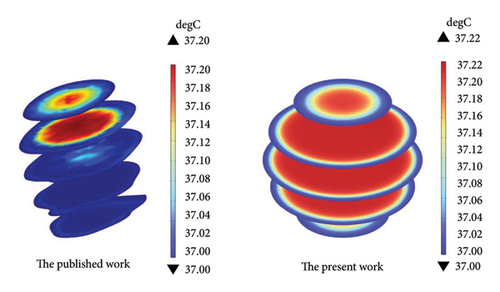
The final simulation results show that the maximum SAR values are 1.58 W/kg for the scalp layer, 0.21 W/kg for the skull layer, and 0.58 W/kg for the brain layer. Compared to the corresponding values of 1.59, 0.22, and 0.59 W/kg obtained in reference [49], the error ratios are 0.6%, 4.5%, and 1.7%. The maximum temperature on cross-section of human head is 37.22°C. Compared to the corresponding value of 37.20°C obtained by authors in [49], the error ratio is 0.05%. Moreover, the temperature on cross-section of human head reveals that the temperature rise of the brain layer is higher than that of the scalp layer, which is in accordance with the temperature variation pattern by authors in [49]. Due to the difference in the structure of the human head model and the precision of mesh division, some discrepancies in the simulation results are unavoidable. However, the error ratios are all less than 5%, which are rational. It indicates that the models and methods used in this study are suitable for electromagnetic simulations.
3.4.3. The Millimeter-Wave Electromagnetic Exposure Assessment Verification
To verify the accuracy of the subsequent calculation results at 24 GHz in this study, the researches in the frequency range of 24 to 100 GHz are collected and summarized for comparing and analyzing. Then, exposure sources, operating frequencies, installation positions, and main conclusions in those researches are summarized as shown in Table 9. The calculated SAR values in this study are almost in the same order of magnitude compared to those in published researches.
| Study name | Frequency, power, and type of EMF source | EMF source position | Main conclusion |
|---|---|---|---|
| Ruddle A. R. [51] | 24/46.8/77 GHz, ADAS radar; plane wave | External source: Radar antenna at a distance of 3 m from the vehicle | Power density and window coupled inside the vehicle: The highest value (0.76 W/m2) was with the 77 GHz radar; the smallest value (0.0005 W/m2) was with the 24-GHz radar. |
| Laakso et al. [52] | 6–100 GHz; pulse duration: 0.1–10 s; 1000 W/m2 power density or 1000 J/m2 energy density; plane wave | Plane wave in air directed toward the face model | Temperature rise in skin (power density: 1000 W/m2; pulse duration: 10 s): The temperature rise decreased with depth. The rapid initial rise in surface appeared above 20 GHz. |
| Temperature rise in face (energy density: 1000 J/m2; pulse duration: 0.1–10 s): The highest temperature rise appeared at 100 GHz for pulse duration of 0.1 s. | |||
| Vilagosh et al. [53] | 30, 60, 90 GHz; pulse duration: 100 or 20 ps; plane wave | Plane wave in air directed toward the ear model at different incident angles (orthogonal, 30° anterior and 45° superior to the ear canal) | The incident power flux density in tympanic membrane was 13.8% of the original maximal signal intensity at 90 GHz. The SAR value of 1.94 W/kg in tympanic membrane was used the equivalent of a general public standard exposure at 90 GHz. A temperature rise of 0.032°C tympanic membrane was used the equivalent of an occupational standard exposure at 90 GHz. |
| Vermeeren et al. [54] | 60 GHz communication module antenna and 79 GHz automotive radar antenna (maximum output power and a 100% duty cycle); plane wave | Measuring spatial-averaged power density place: At a 3–30 mm distance above antennas surface | The communication antenna and the radar antenna correspondingly complied FCC basic restrictions (10 W/m2 averaged over 1cm2) for distances larger than 50 mm and 23 mm. |
4. Results and Discussion
This chapter mainly describes the effects of RF-EMF on passengers and pedestrians at different positions under exposure from different numbers of the antenna. Firstly, the simulated exposure scenarios of one antenna, two antennas, and four antennas inside the electric vehicle doors are constructed. Then, the driver sitting model is placed in the driver seat. The passenger sitting model is successively placed in the copilot seat, the left rear seat, and the right rear seat. Furthermore, the pedestrian standing model is successively orthogonal to the left front antenna and frontal to it. At the same time, this model is also successively orthogonal to the left rear antenna and frontal to it. The impacts of electromagnetic exposure from different numbers of the antenna on passengers and pedestrians at different positions are calculated, respectively. In addition, all results obtained during the simulation are based on the input power of 0.1 W for the antenna. And the relevant dielectric and thermal parameters used in the calculation process are described in Chapter 2 and Chapter 3. Moreover, due to the large-scale computational problems involved in this study, the overall calculation process is carried out on a computer with RAM of 64 GB and CPU of 12th Gen Intel(R) Core(TM) i7-12700H. The average runtime for a single simulation file takes over 30 min, and all computational tasks are eventually completed.
4.1. The SAR Value Distribution
4.1.1. The SAR Value Distribution of Passengers Under Exposure From an Antenna
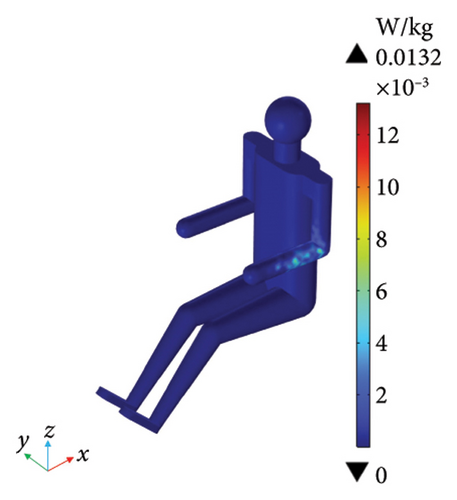
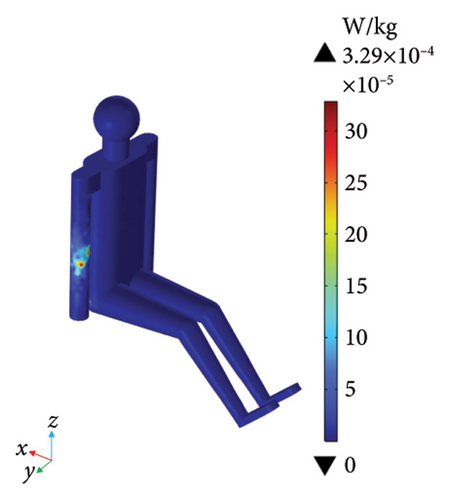
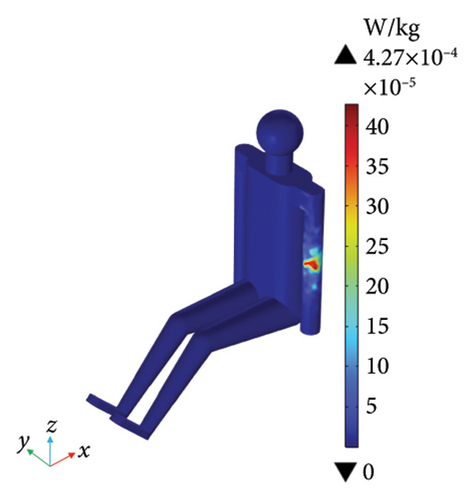
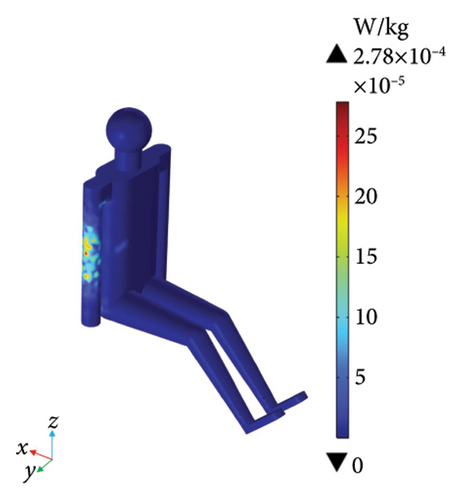
In this section, the antenna with the closest distance to the passenger at different positions is selected as the exposure source. The effects on the SAR values of passengers at different positions under exposure from a single antenna are calculated. The SAR value distribution absorbed by passengers at different positions is shown in Figure 20.
4.1.2. The SAR Value Distribution of Passengers Under Exposure From Two Antennas
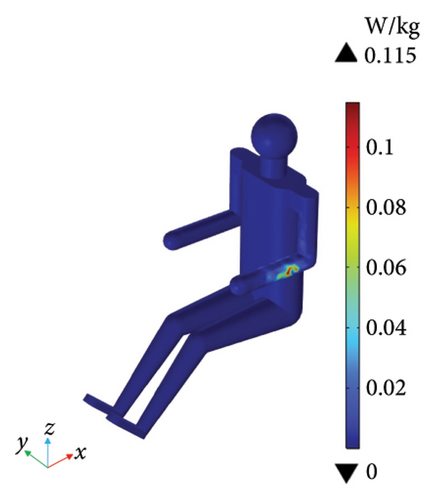
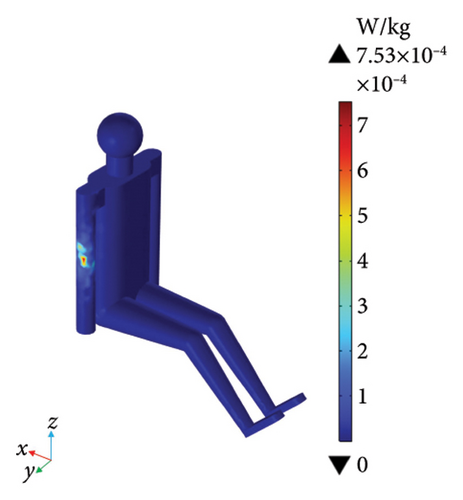
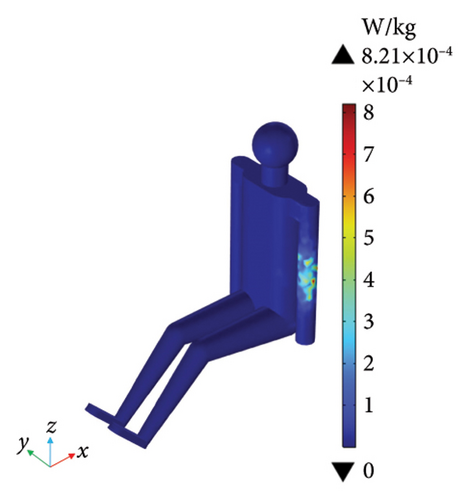
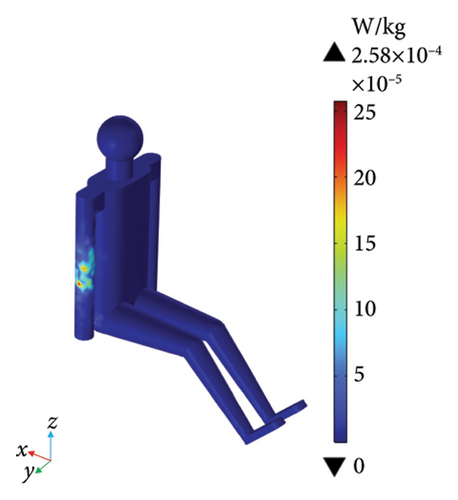
In this section, the antenna closest to the passenger at different positions and the antenna on its opposite side are selected as the exposure sources. The effects on the SAR values of passengers at different positions under exposure from two antennas are calculated. The SAR value distribution absorbed by passengers at different positions is shown in Figure 21.
4.1.3. The SAR Value Distribution of Passengers Under Exposure From Four Antennas
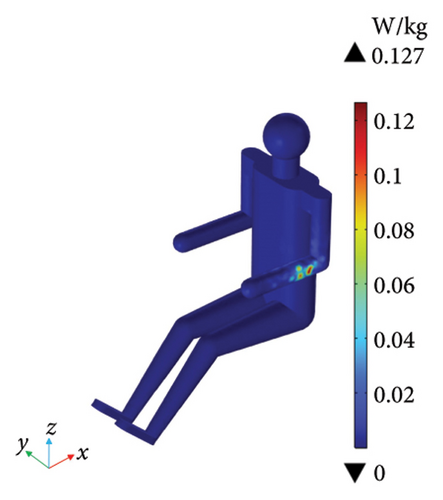
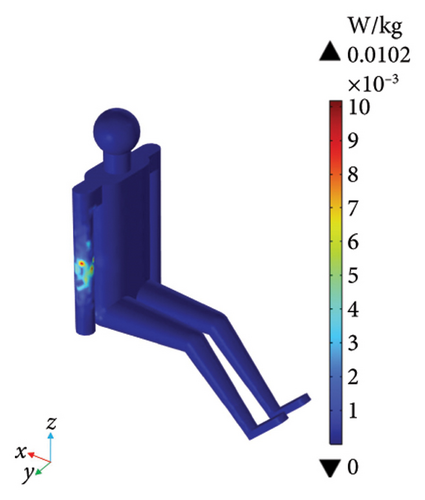
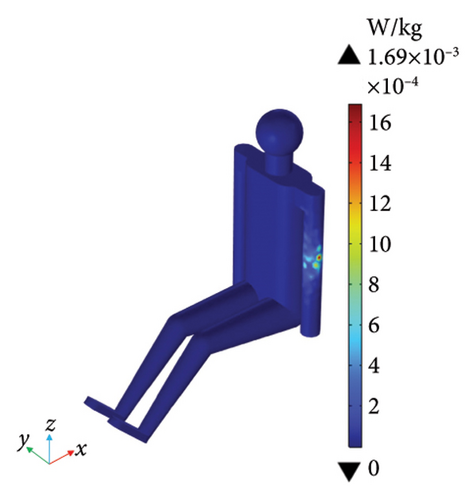
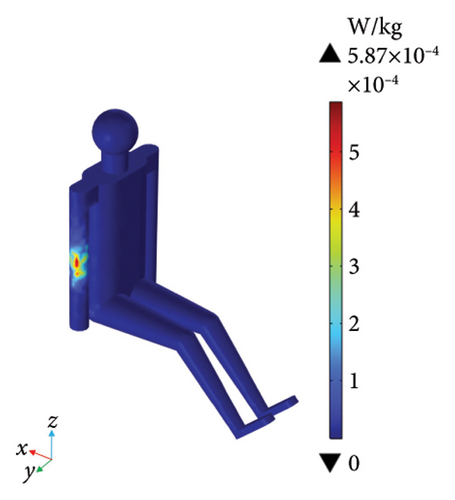
In this section, all the antennas inside the electric vehicle are selected as the exposure sources. The effects on the SAR values of passengers at different positions under exposure from four antennas are calculated. The SAR value distribution absorbed by passengers at different positions is shown in Figure 22.
4.1.4. The SAR Value Distribution of Pedestrians Under Exposure From Four Antennas
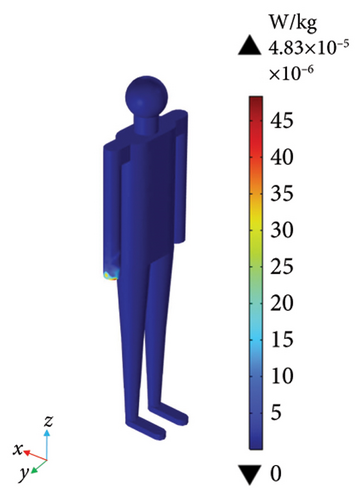
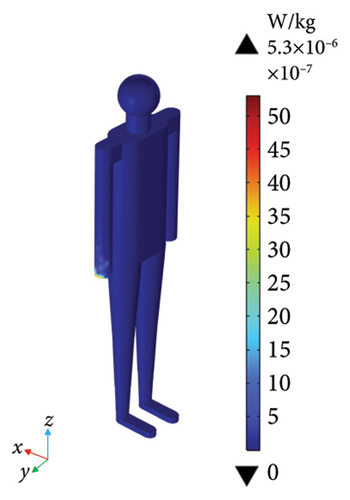
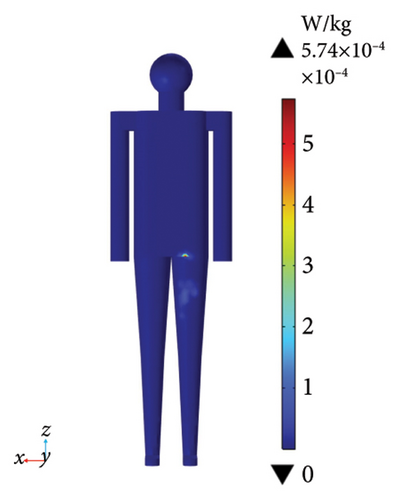
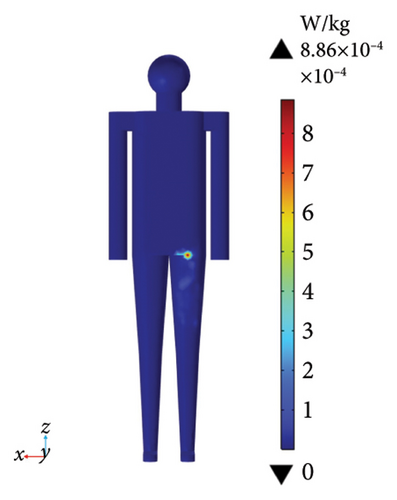
In this section, all the antennas inside the electric vehicle are selected as the exposure sources. The effects on the SAR values of pedestrians at different positions and angles under exposure from four antennas are calculated. The SAR value distribution absorbed by pedestrians at different positions and angles is shown in Figure 23.
4.1.5. The Comparison of SAR Values in Different Antenna Number Exposure Scenarios
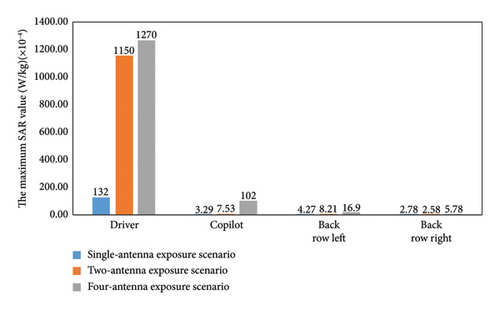
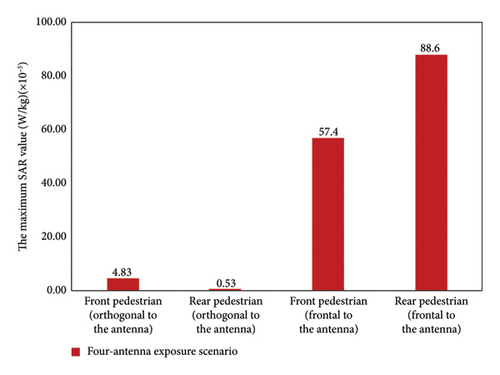
The above four sections, respectively, show the SAR value distribution of passengers and pedestrians at different positions in different antenna number exposure scenarios. To facilitate the analysis of the SAR value distribution patterns on humans, the data from the above four sections have been summarized in Tables 10 and 11. Firstly, the distribution feature of the SAR values is that the maximum SAR values of passengers and pedestrians at all positions appear on the outside of tissues near the 24-GHz antennas. Since the 24-GHz antenna designed is a directional antenna, rather than an omnidirectional antenna, it has a high radiation intensity in a specific direction. The outer tissues near antennas are exposed to the strong EMF in the largest area, and other human tissues are far away from antennas. Therefore, the SAR value distribution of passengers and pedestrians at all positions is limited to the tissues close to antennas and is not obvious in other tissues.
| Position | Maximum SAR value under exposure from an antenna (W/kg) | Maximum SAR value under exposure from two antennas (W/kg) | Maximum SAR value under exposure from four antennas (W/kg) |
|---|---|---|---|
| Driver | 0.0132 | 0.115 | 0.127 |
| Copilot | 3.29 × 10⁻⁴ | 7.53 × 10⁻⁴ | 0.0102 |
| Back row left | 4.27 × 10⁻⁴ | 8.21 × 10⁻⁴ | 1.69 × 10⁻³ |
| Back row right | 2.78 × 10⁻⁴ | 2.58 × 10⁻⁴ | 5.87 × 10⁻⁴ |
| Position | Maximum SAR value under exposure from four antennas (W/kg) |
|---|---|
| Front pedestrian (orthogonal to the antenna) | 4.83 × 10⁻⁵ |
| Rear pedestrian (orthogonal to the antenna) | 5.3 × 10⁻⁶ |
| Front pedestrian (frontal to the antenna) | 5.74 × 10⁻⁴ |
| Rear pedestrian (frontal to the antenna) | 8.86 × 10⁻⁴ |
For ease of comparison, the data in Tables 10 and 11 are plotted in bar charts as shown in Figures 24 and 25. In all exposure scenarios where the passengers are exposed to the antenna radiation, the maximum SAR value of the driver is consistently higher than that of each passenger at other positions. The maximum SAR values of passengers at other positions fluctuate within the same or adjacent order of magnitude. On this basis, the maximum SAR values of passengers in the two rear seats are nearly identical with the same number of antennas. However, there is a significant difference in the maximum SAR values of passengers at the driver seat and copilot seat. The largest difference ranges from 0.0102 to 0.127 W/kg occurring in the scenario with four antennas. In all exposure scenarios where the pedestrians are exposed to the antenna radiation, the maximum SAR values of pedestrians orthogonal to the antenna are always lower than those of pedestrians frontal to the antenna. Additionally, the maximum SAR value of the pedestrian frontal to the left rear antenna is always higher than that of each pedestrian at other positions and angles. The maximum SAR value for this position is 8.86 × 10⁻⁴ W/kg, which is one to two orders of magnitude higher than that of other pedestrian orthogonal to the antenna.
Tables 12 and 13 summarize the SARwb values of passengers and pedestrians at different positions in different antenna number exposure scenarios. The variation pattern of the SARwb value is similar to that of the maximum SAR value. To facilitate a visual comparison, the data in Tables 12 and 13 have been plotted in bar charts as shown in Figures 26 and 27. In all exposure scenarios where the passengers are exposed to the antenna radiation, the SARwb value of the driver is still higher than that of each passenger at other positions. The SARwb values of passengers in the two rear seats fluctuate within adjacent orders of magnitude. The largest difference ranges from 5.53 × 10⁻⁸ to 1.76 × 10⁻⁷ W/kg occurring in the scenario with two antennas. The SARwb values of passengers in the two front seats fluctuate within two orders of magnitude. The largest difference ranges from 9.19 × 10⁻⁸ to 1.56 × 10⁻⁵ W/kg occurring in the scenario with two antennas. In all exposure scenarios where the pedestrians are exposed to the antenna radiation, the SARwb values of pedestrians orthogonal to the antenna are still lower than those of pedestrians frontal to the antenna. Moreover, the SARwb value of the pedestrian frontal to the left rear antenna is still higher than that of each pedestrian at other positions and angles. The SARwb value for this position is 2.68 × 10⁻⁸ W/kg, which is one to two orders of magnitude higher than that of other pedestrian orthogonal to the antenna.
| Position | SARwb value under exposure from an antenna (W/kg) | SARwb value under exposure from two antennas (W/kg) | SARwb value under exposure from four antennas (W/kg) |
|---|---|---|---|
| Driver | 1.67 × 10⁻⁶ | 1.56 × 10⁻⁵ | 1.50 × 10⁻⁵ |
| Copilot | 4.21 × 10⁻⁸ | 9.19 × 10⁻⁸ | 1.89 × 10⁻⁶ |
| Back row left | 7.57 × 10⁻⁸ | 1.76 × 10⁻⁷ | 1.59 × 10⁻⁷ |
| Back row right | 8.69 × 10⁻⁸ | 5.53 × 10⁻⁸ | 1.31 × 10⁻⁷ |
| Position | SARwb value under exposure from four antennas (W/kg) |
|---|---|
| Front pedestrian (orthogonal to the antenna) | 2.27 × 10⁻⁹ |
| Rear pedestrian (orthogonal to the antenna) | 2.59 × 10⁻¹⁰ |
| Front pedestrian (frontal to the antenna) | 7.81 × 10⁻⁹ |
| Rear pedestrian (frontal to the antenna) | 2.68 × 10⁻⁸ |

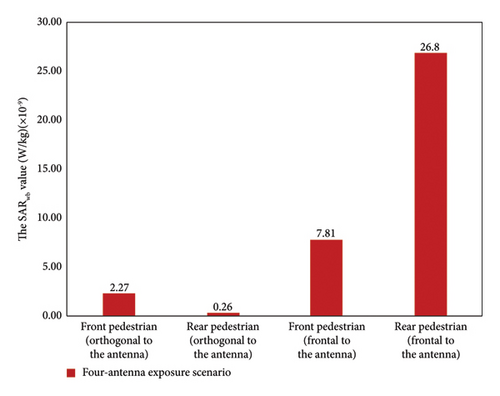
In summary, the reasons for the observed variations are as follows: During the simulation of normally operating an electric vehicle, the driver’s forearms are bent as they grip the steering wheel, while the passengers′ forearms at other positions hang naturally. The driver’s forearms are exposed to a larger area of the strong EMF generated by the antenna inside the left front door, leading to greater energy absorption. As a result, the driver’s maximum SAR value and SARwb value are significantly higher than those of passengers at other positions in all exposure scenarios. Additionally, the maximum SAR values and SARwb values of passengers at all positions tend to increase as the number of antennas increases. This indicates that the larger the area of human tissues directly exposed to the strong EMF in the main lobe direction of antennas, the higher the SAR values. Moreover, since the electric vehicle body shields a portion of EMF generated by antennas, the doses of electromagnetic exposure absorbed by pedestrians outside the electric vehicle are much lower than those absorbed by passengers inside. Furthermore, in all exposure scenarios, the SARwb values of passengers and pedestrians at different positions do not exceed the basic restriction of 0.08 W/kg recommended by the ICNIRP guideline.
4.2. The Absorbed Power Density Sab
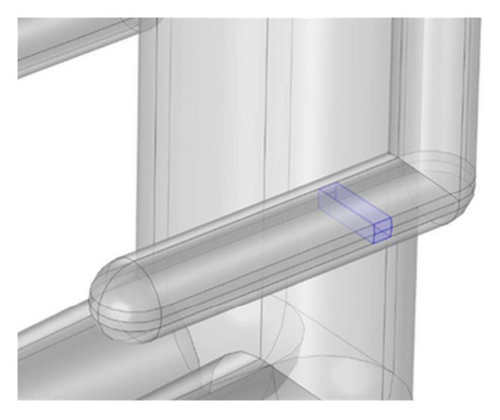
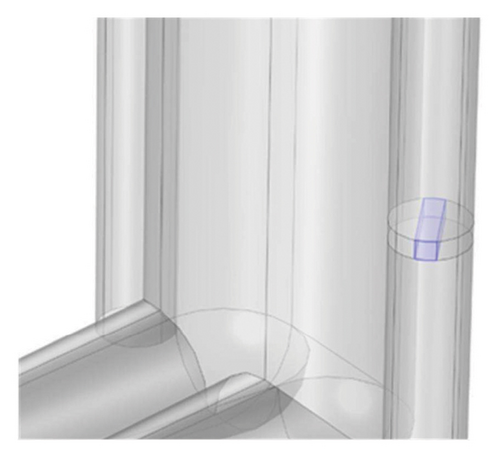
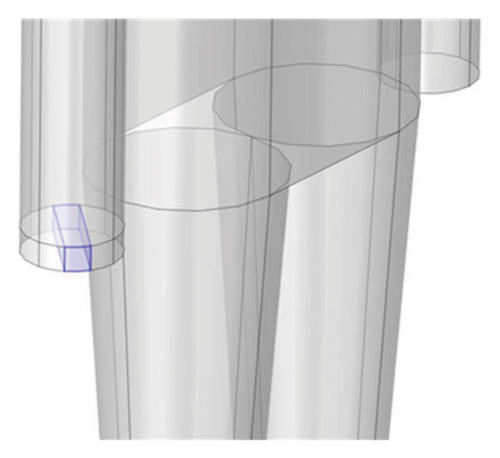
According to the content in Section 3.2, this study uses a projected square of 4 cm2 to approximately replace the area of 4 cm2 on the human tissue surface. On this basis, the ICNIRP guideline states that infinity can be used instead of Zmax when Zmax is much greater than the penetration depth. Considering that in a high-frequency electromagnetic environment, most energy absorbed by humans from EMF is concentrated in the superficial layers of skin tissues. On this basis, according to the SAR value distribution of passengers and pedestrians at different positions in Section 4.1, the Zmax values used are as followed: In all exposure scenarios with passengers inside the electric vehicle, Zmax takes the depth to penetrate the entire forearm tissues. In all exposure scenarios with pedestrians outside the electric vehicle orthogonal to antennas, Zmax takes the depth to penetrate the entire right forearm tissues. In all exposure scenarios with pedestrians outside the electric vehicle frontal to antennas, and Zmax takes the depth to penetrate the entire left lower abdominal tissues. Finally, the segmentation domains used to calculate the Sab values in different exposure scenarios are blue domains as shown in Figure 28. The center coordinates of the projected squares in different exposure scenarios are shown in Table 14.
| Position | Center coordinate |
|---|---|
| Driver | (−261.15 mm, −688.73 mm, 5.1 mm) |
| Copilot | (−199.89 mm, 677.39 mm, −18.52 mm) |
| Back row left | (578.09 mm, −677.39 mm, −18.52 mm) |
| Back row right | (578.09 mm, 677.39 mm, −18.52 mm) |
| Front pedestrian (orthogonal to the antenna) | (−199.89 mm, −1002.87 mm, 107.5 mm) |
| Rear pedestrian (orthogonal to the antenna) | (578.09 mm, −1002.87 mm, 107.5 mm) |
| Front pedestrian (frontal to the antenna) | (−242.5 mm, −990.26 mm, 127.5 mm) |
| Rear pedestrian (frontal to the antenna) | (535.48 mm, −990.26 mm, 127.5 mm) |
In this section, all exposure scenarios are the same as those in Section 4.1. The Sab values of passengers and pedestrians at different positions are shown in Tables 15 and 16. For ease of comparison, the data from Tables 15 and 16 are plotted in bar charts as shown in Figures 29 and 30. In all exposure scenarios where the passengers are exposed to the antenna radiation, the Sab values of passengers in two rear seats are consistently lower than those in two front seats. The Sab value of the driver is significantly higher than that of each passenger at other positions in all scenarios. Furthermore, the Sab values of passengers in two rear seats are nearly identical under exposure from the same number of antennas. The Sab value of each passenger tends to increase as the number of antennas increases, following a trend like the SAR value variations. In the exposure scenario with four antennas, the Sab values of passengers reach their maximums, with the Sab value of the driver being the highest at 2.7301 W/m2. In all exposure scenarios where the pedestrians are exposed to the antenna radiation, the Sab values of pedestrians orthogonal to the antenna are still lower than those of pedestrians frontal to the antenna. Moreover, the Sab value of the pedestrian frontal to the left front antenna is higher than that of each pedestrian at other positions and angles. The Sab value at this position is 0.00289 W/m2, which is two to three orders of magnitude higher than that of other pedestrian orthogonal to the antenna.
| Position | Sab value under exposure from an antenna (W/m2) | Sab value under exposure from two antennas (W/m2) | Sab value under exposure from four antennas (W/m2) |
|---|---|---|---|
| Driver | 0.97 | 1.8356 | 2.7301 |
| Copilot | 0.14761 | 0.26381 | 0.94464 |
| Back row left | 0.00125 | 4.28 × 10⁻⁴ | 0.00501 |
| Back row right | 0.00234 | 0.00673 | 0.00821 |
| Position | Sab value under exposure from four antennas (W/m2) |
|---|---|
| Front pedestrian (orthogonal to the antenna) | 2.76 × 10⁻⁵ |
| Rear pedestrian (orthogonal to the antenna) | 7.99 × 10⁻⁶ |
| Front pedestrian (frontal to the antenna) | 0.00289 |
| Rear pedestrian (frontal to the antenna) | 6.69 × 10⁻⁴ |
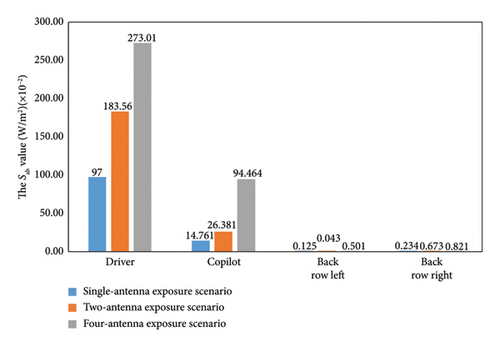
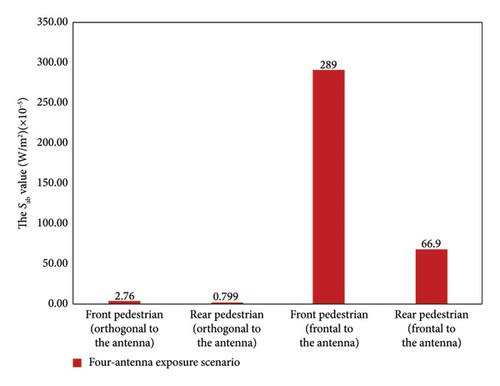
This trend is also similar to the variation in SAR values of passengers and pedestrians at different positions. Additionally, the Sab values of passengers are higher than those of pedestrians, further confirming the consistency between the variation patterns of the Sab values and the SAR values. The partial shielding effect of the electric vehicle body materials on EMF generated by antennas also has been demonstrated. In all exposure scenarios, the Sab values of passengers and pedestrians at different positions and angles are far below the basic restriction of 20 W/m2 recommended by the ICNIRP guideline.
4.3. The Temperatures on Surface and Cross-Section of Human Head
4.3.1. The Temperature on Crosss-Section of the Passenger Head Tissues Under Exposure From an Antenna
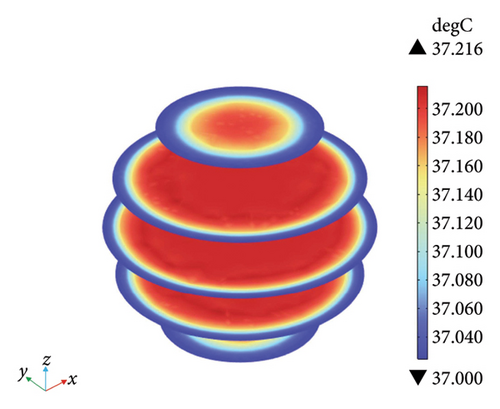
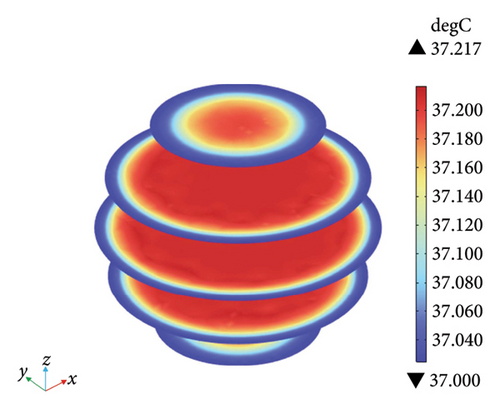
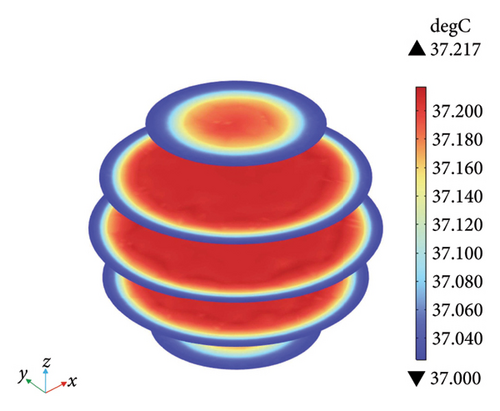
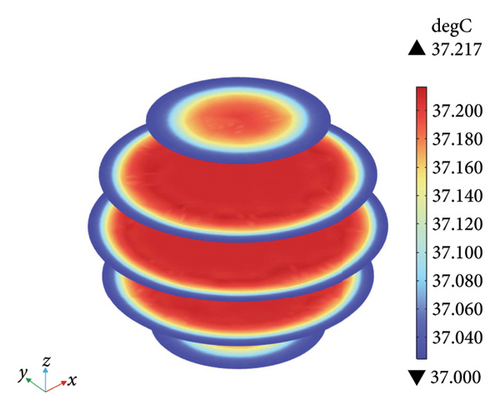
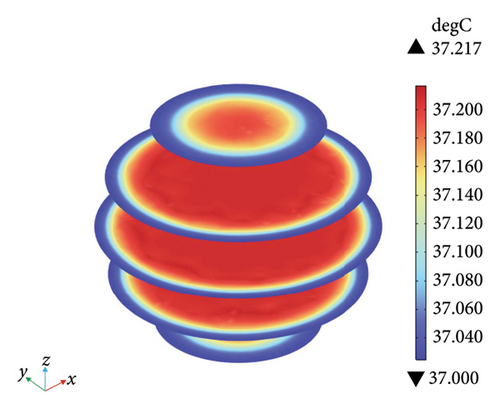
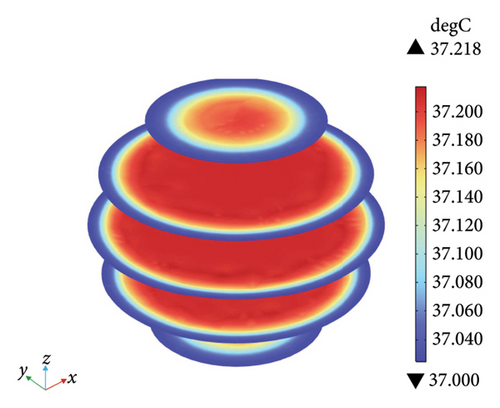
In this section, the exposure scenario is the same as that in Section 4.1.1. When passengers at different positions are irradiated by the antenna for 30 min, the temperature on cross-section of the passenger head tissues is shown in Figure 31.
4.3.2. The Temperature on Crosss-Section of the Passenger Head Tissues Under Exposure From Two Antennas
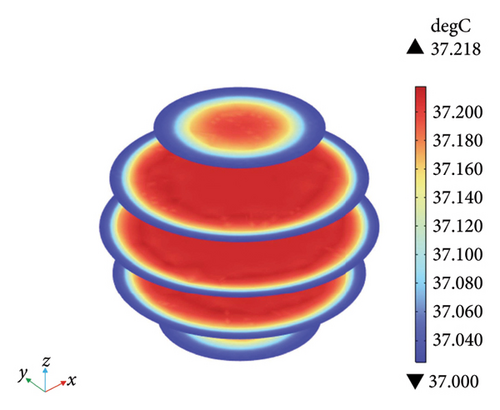
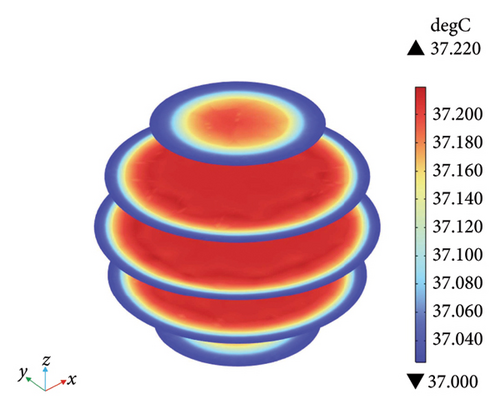
In this section, the exposure scenario is the same as that in Section 4.1.2. When passengers at different positions are irradiated by the antenna for 30 min, the temperature on cross-section of the passenger head tissues is shown in Figure 32.
4.3.3. The Temperature on Crosss-Section of the Passenger Head Tissues Under Exposure From Four Antennas
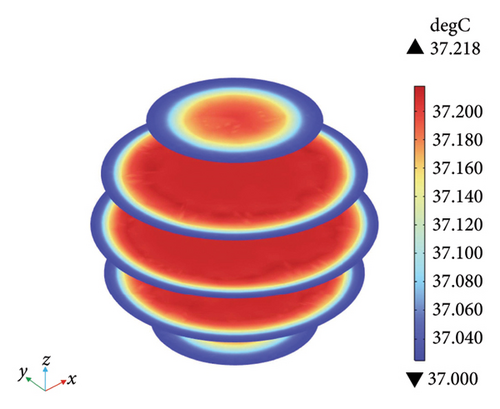
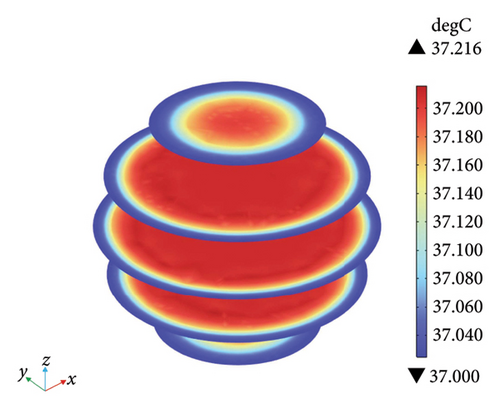
In this section, the exposure scenario is the same as that in Section 4.1.3. When passengers at different positions are irradiated by the antenna for 30 min, the temperature on cross-section of the passenger head tissues is shown in Figure 33.

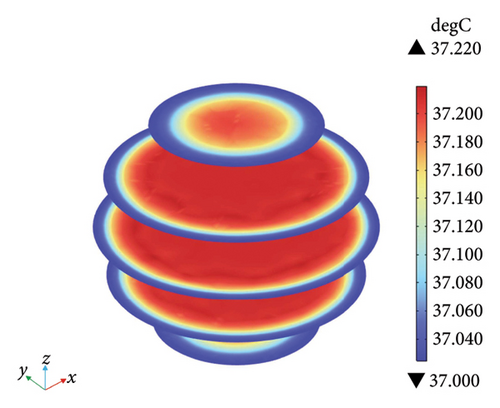

4.3.4. The Temperature on Crosss-Section of the Pedestrian Head Tissues Under Exposure From Four Antennas
In this section, the exposure scenario is the same as that in Section 4.1.4. When pedestrians at different positions and angles are irradiated by the antenna for 30 min, the temperature on cross-section of the pedestrian head tissues is shown in Figure 34.
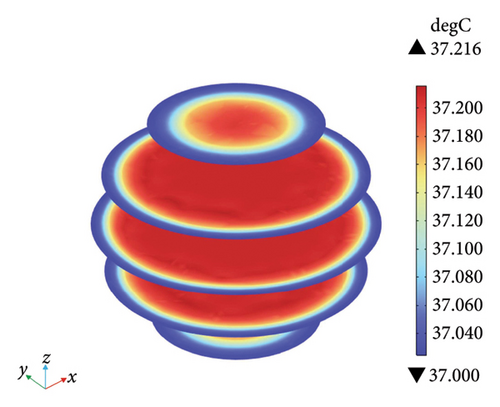
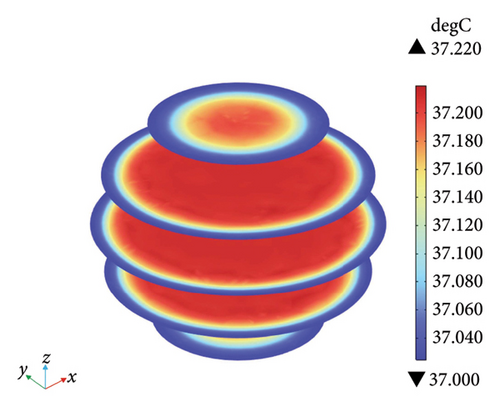
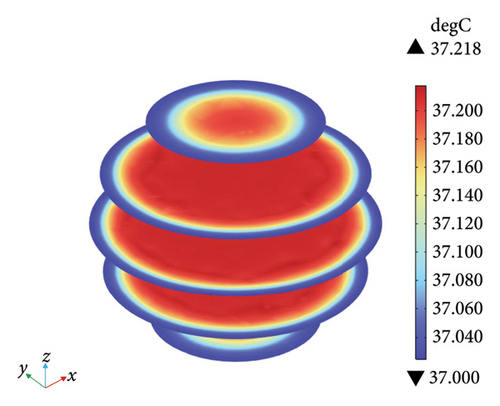
4.3.5. The Comparison of Temperature Rises on Surface and Cross-Section of Human Head in Different Antenna Number Exposure Scenarios
The above four sections show the temperature on cross-section of human head in different antenna number exposure scenarios. The highest temperatures on heads of passengers and pedestrians at different positions are as follows: The highest temperature on head of passenger at driver seat is 37.218°C. The highest temperature on head of passenger at copilot seat is 37.217°C. The highest temperature in head of passenger at left rear seat is 37.220°C. The highest temperature on head of passenger at right rear seat is 37.218°C. The highest temperature on head of pedestrian orthogonal to the antenna is 37.220°C. The highest temperature on head of pedestrian frontal to the antenna is 37.218°C. Tables 17, 18, 19, and 20 summarize the temperature rises on surface and cross-section of human heads at different positions. According to those tables, the characteristic of the temperature variation is that the highest temperature of human head tissues at all positions occurs in the brain layer. The temperatures of all head tissues are successively the brain layer, the skull layer, and the scalp layer from high to low.
| Position | Temperature rise on scalp layer surface (°C) | Temperature rise on skull layer surface (°C) | Temperature rise on brain layer surface (°C) | Temperature rise on head cross section (°C) |
|---|---|---|---|---|
| Driver | 0.030 | 0.066 | 0.169 | 0.216 |
| Copilot | 0.030 | 0.066 | 0.170 | 0.217 |
| Back row left | 0.030 | 0.066 | 0.169 | 0.217 |
| Back row right | 0.030 | 0.066 | 0.170 | 0.217 |
| Position | Temperature rise on scalp layer surface (°C) | Temperature rise on skull layer surface (°C) | Temperature rise on brain layer surface (°C) | Temperature rise on head cross section (°C) |
|---|---|---|---|---|
| Driver | 0.030 | 0.066 | 0.169 | 0.218 |
| Copilot | 0.030 | 0.066 | 0.169 | 0.217 |
| Back row left | 0.030 | 0.066 | 0.171 | 0.220 |
| Back row right | 0.030 | 0.066 | 0.171 | 0.218 |
| Position | Temperature rise on scalp layer surface (°C) | Temperature rise on skull layer surface (°C) | Temperature rise on brain layer surface (°C) | Temperature rise on head cross section (°C) |
|---|---|---|---|---|
| Driver | 0.030 | 0.066 | 0.169 | 0.216 |
| Copilot | 0.030 | 0.066 | 0.169 | 0.217 |
| Back row left | 0.030 | 0.066 | 0.171 | 0.220 |
| Back row right | 0.030 | 0.066 | 0.170 | 0.216 |
| Position | Temperature rise on scalp layer surface (°C) | Temperature rise on skull layer surface (°C) | Temperature rise on brain layer surface (°C) | Temperature rise on head cross section (°C) |
|---|---|---|---|---|
| Front pedestrian (orthogonal to the antenna) | 0.030 | 0.066 | 0.169 | 0.216 |
| Rear pedestrian (orthogonal to the antenna) | 0.030 | 0.066 | 0.170 | 0.220 |
| Front pedestrian (frontal to the antenna) | 0.030 | 0.065 | 0.170 | 0.218 |
| Rear pedestrian (frontal to the antenna) | 0.030 | 0.065 | 0.169 | 0.218 |
To visually compare the sensitivity of different head tissues to heat, the data from Tables 17, 18, 19, and 20 are plotted in bar charts as shown in Figures 35, 36, 37, and 38. After 30 min of exposure, the temperature rises on surface of passenger head tissues are as follows: The temperature rise on scalp surface is 0.030 °C. The temperature rise on skull surface is 0.066 °C. The temperature rise on brain surface ranges from 0.169 °C to 0.171 °C. The temperature rise on cross-section of passenger head ranges from 0.216 °C to 0.220 °C. After 30 min of exposure, the temperature rises on surface of pedestrian head tissues are as follows: The temperature rise on scalp surface is 0.030°C. The temperature rise on skull surface is 0.0655°C by average. The temperature rise on brain surface is 0.1695 °C by average. The temperature rise on cross-section of pedestrian head ranges from 0.216 °C to 0.220 °C. It can be seen that the temperature rises on surface and cross-section of the brain are the most significant in all exposure scenarios and that the brain layer is the most temperature-sensitive region.
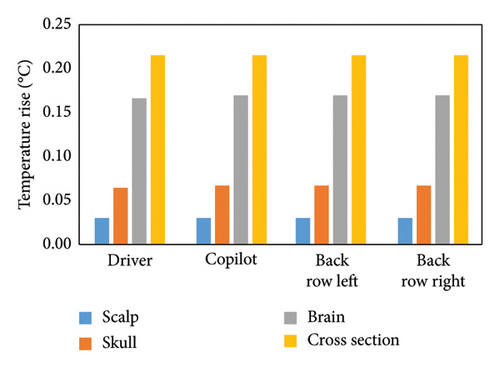
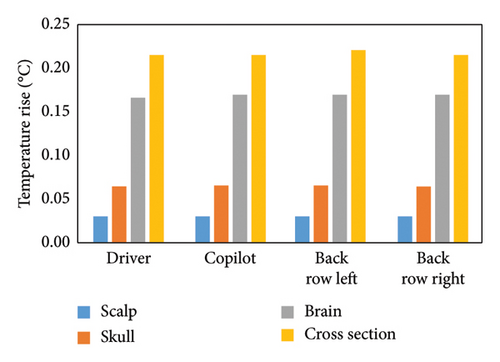
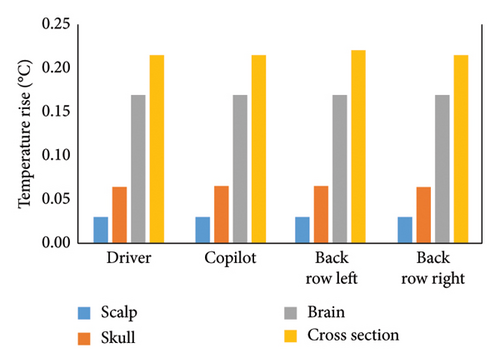
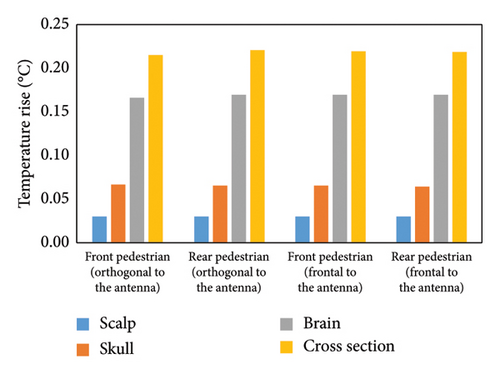
In summary, the reasons for mentioned changes are as follows: The EMF generated by the antenna is absorbed by various tissues of the human head. The absorbed energy is converted into heat, leading to the temperature rises of different head tissues. According to Table 4, the brain has a higher metabolic heat generation rate and a lower blood perfusion rate, resulting in a higher temperature [49]. After 30 min of exposure, the temperature rises on surface and cross-section of brain are higher than those of skin. However, all temperature rises of tissues remain well below the reference level of 2°C for local exposure recommended by ICNIRP, meaning that temperature rises of head tissues will not result in potential physiological damage.
5. Conclusions
In this study, the impacts of EMF generated by the different numbers of 24 GHz antennas on passengers and pedestrians at different positions are simulated. To be more specific, the SAR value distribution, the SARwb value, the Sab value, the temperature rises on surface and cross-section of human head in different exposure scenarios are calculated. It is significant to calculate the above parameters for measuring the electromagnetic exposure doses of human models. In all exposure scenarios, the final patterns are as follows: The SAR distribution of humans at different positions is mainly concentrated in the outer tissues near the antenna. And the local temperature rises of head tissues are successively the brain layer, the skull layer, and the scalp layer from high to low.
Considering varying influences on the electromagnetic exposure doses absorbed by human models, the final simulation results are as follows: In all exposure scenarios where the passengers are exposed to the antenna radiation, the SARwb value of the driver is greater than that of each passenger at other positions. Under exposure from an antenna, the value is 1.67 × 10⁻⁶ W/kg. Under exposure from two antennas, the value is 1.56 × 10⁻⁵ W/kg. Under exposure from four antennas, the value is 1.50 × 10⁻⁵ W/kg. The values are all far lower than the basic restriction of 0.08 W/kg recommended by ICNIRP. In all exposure scenarios where the pedestrians are exposed to the antenna radiation, the SARwb value of the pedestrian frontal to the left rear antenna is greater than that of each pedestrian at other positions and angles. The value is 2.68 × 10⁻⁸ W/kg and is also far lower than the basic restriction of 0.08 W/kg. On this basis, in all exposure scenarios where the passengers are exposed to the antenna radiation, the Sab value of the driver is greater than that of each passenger at other positions. Under exposure from an antenna, the value is 0.97 W/m2. Under exposure from two antennas, the value is 1.8356 W/m2. Under exposure from four antennas, the value is 2.7301 W/m2. The values are all lower than the basic restriction of 20 W/m2 recommended by ICNIRP. In all exposure scenarios where the pedestrians are exposed to the antenna radiation, the Sab value of the pedestrian frontal to the left front antenna is greater than that of each pedestrian at other positions and angles. The value is 0.00289 W/m2 and is also far lower than the basic restriction of 20 W/m2. At the same time, when the antenna irradiation time is 30 min, the maximum local temperature rises on heads of passengers and pedestrians are all 0.220°C, which are far below the reference level of 2°C for local exposure recommended by ICNIRP. The temperature variation of human head tissues in all exposure scenarios does not cause possible physical damage.
Conflicts of Interest
The authors declare no conflicts of interest.
Funding
The research was supported by the National Natural Science Foundation of China ∗ 52467026 ∗ 51867014 and the Department of Education of Gansu Province ∗ 2024CXPT-11.
Open Research
Data Availability Statement
The data that support the findings of this study are available from the corresponding author upon reasonable request.


