Broadband Direction Finding by Phase Correlation With Circular Time-Modulated Array Antennas
Abstract
A broadband direction finding method based on circular time-modulated array antennas (TMAs) is proposed, which utilizes the principle of phase correlation interferometer by analyzing harmonic components to obtain the phase difference between array elements. The two-dimensional baseline characteristics of the circular array enable broadband unambiguous angle condition, significantly enhancing the direction finding accuracy. The impact parameters (including the number of antenna elements and element spacing) on direction finding performance are analyzed in detail by using numerical simulation. The experimental verification is carried out by designing a 7-element array antenna operating at 1–3 GHz. The proposed method effectively mitigates the systematic error as well as the interference from environmental factors, further enhancing the stability and reliability in practical applications.
1. Introduction
Direction finding plays a crucial role and is widely applied in various fields, including radar, mobile communications, and electronic reconnaissance [1–3]. Traditional direction finding algorithms include the interferometer method [4], Watson-Watt method [5], and spatial spectrum estimation [6]. However, high-precision direction finding systems typically require simultaneous sampling by multiple radio frequency (RF) channels and analog-to-digital converters (ADCs), resulting in high costs and complex hardware.
In recent years, intelligent metasurface technology has garnered significant attention due to the ability to flexibly manipulate the scattering characteristics of electromagnetic waves [7, 8]. Compared to traditional direction finding method, intelligent metasurfaces can reduce the complexity of hardware systems. By utilizing a space-time-modulated metasurface, the direction-of-arrival (DoA) estimation can be determined by measuring the delay between different harmonic waveforms generated through the multiplication of the received mixed signal with distinct codes [9–12]. The harmonic characteristic analysis method to implement direction finding is proposed by time-modulated metasurface, which establishes mathematical relationships between the harmonic and fundamental component of received signal to estimate the incident direction [10, 13]. Employing a 1 bit programmable metasurface with two modulation sequences, both the azimuth and elevation angles of far-field signals can be estimated through the analysis of harmonic features in the frequency domain [14]. To further simply analyzing the spatial-spectral characteristics, artificial neural networks have been utilized to directly map harmonic amplitudes to the direction of the source signal [15, 16]. However, the need for additional antennas in most metamaterial-based direction finding schemes compromises system integration. Due to the numerous switchable metamaterial units, the control module and direction finding algorithm will become complicated, and component consistency can adversely affect accuracy [17, 18].
Direction finding based on time-modulated array antennas (TMAs) has also been widely studied in recent years. The primary methods involve subspace-based algorithms for spectral estimation on harmonic data from TMAs [19–21] and the angle of the incident signal through the proportional relationship of specific harmonic orders [22–25]. Chen et al. have achieved 2-element TMA direction finding for linear frequency-modulated signals by using pulse compression methods [26, 27]. Jiang et al. have proposed spatial spectrum estimation method based on the 8-element linear TMAs and a single RF channel [28]. Ni et al. have introduced linear TMAs in simulation featuring a moving phase center, where the proposed method provides reconfigurable bearing accuracy and angle-searching range [29].
Research on TMAs has made remarkable progress in recent years. They only require fewer antenna elements to achieve a more efficient system architecture as compared to metasurfaces. However, current experimental research primarily focuses on line arrays or planar arrays at a narrow frequency band, without venturing into broadband capability studies [17–29]. To address the aforementioned issues, in this work, we propose a circular TMA, which is capable of achieving broadband direction finding. By utilizing the principle of phase correlation interferometry, we analyze harmonic components and obtain the phase difference between array elements. We experimentally verify omnidirectional and high-precision direction-finding performance in a wideband frequency range exceeding three octaves.
2. Theory
2.1. Two-Dimensional Time-Modulated Interferometer for Direction Finding
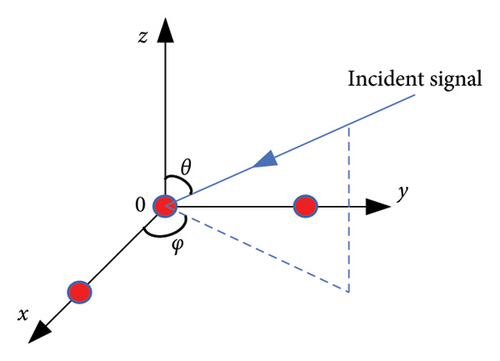
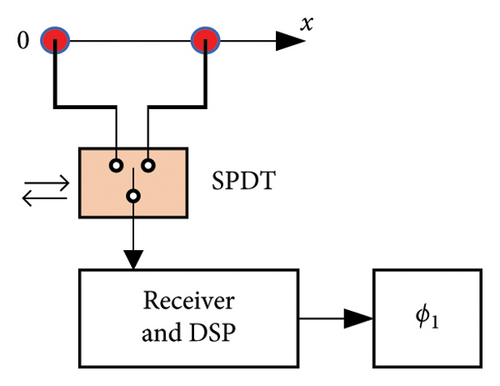
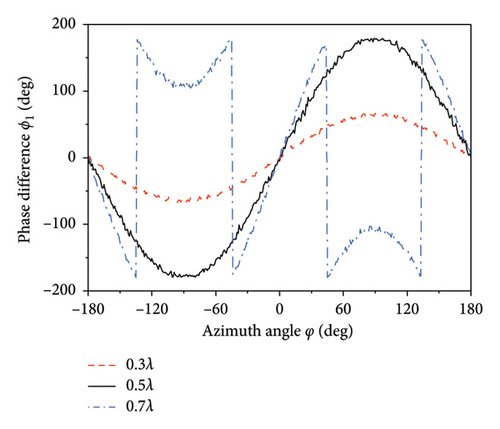
According to equation (7), the value of ϕ1 is located in [−π, π] due to the periodicity of the complex arctangent function. From equation (1), given the azimuth angle φ [−π/2, π/2] and elevation angle θ = 90°, the element spacing must satisfy D < 0.5λ to prevent ambiguity in ϕ1.
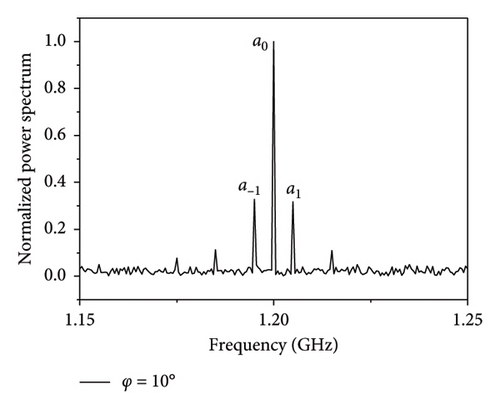
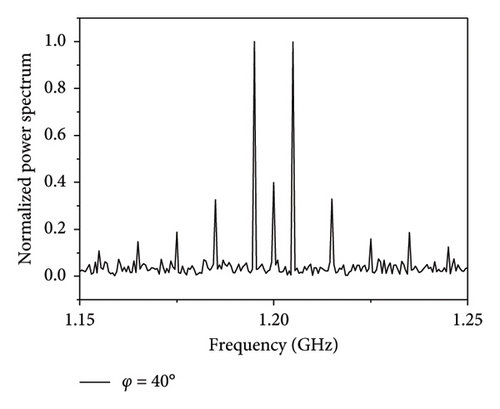
In Figure 1(b), considering a pair of elements along the x-axis with a spacing D of 0.5λ, a signal with a frequency of 1.2 GHz is incident on the TMAs at the angles of φ = 10° and φ = 40°, respectively. The modulation frequency fp of the SPDT switch and the sampling frequency fs of the ADC are set to 5 MHz and 10 GHz, respectively, with the signal-to-noise ratio (SNR) of −10 dB. After sampling data over 10 modulation periods, the power spectrum of the received signal is illustrated in Figure 2. The frequency intervals between harmonic components are 5 MHz, and they are symmetrically distributed around the fundamental component. The proportion of the power between the fundamental component a0 and the first harmonic component a1 varies with the incidence direction φ, which can be calculated by equation (6). According to equation (7), the relationship between the phase difference ϕ1 and the incident angle φ is plotted in Figure 3, which shows that the calculated ϕ1 increases monotonically as φ varies from −90° to 90° at D ≤ 0.5λ. However, as D exceeds 0.5λ, ϕ1 will be multivalued, which means ambiguity angle. The phase difference ϕ2 between the two elements along the y-axis can be calculated through the similar analysis. Finally, the AoA can be determined by substituting ϕ1 and ϕ2 to equation (2).
2.2. Theory of Circular TMA Direction Finding by Phase Correlation
According to the direction finding theory, a longer baseline results in higher direction finding accuracy [30, 31]. However, a baseline longer than half a wavelength leads to ambiguity angle. Unlike the complicated method that resolves ambiguities between long and short baselines [22], the phase correlated interferometer with circular TMAs is proposed to determine the AoA by searching correlation coefficient spectral between the measured phase difference and the prestored phase difference samples.
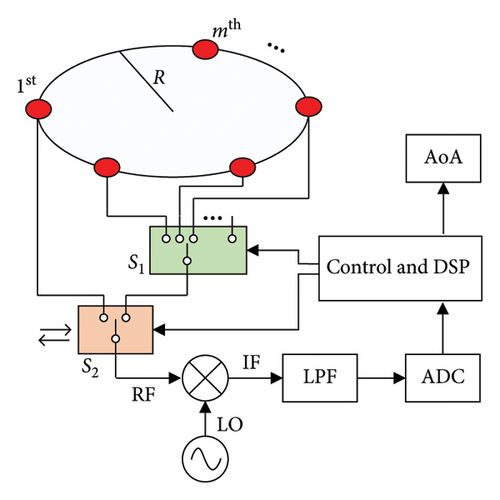
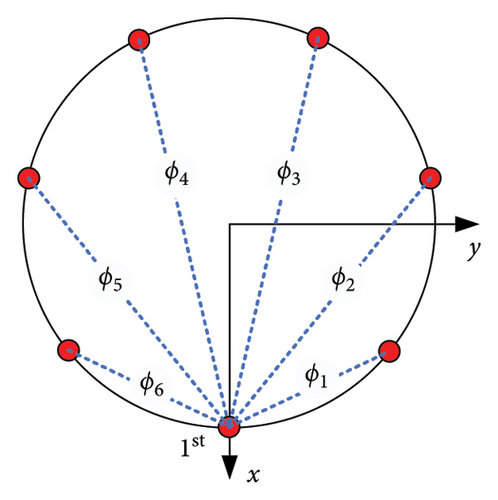
By utilizing switch S1 to select the first element and mth element, an interferometric baseline can be established. The phase difference ϕn between the two selected elements can be measured by employing switch S2 with the time-modulated method, as shown in Figure 1(b). To combine the advantages of both short-long compound baselines and 2D baselines, the rule for selecting baselines is as follows: we fix the first element in the positive direction of the x-axis and then sequentially select another element on the circumference in a counterclockwise direction. This rule will result in a total of N = M − 1 baselines. As shown in Figure 4(b), for the 7-element array, six baselines can be selected, yielding the phase difference vector for the certain incident direction.
The fundamental principle of the phase correlation direction finding method is as follows: if the incident angle is (φ, θ), the correlation coefficient is calculated between measured phase difference vector and the prestored phase difference vectors Φ in the sample library, which covers the incident angle range of [0°, 360°]. The magnitude of the correlation coefficient is related to the proximity of the AoA, and a larger correlation coefficient indicates a closer angle. Therefore, it is necessary to establish a sample library that includes Φ corresponding to known directions. This sample library can be acquired by theoretical calculation or calibration testing. For example, as shown in Figure 4(a), a signal is incident on the circular array with a certain angle of (φ, θ). By selecting N baselines, the measured baseline phase difference vector is denoted as . In the sample library, as the sampling range is φ ∈ [0°, 360°], θ ∈ [0°, 90°], with a sampling step of 1°, we will get a total of 360 × 91 = 32760 original prestored samples , i = 1, 2, …, 32760. Under certain correlation matching criteria, is matched with all phase samples Φi to obtain a series of correlation coefficients ρ. Assuming that sample of the maximum value ρmax is the Kth sample, i.e., ΦK, then the sample direction information corresponding to (ϕK, θK) is the direction of the incident signal. Although the sampling accuracy of the sample library is always limited in practical applications, the accuracy of the correlation calculation can be further improved by interpolating between sample angles.
3. Numerical Simulations
The first simulation shows the effectiveness of the correlation-based direction finding method in resolving ambiguity when the element spacing exceeds 0.5λ. The element spacing D is set to 0.7λ, and a signal with a carrier frequency of 1.2 GHz is incident on the TMAs at the angle of (φ, θ) as (0°, 90°). The modulation frequency of the SPDT switch and the sampling frequency of the ADC are set to 5 MHz and 10 GHz, respectively, with a modulation period of 10 at each baseline. The SNR is set to −10 dB. By using the phase correlation method, AoA is calculated for TMAs with 4, 5, 6, and 7 elements, and the correlation coefficient spectrums are shown in Figure 5. Arrays of different number of elements all exhibit the maximum peak (close to 1) at the angle of 0°. As the number of elements increases, the half-peak width decreases, indicating higher direction-finding accuracy. It is noteworthy that the 4-element array shows the amplitude of the interference peak close to 1 at 180°, while the 6-element array exhibits such peaks at 120° and 240°. Under the low SNR, it can easily lead to direction-finding ambiguity. In contrast, although the 5-element and 7-element arrays also show interference peaks, their amplitudes are more than 0.5. As the number of elements increases, the interference peaks gradually shift toward the main peak, and their amplitudes decrease. The relationship between the interference peaks and the main peak in the correlation curve is different from the regularity of grating lobe appearance with phased array. With a smaller number of elements, odd-numbered arrays exhibit lower interference peaks as compared to even-numbered arrays. For the arrays with 8 elements, as the interference peaks shift toward the main peak and their amplitudes gradually decrease, even-numbered arrays can also achieve good broadband direction finding results.

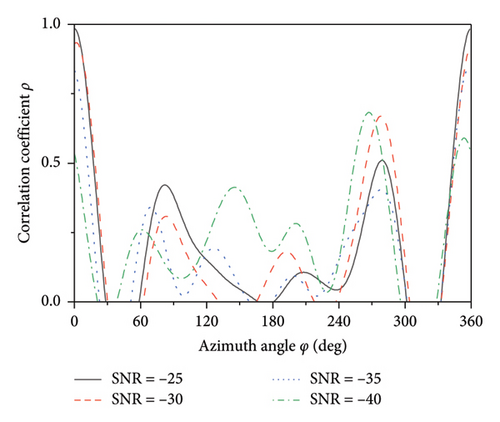
Figure 6 compares the correlation curves of the 7-element array under different SNRs. It can be observed that as the SNR decreases, the amplitude of the main peak gradually diminishes, and the angle corresponding to the peak also shifts, leading to the increase in bearing error. As the SNR reaches −40 dB, the amplitude of the interference peak may exceed that of the main peak, resulting in incorrect direction finding results.
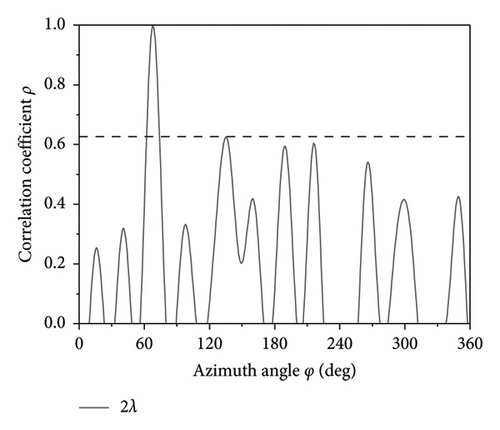
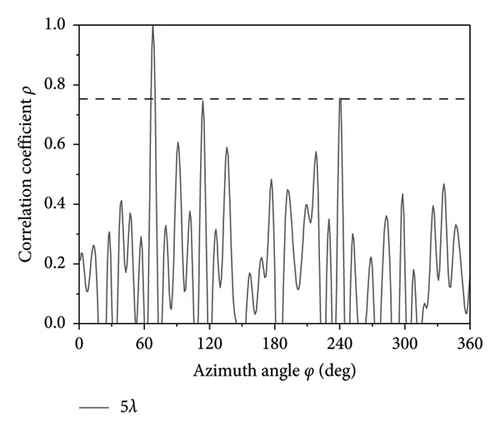
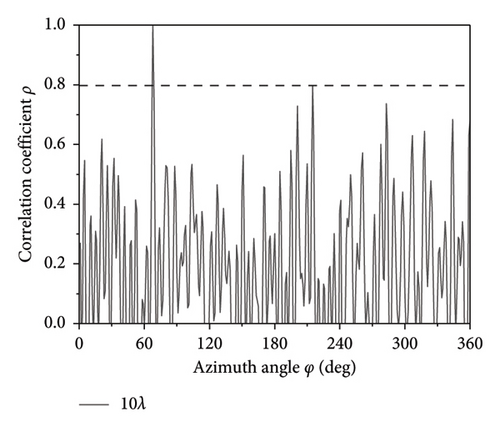
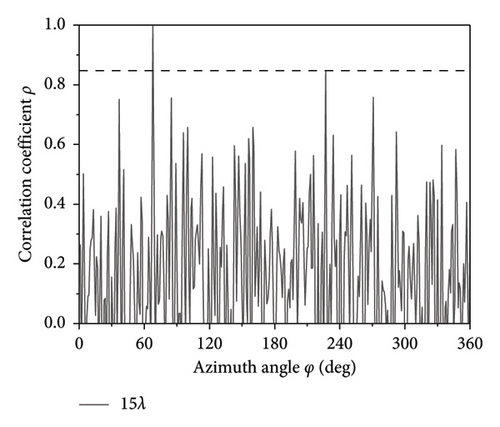
The simulation results for the correlation coefficient curves of the 7-element array with different element spacing D of 2λ, 5λ, 10λ, and 15λ are shown in Figure 7. The SNR is set to −10 dB, and the the incident angle is set to (67°, 90°). The results indicate that as the element spacing D increases, the width of the main peak decreases while the amplitude of the interference peak increases. However, even when the element spacing D is 15λ, there is no ambiguity in direction finding. In other words, when the SNR is −10 dB, the TMAs can achieve unambiguous direction finding, resulting in the broadband frequency range of 1–30 GHz corresponding to the fixed D = 150 mm.
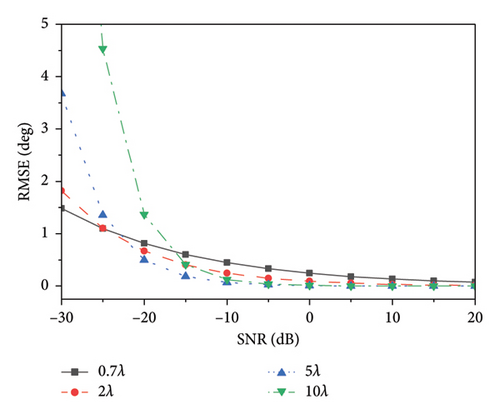
To evaluate the performance of the proposed method, the RMSE () of 500 different incident signals is simulated. The RMSE of the proposed direction finding method with different element spacing D and SNR is shown in Figure 8. The result shows that RMSE rapidly increases at low SNR, which is due to a significant increase in the direction-finding error rate caused by the ambiguous angle.
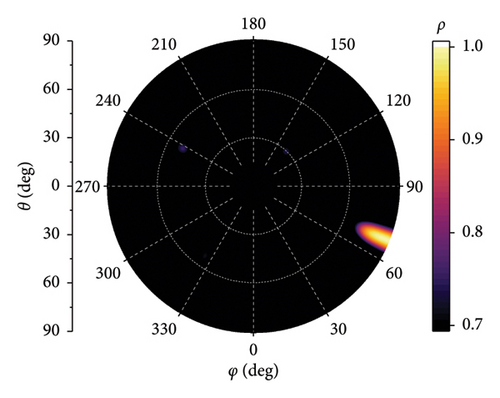
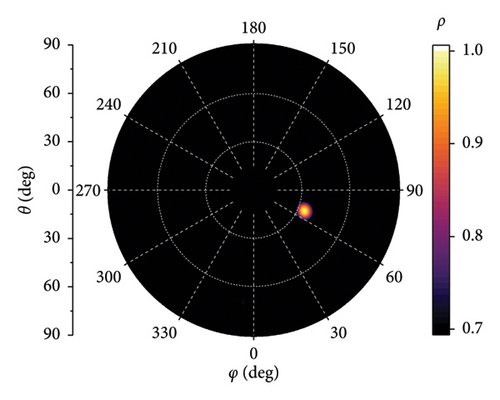
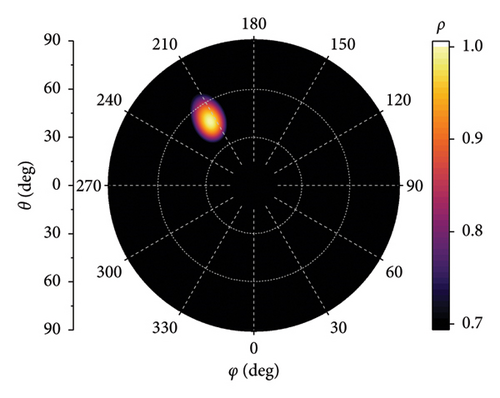
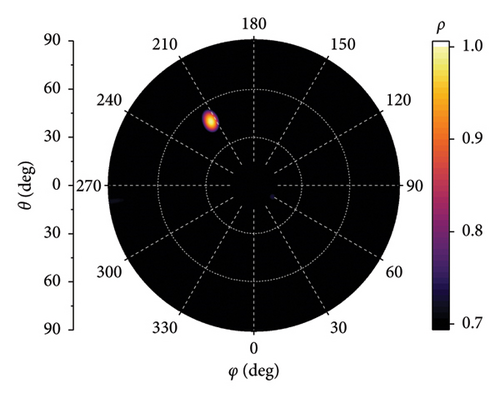
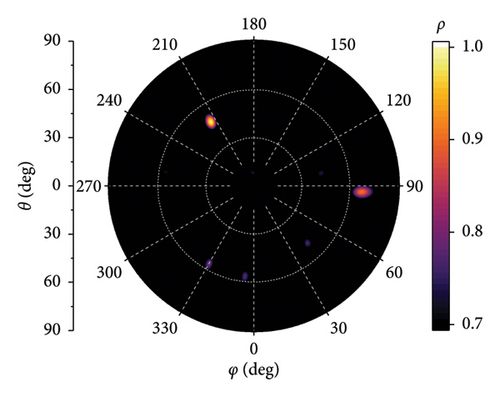
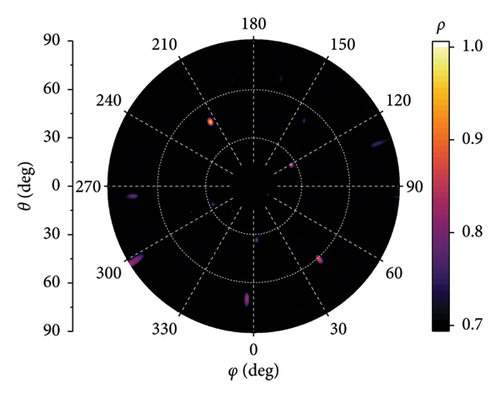
The simulation results for two-dimensional direction finding are shown in Figure 9. The receiving antenna is configured as the 7-element array with D = 2λ. The SNR is set to −10 dB, and the incident angles are (67°, 90°) and (67°, 63°), respectively. The bright spots in Figure 9 correspond to the two-dimensional correlation peaks, and the diameter of the bright spot represents the width of peak. It demonstrates extreme direction finding accuracy. Figure 10 presents the simulation results for D = λ, 2λ, 3λ, and 5λ, respectively, with an incidence angle of (213°, 47°). It can be inferred that as the element spacing D increases, the diameter of the bright spots decreases, but the amplitude of interference spots increases.
4. Experiment
The feasibility of the theory and simulation is verified through the design of a broadband direction finding TMA. As shown in Figure 11(a), the broadband symmetric dipole antenna is fabricated by using PCB technology on an FR4 substrate. The dimension of antenna is 135 mm in length and 35 mm in width, with the operating frequency range of 1–3 GHz. Figure 11(b) depicts the 7-element circular array with a diameter of 350 mm and an element spacing of approximately 151.8 mm. It is equivalent to operating at 0.5 ∼ 1.5λ. The high-speed switches are achieved by using HMC349, which is controlled by a Cyclone IV FPGA. The modulation frequency is set to 5 MHz, with a hold time of 500 microseconds for each baseline measurement. As shown in Figure 11(c), the direction finding antenna is mounted on a one-dimensional turntable, allowing rotation in azimuth. The receiving site is equipped with a single channel broadband superheterodyne receiver [31]. As shown in Figure 11(d), the transmitting site utilizes an R&S SMB100A signal generator, and the transmitting antenna is an omnidirectional broadband antenna. The distance between the transmitting and receiving sites is 50 m, and the test environment is an open, nonreflective site. By adjusting the transmit power at different frequencies, the SNR at the receive system maintains 10 dB.
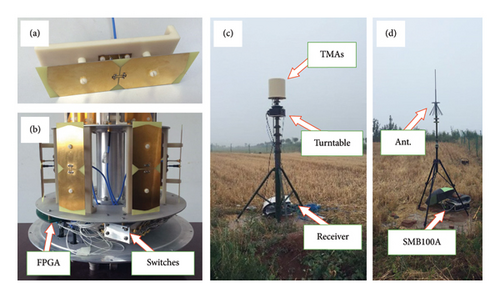
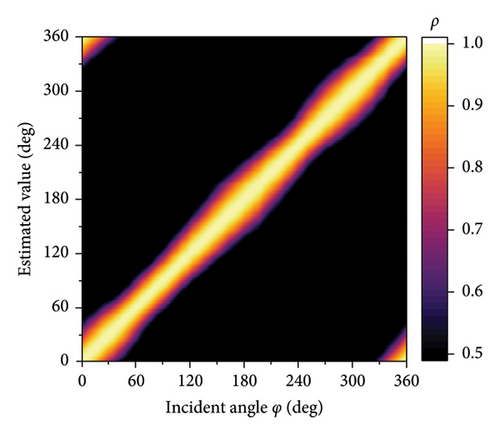
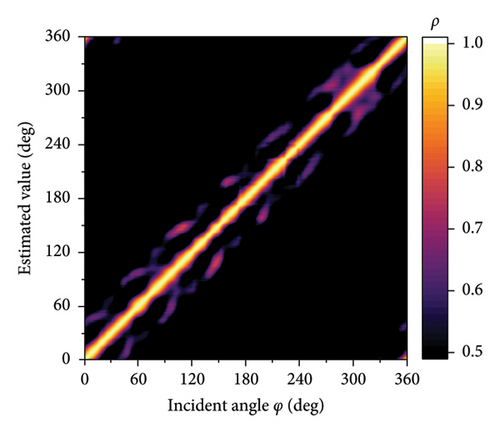
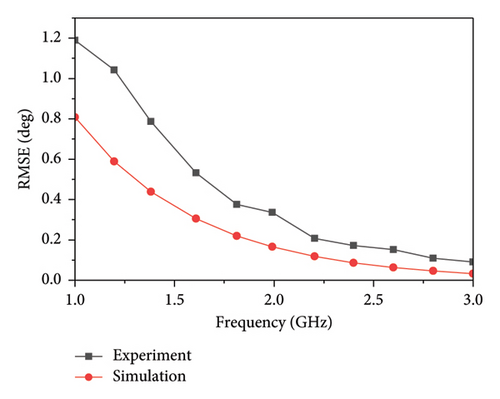
Figure 12 presents the correlation coefficients at 1 and 3 GHz, with a signal incidence angle ranging from 0° to 360° with 1° steps. It can be concluded that the direction finding system maintains a relatively uniform direction-finding accuracy across the entire tested azimuth angle, demonstrating higher angular consistency as compared to linear arrays [28]. At the frequency of 3 GHz, an interference peak appears close to the main correlation peak, but it does not affect the angle estimation due to low amplitude. The simulated and experimental RMSE of the estimated angles at different incidence angles with various frequencies is shown in Figure 13. The results show that the measured RMSE is higher than that of the simulation, which is attributed to measurement errors for amplitudes of harmonics by the receiver and the environment [18].
To highlight the merits of the proposed antenna, Table 1 summarizes the comparison between the reported methods and our work. The current literature mainly focuses on the linear and planar antenna arrays, and there is little literature on the operating bandwidth of TMAs. Therefore, in our manuscript, we propose an antenna based on a circular TMA, which can operate in a wider range of direction finding angle and a wider bandwidth.
| Ref. | DF method | Antenna type | DF azimuth angle (deg) | Bandwidth |
|---|---|---|---|---|
| [18] | Harmonic analysis and amplitude correlation | 8-element linear TMAs | [−90, 90] | Single frequency |
| [17] | Harmonic analysis and spatial spectrum | 16 × 16 planar TMAs | [−90, 90] | Single frequency |
| [29] | Harmonic analysis and Doppler frequency shift | Linear TMAs (simulation) | [−90, 90] | Single frequency |
| [28] | Harmonic analysis and spatial spectrum | 8-element linear TMAs | [−45, 45] | Single frequency |
| [27] | Harmonic analysis | 2-element linear TMAs | [−45, 45] | Single frequency |
| [14] | Harmonic analysis | 20 × 20 planar TM metasurface | [0, 3] | Single frequency |
| [10] | Harmonic analysis | 10 × 16 planar TM metasurface | [−45, 45] | Single frequency |
| This work | Harmonic analysis and phase correlation | 7-element circular TMAs | [0, 360] | Broadband (1–3 GHz) |
5. Conclusions
An omnidirectional direction finding circular TMA based on the phase correlation method is proposed. The broadband operating characteristics of the TMAs are analyzed through numerical simulations. In order to verify the simulations, TMA operating in the frequency range of 1–3 GHz is designed, fabricated, and demonstrated experimentally. It has great potential in the research of portable direction finding and positioning systems, and it can also be extended to other fields such as acoustics.
Conflicts of Interest
The authors declare no conflicts of interest.
Funding
This work was supported by the National Natural Science Foundation of China (Grant No. 12374296), the Key Research and Development Program of Shaanxi Province of China (Grant No. 2024GX-ZDCYL-01-31), and the Innovation Foundation of Xi’an Mingde Institute (Grant No. 2023MDE01).
Open Research
Data Availability Statement
The data used to support the findings of this study are available from the corresponding authors upon reasonable request.


