Multi-LiDAR-Based 3D Object Detection via Data-Level Fusion Method
Abstract
With the rapid development of artificial intelligence, the application prospect of the global perception system that can cover large-scale scenarios in smart cities is becoming increasingly extensive. However, due to the sparse point cloud data at the remote end and the complex logic of result-level stitch, most of the current LiDAR-based global perception technology performs poorly. Based on the above problems, we first propose a technology for mosaic point clouds from the data level, improving remote targets’ point cloud density. Secondly, a new point cloud detection model based on the deep learning framework is proposed, which enhances the feature extraction ability of small targets with sparse point clouds at the intersection of perception stations by focusing on features by attention mechanism. Moreover, we add the direction accuracy by changing the heading angle prediction to interval prediction. Finally, to verify the effectiveness of our method, we propose the public dataset VANJEE Point Cloud, which is collected in the real world. Our algorithm has improved the global trajectory fusion rate from 91.7% to 95.6%. Experiments prove the effectiveness of the proposed method in this paper.
1. Introduction
In recent years, with the development of deep learning and LiDAR technology, point cloud-based roadside global perception algorithms have made great progress. The global perception system has been proposed to deal with global perception in various scenarios. The global perception system generally comprises multiple independent, intelligent base stations, which send their respective perception results to the global perception system through the network. It can intelligently process and analyze the perception data according to actual needs, automatically identify and classify targets, and extract valuable information. Currently, data connectivity and sharing among multiple base stations is a challenge. Due to the time synchronization of multiple base stations, high-precision location of detection boxes, and other factors involved in global perception, existing algorithms have problems with mosaic deviation and trajectory discontinuity at the intersection of base stations. This paper mainly studies the problems related to global perception systems based on LiDAR point cloud in multibase station deployment scenarios.
In roadside perception, commonly used sensors include cameras, millimeter-wave radar, and LiDAR. LiDAR has the advantages of high accuracy and high resolution and can accurately locate the position and height information of target objects on the order of centimeters. Therefore, it is widely used in the field of target perception. This paper focuses on the global perception system based on LiDAR. Point cloud target perception algorithms have evolved from the earliest geometric feature-based clustering [1] to the widely studied deep learning-based object detection algorithm. As we all know, according to the scanning principle of mechanical LiDAR, unlike images, LiDAR data has the characteristic of long-tailed distribution. The current approach is to optimize the density of LiDAR point clouds and the structure of neural networks [2], but some optimization plans are still available.
- 1.
Introducing multibase station mosaic technology on the data side to optimize detection and mosaic issues from the system’s start.
- 2.
Adjust the attention mechanism network, develop an attention mechanism module compatible with sparse convolution, and apply it to the 3D convolutional network for point cloud object detection.
- 3.
A more refined direction prediction and corresponding loss function are introduced to solve the direction prediction problem caused by the sparsity of point clouds.
We arrange the rest of the work in this paper as follows. Section 2 discusses the global perception algorithm and the point cloud object detection algorithm based on deep learning. Section 3 details the data mosaic principle and network model in this paper. Section 4 compares the methods in this paper and other general point cloud perception algorithms. Finally, Section 5 summarizes and introduces future work.
2. Related Works
2.1. Global Perception Algorithm
The global perception algorithm is based on artificial intelligence and communication technology. Usually, a set of global perception systems can be composed of multiple intelligent base stations. Through collaboration and information sharing between base stations, real-time perception and monitoring algorithms for all traffic participants within the coverage area of the base station are realized [3]. Its accuracy mainly depends on the output of its upstream single base station. Firstly, the global algorithm requires the detection result data of different base stations to be mosaic. This step requires high-precision positioning of the base station to avoid stitch errors. At the same time, this stitch method also needs a good network environment to achieve real-time acquisition of detection results from all base stations. Although applying multibase station and global perception algorithms can increase the perception range, the detection result-level stitch will ignore the long-tail distribution and data complementarity problems of LiDAR [4]. Finally, from the perspective of algorithm complexity, the data-level stitch only requires joint data. At the same time, the result-level mosaic method needs to pay attention to the position, heading angle, and category, and its complexity is significantly higher than that of the data-level stitch.
2.2. Point Cloud Perception Algorithm
Unlike image data, LiDAR data has strong sparsity and disorder due to the hardware features principle. For object detection on point clouds, the advantage is that it can use three-dimensional spatial information. Still, the disadvantage is that the increase in spatial dimensions often leads to too sparse point cloud data, resulting in poor model fitting [5].
An early common approach is to convert 3D point cloud data into 2D image form for input. Using this approach, researchers can directly apply traditional 2D object detection algorithms to 3D point cloud data detection tasks. For example, the multiview fusion (MVF) [6] algorithm is an effective end-to-end MVF algorithm that converts 3D point cloud data into multiple views through dynamic voxelization and utilizes the features of various views for object detection. The front view representation in the deep learning direction includes depth images and spherical projections. However, this method loses the 3D features of the point cloud.
Later, algorithms directly based on 3D point clouds were proposed. PointNet [7] is a neural network-based end-to-end point cloud classification and segmentation method proposed by Qi et al. in 2017. PointNet directly takes point clouds as input and captures local and global feature information in point cloud data through high-dimensional mapping and maximum pooling operations on the original features. This method can better express the 3D information of point clouds. However, PointNet has a major problem: it can only accommodate a small number of point clouds, so it is more often applied in semantic segmentation or object detection of small targets and is unsuitable for large-scale point cloud applications such as intelligent transportation. BEV represents point cloud data better than deep maps. It represents point clouds from a top-down perspective without losing scale and scope information. It is widely used in LiDAR detection [8–12], which has also been recently used for task segmentation [13]. PointPillars [14] is improved by adding a PointNet model to the BEV representation. PointNet converts the point cloud in each column grid into a fixed-length vector, forming a pseudo image. Then, a 2D convolutional neural network is used for feature extraction and object detection operations.
In addition to directly processing 3D point cloud data, some researchers have converted 3D point cloud data into voxel form for input. VoxelNet [15] is a network structure that converts 3D point cloud data into voxel form for input. It uses 3D convolution to process voxel-based point cloud data for object detection. A similar idea, such as Voxel R-CNN [16] and PV-RCNN++ [17], is also adopted. The Sparsely Embedded Convolutional Detection (SECOND) algorithm is a target detection algorithm based on 3D point cloud voxels. The design idea of this algorithm is almost identical to that of VoxelNet, with the main difference being that the convolutional middle layer (CML) in VoxelNet is replaced by 3D sparse convolution for feature extraction. By using submanifold convolution, the “inflation” problem that occurs when processing data in dense convolution is solved. Based on neural network-based point cloud perception algorithms, this article mainly focuses on optimizing SECOND as a benchmark.
In general, although point cloud object detection algorithms have been widely applied in many fields, many challenging problems still need to be addressed. For example, how to effectively process large-scale 3D point cloud data and accurately detect various shapes and sizes of target objects. We will study and optimize these problems in this paper.
2.3. Attention Mechanism
It is generally believed that three main factors affect the performance of convolutional neural network models: depth, width, and network layer number. In addition to these three factors, there is a module that can also affect the performance of the network, which is the attention mechanism. In computer vision, the method of focusing attention on important areas of the image and discarding irrelevant ones is called the Attention mechanism [18]. For example, the Mind team’s method [19] used attention mechanisms for image classification on RNN models. Subsequently, Bahdanau et al. [20] used an attention-like mechanism to simultaneously translate and align in machine translation tasks.
In recent years, with the continuous development of artificial intelligence technology, attention mechanisms have also been widely applied in other fields. CBAM is a simple and effective feed-forward convolutional attention module neural network. Given a feature map, the module in this paper is set to infer the attention map sequentially along two independent dimensions, channel and spatial, and then multiply the attention map with the input feature for adaptive feature refinement mapping. CBAM is a lightweight module that can be integrated into any CNN architecture with negligible overhead and trained end-to-end on the underlying CNN. This paper improves the CBAM module to make it applicable to point cloud object detection tasks.
3. Approach
3.1. Algorithm Framework
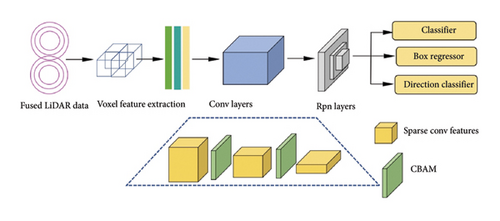
The framework of this paper is composed of two parts: data stitching and neural network optimization. Firstly, at the data level, we perform multibase station stitch by using the high-precision location information of the base stations to stitch the multibase station data before sending it to the detection algorithm, forming a set of point cloud data containing the detection range of multiple base stations. Then, the point cloud data is sent to the point cloud voxel feature extraction network, which encodes the discrete and disordered 3D point cloud into a sparse 4D tensor. We have improved the sparse convolution module. The yellow module in Figure 1 is the feature after sparse convolution, and the green module is the attention module. We have added an attention mechanism module to the sparse convolution. The attention mechanism network layer contains the channels and spatial locations that need to be focused on in the feature map of the previous network layer. Finally, there is the RPN layer network. In the direction classification module, we set the angle to be predicted as an interval and improve the accuracy of angle prediction through more refined classification methods. In subsequent chapters, we will detail the optimization we have done in the model.
3.2. Data Level Mosaic
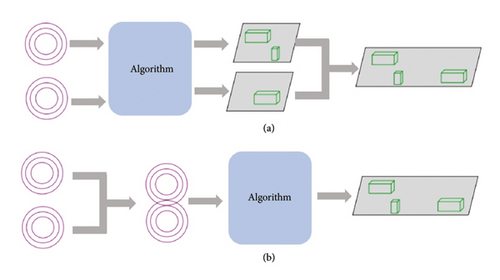
The traditional global stitch method is based on the result-level backend stitch, where the perception results of each single base station are sent to the global perception system, and the global perception system stitches the perception results. In contrast, we use data-level fusion to merge the original point cloud and directly obtain the global sensing results. Although both adopt different strategies, each requires calibrating the LiDARs to get the rotational parameters and translational parameters between different LiDARs.
Specifically, a LiDAR point cloud is a set of points representing three-dimensional spatial information; we perform multi-LiDAR calibration using a set of rotation and translation parameters, including [translation x, translation y, translation z, rotate x, rotate y, rotate z]. The six parameters represent the translation and rotation on the x, y, and z coordinate axes between two LiDARs. To obtain this parameter more accurately, we use joint calibration with multiple objects of reference according to geometry’s relationship between points and surfaces. Place two frames of LiDAR data in the same coordinate system for display, align the reference objects in the two LiDARs by adjusting the translation and rotation parameters, and finally complete the calibration of the rotation translation parameters between the two LiDARs.
Due to the overlap of LiDAR scanning areas between adjacent stations, fusing the point clouds of the two stations can increase the number of points in the detection blind area and increase the point cloud density of the target, thereby reducing the detection difficulty in the area and providing more reliable perception results.
At the same time, using the multi-LiDAR data stitch method, the point cloud detection algorithm can process multiple LiDAR data simultaneously, sending multiple LiDAR detection results to the global perception system at once. Therefore, the number of perception result stitches in the global perception system is reduced, and the trajectory’s reliability is increased. Figure 2 shows the traditional data processing method and the new processing method proposed in this article.
The splicing of multiple LiDARs inevitably leads to increased data volume, which in turn increases algorithm time consumption. To solve this problem, we conducted distributed computing on the fused data. Specifically, as shown in Figure 3, taking the two-LiDAR as an example, we stitch the point cloud data of one of the LiDARs together with the part of the point cloud data of the other LiDAR that is in the overlapping region and feed them into the model to be detected, which ensures that the point cloud data inputted into the model is not very large and also utilizes the idea of data stitching. The same operation is used for the other LiDAR. In addition, the principle of overlapping region selection is based on the farthest detection range of the current LiDAR, and the part of another LiDAR overlapping with it is selected, such as the dark yellow part in Figure 3. Finally, we combine all the detection results and filter the overlapping regions with the nonmaximum suppression (NMS) strategy to get the final detection results.

3.3. Second With Attention Mechanism
In contrast to the original Second network, we incorporate a CBAM module here, as shown in Figure 4. CBAM combines the output features of the channel attention module and the spatial attention module by element-wise multiplication, resulting in the final attention-enhanced features. These enhanced features will be input for subsequent network layers to suppress noise and irrelevant information while retaining crucial information. The CBAM module enhances the feature representation capability of the neural network by adapting learning channels and spatial attention weights. By integrating channel and spatial attention, the CBAM module can capture correlations between features across different dimensions, thereby improving the performance of point cloud object recognition tasks.

Furthermore, since attention features involve operations such as convolution and pooling during computation, it inevitably leads to “feature dilation” of sparse feature maps, where features are introduced into areas where features do not exist, resulting in feature distortion. To maintain the sparsity of point cloud features in 3D space, we adopt the Submanifold Dilation strategy. Before inputting a certain layer’s features into the attention mechanism module, the feature positions in both channel and spatial dimensions are recorded.
3.3.1. Loss Function Optimization
However, in practice, we find that there are often errors when predicting the angle of the target, which affects the subsequent global perception system. Therefore, in this section, we improve the loss function to solve this problem.
The directional truth space is divided into several intervals, and we transform the single directional regression problem into two parts: classification problem and regression problem. Specifically, the directional truth space ranges from 0 to 2π, which we divide into 12 intervals, each of which is π/6. First, categorize the angle to the correct interval, and then within this small interval, the angle is more accurately regressed. Furthermore, the id value of the angle is determined by which interval it belongs to. Then, based on classification, regression is performed within the interval of 0 to π/6, and the regression value is res.
4. Experiments
In this section, we use the upcoming public dataset to validate our innovative method. We will describe the experimental background and experimental methods in detail. We further demonstrate the effectiveness of our innovative points through ablation experiments and compare them with the latest algorithm models.
4.1. Dataset
We utilized tunnels containing 12 unique scenarios to capture the point cloud and used it as the baseline dataset for this training and testing of the VANJEE PointCloud. The dataset was labeled to contain nine categories. In addition, Figure 5 describes the fundamental aspects of the dataset from an original perspective and effectively represents the intrinsic and structural properties of the point cloud, which can also be viewed in detail on the website: https://github.com/peanutocd/GPADS-Global-Perception-Algorithm-based-onData-level-Stitchin.
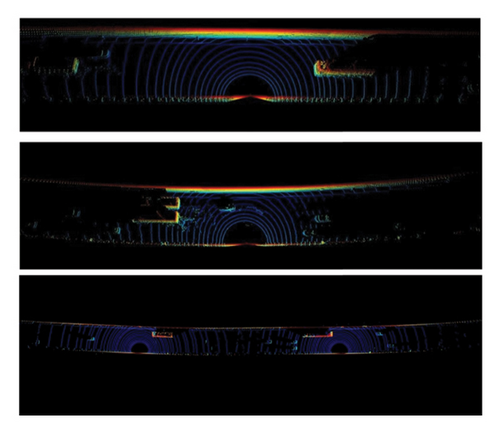
We divided the VANJEE point cloud dataset into a training set and a test set containing 30,000 and 4,000, respectively. The test categories are divided into nine categories, and the number of points in the point cloud of each category ranges from 2000 to 110,000. This data distribution also reflects the long-tail effect. In addition, the dataset is annotated based on the Kitti format [21], where each row contains labeling information about the target, as follows: coordinates of the 3D center, dimensions of box (2D as well as 3D), category, angle, and degree of occlusion.
4.2. Experimental Setting
4.2.1. Experimental Environment
SECOND was used as the base detector. In the training phase, we used batch training with the batch size set to 8. The initial learning rate was set to 0.005, and the decay coefficient was set to 0.95. The foreground threshold was set to 0.6, and the background threshold was set to 0.45. Considering the object’s actual size, we excluded all the anchors corresponding to the empty voxel points counterparts by setting anchors of different sizes. In the testing phase, to filter the low-confidence prediction frames, we set their threshold to 0.3, and at the same time, we set the NMS threshold to 0.6. To alleviate the problem of long-tailed distribution of the data, we used a data augmentation method in which a small number of categories of objects were randomly duplicated and added to a subset of the samples by rotating and translating operations. In addition, an NVIDIA-A30 with 40 GB of memory was used for the training device.
Due to the fact that the point cloud algorithm research in this article is based on mechanical LiDAR, it can be inferred from the characteristics of LiDAR that an object has detailed differences in the direction of LiDAR arrival and departure. Therefore, the original features of the object at the single LiDAR and where multiple LiDARs intersect are different. However, we can also address this issue by concatenating and enhancing the training data. In terms of data augmentation, this article chooses strategies such as randomly increasing the number of samples at the splicing point within the LiDAR detection range and cropping the angle of the target part.
4.2.2. Experimental Indicators
The commonly used evaluation indicators for object detection include precision and recall, which are defined as follows:
4.2.2.1. Recall Rate of Class Recognition of Traffic Participant
4.2.2.2. Class Recognition Accuracy of Traffic Participants
4.2.2.3. F1 Score
4.2.2.4. Evaluation Indicators for Global Trajectory Fusion Algorithm
4.3. Ablation Experiment
4.3.1. Ablation Experiment of Data-Level Point Cloud Stitch Algorithm
The traditional method means that when the detection of individual point cloud data is finished, the splicing is performed in the whole domain, and then the whole domain trajectory fusion rate is obtained; whereas, in our way, after stitching the individual point cloud data, the overall detection is performed, and then the splicing is performed in the whole domain, and the whole domain trajectory fusion rate is obtained. In this subsection, we utilize the traditional method and the splicing approach for comparative experimental analysis, and the test dataset is 3000 frames of tunnel data.
As shown in Table 1, it can be seen that compared to the global result stitch used before, no matter what kind of point cloud target detection algorithm is used, the use of data-level global point cloud stitching effectively improves the global trajectory fusion rate. As shown in Figure 6, the more the number of LiDAR mosaics, the higher the global trajectory fusion rate, proving the effectiveness of the data-level stitch used in the global perception system.
| Data stitching method | VoxelNet | PointPillers | Second | CenterPoint | Ours |
|---|---|---|---|---|---|
| Before stitching | 89.6 | 89.3 | 91.3 | 91.5 | 91.7 |
| 2 LiDAR stitching | 89.9 | 90.4 | 91.6 | 92.9 | 92.5 |
| 3 LiDAR stitching | 91.6 | 92.1 | 92.8 | 91.5 | 94.8 |
| 4 LiDAR stitching | 92.7 | 92.4 | 94.7 | 93.5 | 95.6 |
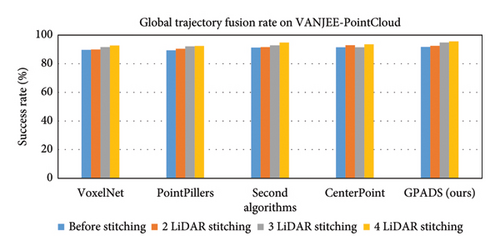
On the other hand, the full domain trajectory fusion rate represents the splicing accuracy. It can be seen that using the same detection model, the traditional method has the lowest performance, which is due to the fact that the point cloud data at the far end of the single LiDAR is too sparse, and the detection of the model’s further distal position is unsatisfactory. However, the data splicing method maximizes the information of the data at the far end of the LiDAR, which is very helpful for both detection and fusion. Meanwhile, during the experiments, we found that the overall running time of the traditional method and the splicing method is almost the same. This again proves the effectiveness of our method.
4.3.2. Ablation Experiments on Different Optimization Modules
In order to verify the effectiveness of the improved module, we conducted ablation experiments in this section. We added attention mechanism modules and loss function optimization strategies to the original model and conducted corresponding experiments. According to the actual situation, our accuracy metrics are divided into three categories: motor vehicles, nonmotor vehicles, and pedestrians, and the experimental results are displayed more finely according to distance. Using 5000 frames of tunnel data as the training set and 3000 frames as the test set, we added the improved algorithm to the second algorithm with a confidence level of 0.3 and obtained the precision and recall rate for each category.
As shown in Table 2, overall, the use of Method A and Method B allowed the model to achieve optimal performance. It can be seen that the addition of strategy A to the original second strategy resulted in a significant improvement in the vehicle and pedestrian detection metrics. The accuracy for motor vehicles increased from 90.8% to 95.5%. The recall of pedestrians increased by almost 5%. The improved loss function further improves vehicle detection and there are some improvements in small targets. However, as can be seen from the experimental results, there is no significant improvement in the accuracy of pedestrians compared to the other categories, which is only 2.3%.
| Modules selection | Motor vehicles (80 m) | Nonmotor vehicles (60 m) | Pedestrians (50 m) | |||
|---|---|---|---|---|---|---|
| P | R | P | R | P | R | |
| Original second | 90.8 | 95.5 | 78.5 | 86.3 | 80 | 85 |
| Second + A | 93.2 | 97.0 | 80.9 | 88.9 | 81.5 | 87.7 |
| Second + B | 91.9 | 96.3 | 81.5 | 90.6 | 79.2 | 88.5 |
| Second + A + B | 95.5 | 98.0 | 82.9 | 90.6 | 82.3 | 89.7 |
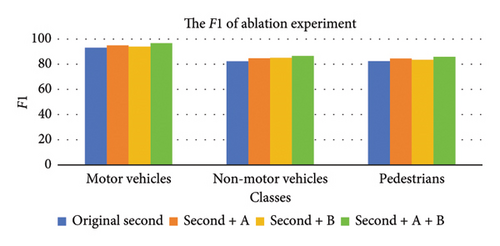
Figure 7 illustrates the F1 score, considering the model’s performance from an overall perspective. Method A and Method B resulted in the best performance of our model on all classifications. Compared to the original model, the F1 score of our model improved by about 3.5%. We also found that the use of Method A is more effective on large categories, while the use of Method B is more effective on small categories, which can indicate that the reference of the attention mechanism can extract more features on large targets, which can help the model to classify them.
4.4. Point Cloud Object Detection Algorithm Optimization Experiment
In order to verify the superiority of the attention mechanism module applied in the second, we will conduct comparative experiments based on the current mainstream LiDAR point cloud-based model and the second network with the attention mechanism proposed in this paper. The dataset used in the experiment is the publicly available dataset mentioned in Section 4.1, and the hardware platform used in the experiment is mentioned in Section 4.2.
Table 3 demonstrates the classification recall of each model for each category. Overall, our models achieve the best performance, which shows that our models can be as nonmissing as possible. Specifically, CAR, as the most common traffic participant, has a high performance across all models. Still, our model has the highest improvement of 3.6%, which shows that using the attention mechanism can help the model better focus on the category itself. For small targets such as bicycles, tricycles, and pedestrians, the performance of each model is less satisfactory. Still, our model also achieves the best performance, with a maximum enhancement of 9.1% in the pedestrian category, where the attention mechanism can better extract the point cloud features of small targets. Our model does not have optimal performance for large targets such as buses, trucks, semitrailers, etc., because the attention mechanism can help the model focus more on specific areas. Still, for large targets, there will be the possibility of losing essential features.
| Algorithms | Car | Bicycle | Bus | Tricycle | Pedestrian | Semitrailer | Truck |
|---|---|---|---|---|---|---|---|
| VoxelNet | 90.8 | 72.9 | 86.5 | 71.7 | 57.4 | 81.0 | 89.3 |
| PointPillars | 89.9 | 68.1 | 92.1 | 70.4 | 54.6 | 82.7 | 91.4 |
| Second | 90.9 | 74.5 | 87.5 | 72.6 | 59.2 | 85.5 | 90.3 |
| CenterPoint [22] | 91.7 | 77.5 | 90.8 | 77.2 | 59.8 | 83.5 | 89.2 |
| Ours | 93.5 | 80.2 | 91.7 | 79.5 | 63.7 | 86.2 | 90.6 |
As shown in Figure 8, our model is clearly the best performer overall. Although our model does not reach first place in the category BUS and TRUCK, it also has a high performance. Meanwhile, avoiding the leakage of large targets is one of the directions of our work afterward.
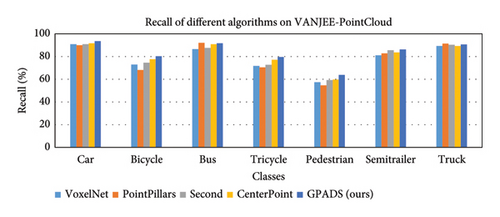
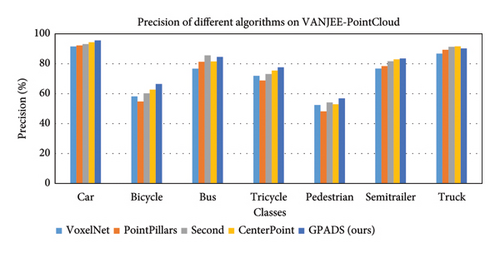
Table 4 shows the classification accuracy rates of each model for each category. For motorized vehicles such as cars, buses, trucks, semitrailers, etc., each model achieves relatively good performance, and our model achieves the best performance overall, indicating that for the motorized vehicle category, the use of the attention mechanism helps the model to extract features better. For nonmotorized vehicles such as bicycles and tricycles, the performance of each model is not very good; nevertheless, using the attention mechanism helps our model achieve the best performance, with a maximum improvement of 8.2%. Finally, for pedestrians, the performance of each model is not good, indicating that pedestrian detection has a high stress on each model. Still, our model improves the accuracy by up to 4.4%. Therefore, the attention mechanism can help the models classify better and avoid false detection situations.
| Algorithms | Car | Bicycle | Bus | Tricycle | Pedestrian | Semitrailer | Truck |
|---|---|---|---|---|---|---|---|
| VoxelNet | 91.5 | 58.2 | 76.6 | 71.9 | 52.4 | 76.7 | 86.7 |
| PointPillers | 92.2 | 54.7 | 81.3 | 68.8 | 48.2 | 78.4 | 89.3 |
| Second | 93.1 | 60.2 | 85.5 | 73.1 | 54.1 | 81.6 | 91.3 |
| CenterPoint [22] | 94.3 | 62.7 | 81.5 | 75.4 | 52.9 | 82.9 | 91.6 |
| Ours | 95.5 | 66.4 | 84.5 | 77.6 | 56.8 | 83.5 | 90.2 |
As shown in Figure 9, the bar chart shows the performance of each model’s categorization accuracy rate more intuitively. It can be seen that our model does not perform the best in the category TRUCK, which indicates that our model’s misdetection is more serious in this category. So, how to avoid the misdetection in this category is also one of the directions of our work afterward.
As shown in Figure 10, the predicted results of the dual LiDAR data stitch show that the algorithm proposed in this paper can improve the point cloud density and detection performance of remote objects of LiDAR. It can be seen that compared to the original second, our optimized algorithm not only improves the accuracy of vehicles such as cars and buses but also has a certain degree of improvement on small targets such as pedestrians and bicycles.
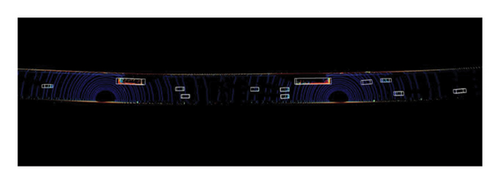
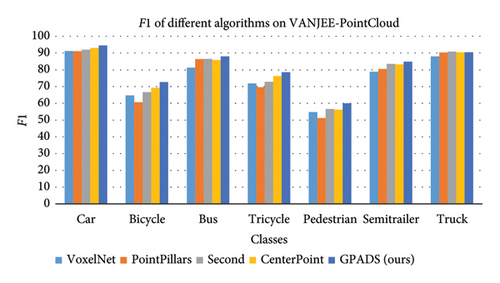
Figure 11 illustrates the F1 score performance of each model in each category. F1 considers the classification ability of the model as a whole. Overall, our model achieves the best performance both from the point of view of large and small targets and from the point of view of motorized and nonmotorized vehicles. In particular, for the most common car, our model improves up to 3.46%; for pedestrians, our model improves up to 8.85%; and for buses, there is also a 6.7% improvement. It shows that the attention mechanism can help the model focus on the valid data regions and improve the model’s classification ability.
5. Conclusion
In this article, we propose a new network architecture and data application method for LiDAR point cloud target detection. Our method improves the perception ability of small targets by improving the sparse convolutional network and outputs more accurate detection results for the global perception system. By using a more complex data-level global point cloud stitch algorithm, we obtain more complete point cloud data, improve the global trajectory fusion rate, and refine the roadside perception. Through ablation experiments, our algorithm has significantly improved detection accuracy and global trajectory fusion rate. The data-side stitch of point clouds can better utilize hardware resources, which can send the data from two perception stations to one computing device, greatly saving hardware resources. In addition, compared with ordinary global systems, our data-side stitch method can be extended to other sensor fields, which indicates that our algorithm is versatile. Finally, although our algorithm has greatly improved detection performance, there is still a gap between pedestrian accuracy and motor vehicles. Due to limited time, we hope to continue to study in the direction of multisensor fusion in the future.
Conflicts of Interest
The authors declare no conflicts of interest.
Funding
The authors received no specific funding for this work.
Open Research
Data Availability Statement
The data that support the findings of this study are available from the corresponding author upon reasonable request.


