Design and Implementation of a Tube Heat Exchanger for Turbojet Engines to Improve Operational Efficiency
Abstract
Heat exchangers are widely used across various industries to transfer heat between two fluids: liquid or gas without direct contact. In turbojet engines operating at high temperatures, heat exchangers are essential for cooling lubricants, improving engine efficiency, and minimizing lubricant degradation. Shell-and-tube heat exchangers are preferred in aircraft engines for their compact size and high thermal efficiency. The development of such heat exchangers involves several steps, including selecting the appropriate number of tubes, calculating the cooling rate, and conducting reliability tests before and after fabrication. After reviewing multiple manufacturing parameters and evaluating the suitability for the target aircraft engine, we established a comprehensive three-step fabrication process. First, numerical calculations were carried out to estimate the required number of tubes and shells. Next, computational fluid dynamics (CFD) analysis using ANSYS Fluent was conducted to validate the numerical results and perform parametric studies. Finally, a new heat exchanger design was fabricated and tested to evaluate its efficiency under real-world operating conditions.
1. Introduction
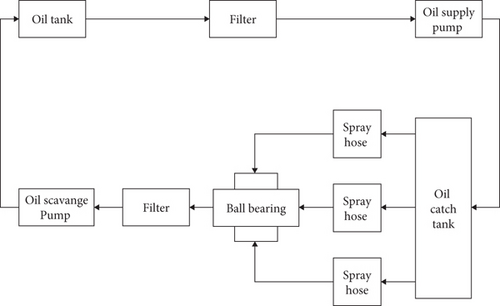
Rolling element bearings are among the most critical components in rotating machinery, particularly in turbojet engines, where they connect the rotor turbine shaft to the compressor [1]. Typically, the main shafts in jet engines are supported by at least two types of bearings: a thrust ball bearing, which handles both axial and radial loads, and a cylindrical roller bearing, which supports only radial loads [2]. The primary function of a bearing is to prevent direct metal-to-metal contact between the rotating components of the turbine and compressor. This minimizes friction, reduces heat generation, and helps prevent wear and damage to engine parts [3]. During engine operation, ball bearings are subjected to extreme conditions, including high temperatures caused by elevated rotational speeds [4]. As the rotor turbine spins, its shaft supported by the bearing balls generates friction. This friction heats the metal balls, leading to thermal expansion and potential deformation. Such deformation, or roundness error, can cause motion instability due to changes in the shaft’s radial run-out [5]. In addition, high temperatures can accelerate wear between the bearing ball and shaft, potentially leading to engine failure [6]. To ensure smooth and reliable shaft rotation, proper lubrication is essential. Lubrication in rolling bearings serves to minimize or eliminate metal-to-metal contact between rolling and sliding surfaces [7]. According to SKF, two primary types of lubricants are used in bearings: grease and oil [6, 8]. In turbine engines, synthetic oils with low viscosity are preferred over mineral oils because they retain their lubricating properties under high temperatures and offer superior resistance to oxidation, thermal stability, and viscosity control [9]. The lubrication cycle begins at the oil tank, from which oil is pumped under pressure to the spray hose. After lubricating the bearings, the used oil flows through a fine filter, passes into a scavenge pump, and is then returned to the oil tank, completing the cycle [10]. The schematic of this lubrication system is illustrated in Figure 1.
The primary role of oil in a turbojet engine is to lubricate the bearings and dissipate the intense heat generated by friction. However, oil has a limited capacity for heat removal, which diminishes as its temperature approaches critical thresholds. Once these limits are exceeded, the oil undergoes chemical degradation commonly known as coking which leads to a significant loss of lubricating properties and can ultimately damage bearing components [4]. Elevated temperatures also negatively impact oil viscosity, directly impairing its lubricating performance [11]. Viscosity, defined as a fluid’s resistance to flow, is one of the most critical properties affecting lubrication. Technically, it measures a fluid’s resistance to deformation under shear stress [12]. As temperature rises, the viscosity of complex fluids typically decreases. This occurs because intermolecular forces such as dipole–dipole interactions and London dispersion forces are weakened as the distance between molecules increases with thermal agitation. According to the Lennard-Jones potential [13], expressed as VLJ = 4.ε.[(σ/r)12 − (σ/r)6], as the intermolecular distance r increases, the repulsive forces between molecules decrease significantly. This reduction in molecular interaction contributes to the decline in viscosity at elevated temperatures. Moreover, even within the same type of liquid, variations in concentration can result in differences in viscosity [14]. Consequently, to maintain optimal lubrication performance, it is essential to control and reduce the oil temperature during engine operation.
Mobil Jet Oil, which is specifically formulated for aircraft turbine engines such as turbojets and turbofans, is commonly used to lubricate engine bearings. It is produced from a highly stable synthetic base fluid combined with a specialized blend of chemical additives to ensure high performance under extreme operating conditions [15]. During actual engine operation, the temperature of the exhaust oil can exceed 205°C, the maximum working temperature limit for Mobil Jet Oil [16]. This occurs because the oil absorbs heat generated from the high-speed interaction between the shaft and the ball bearings. As a result, elevated temperatures and changes in viscosity degrade the oil’s lubricating and cooling performance. To mitigate this issue, a heat exchanger (HE) is employed to enhance the oil’s thermal management. The main function of a HE is to recover and transfer excess thermal energy from one medium to another, often repurposing it for applications such as heating or power generation [17]. In this context, the HE transfers heat from the hot lubricating oil to the incoming fuel in order to reduce the oil temperature and improve lubrication efficiency. The selection of aviation fuel for heat exchange is based on its chemical characteristics. Jet A1 fuel, for example, produces minimal vapor at room temperature, making it relatively safe and resistant to ignition under normal conditions. It has a flash point above 38°C, while its ambient storage temperature is typically around 20°C [18, 19]. Preheating the fuel before it enters the combustion chamber improves ignition reliability and combustion efficiency during engine startup. Among various types of HEs such as plate HEs, heat pipe systems, and waste heat boilers, the pipe (or shell-and-tube) HE is often preferred due to its compact design and high efficiency. It consists of a bundle of tubes through which one fluid flows, while the second fluid flows around the tubes within an outer shell. The flow of the shell-side fluid is typically directed by baffles, which help maintain optimal velocity, enhance heat transfer, and provide mechanical support to reduce vibration in the small-diameter tubes [20].
- 1.
Theoretical calculation
- 2.
CFD simulation and configuration validation
- 3.
Experimental validation
Finally, the fabricated HE is tested in a laboratory setting to compare its actual performance against the theoretical and CFD-predicted outcomes. This step is essential for verifying the feasibility of the design in a real-world aerospace application, and the testing results serve as the foundation for potential future improvements.
2. Designing HE Geometry Through Calculating and Testing
The process of creating a HE can be described by a pseudocode which makes it easier to flow the process clearly:
- 1.
Theoretical calculation:
- •
Identify the basic factors to be calculated (heat transfer coefficient, temperature difference, flow rate, etc.)
- •
Apply heat transfer formulas for the tube HE
- •
Calculate the performance and temperature changes of the fluid through the tube
- •
- 2.
Simulation via ANSYS:
- •
Set up a 3D model of the tube HE in ANSYS
- •
Apply boundary conditions (material, temperature, flow rate, etc.)
- •
Run numerical simulations to determine the temperature distribution and heat transfer coefficient in the HE
- •
Obtain results from the simulation and compare them with theoretical calculations
- •
- 3.
Manufacturing of the tube HE:
- •
Select appropriate materials and pipe sizes
- •
Manufacture the HE according to the selected design
- •
- 4.
Experimental testing:
- •
Install the HE and conduct testing
- •
Measure temperature, flow rate, and actual performance
- •
Compare experimental results with theoretical calculations and ANSYS simulation results
- •
- 5.
Error check:
- •
Calculate the error between the methods (theoretical calculation, ANSYS simulation, and experimental testing)
- •
If the error does not exceed 10%, the results are considered acceptable
- •
After measurements and calculations, the fluid properties including specific heat capacity (Cp) dynamic viscosity, and thermal conductivity (k) were used in the equations shown in Table 1. This condition is one of the key factors in determining the size, number of tubes, inlet diameter, tube length, and the type of materials used in the design of the HE.
| Hot side | Cold side | |
|---|---|---|
| Working fluid | Oil | Jet A1 fuel |
| Flow rate (lpm) | 2.5 | 9 |
| Inlet temperature (°C) | 130°C | 20°C |
| Thermal conductivity (W/m.K) | 0.1187 | 0.145 |
| Heat capacity (J/(kg.K) | 2067 | 2219 |
| Dynamic viscosity (Pa.s) | 0.00255 | 0.0013 |
2.1. Numerical Computation for Selecting Size and Tube Numbers
Based on a review of various references related to HE calculations, the thermal conductivity method was selected to evaluate heat transfer between fluids and the tube walls. Thermal conductivity is an intensive property of materials that characterizes their ability to conduct heat. This method provides a reliable framework for estimating the temperature transfer between different materials [36, 37]. Following this approach, the appropriate number of tubes is determined to meet the desired fluid outlet temperature. Building upon this concept, the process of calculating the performance of a tube-type HE can be divided into five key steps, starting from selecting the number of tubes to estimating the final outlet temperature. Figure 2 illustrates the nomenclature used in these calculations.

Step 1: selecting the size and number of tubes.
- 1.
The cross-sectional area of the fuel inlet.
- 2.
The cross-sectional area of a single tube.
Let S represent the surface area of the fuel inlet and D1 be its diameter. In Equation (4), n1 denotes the minimum number of tubes required per compartment, while d2 is the outer diameter of a single tube. Based on the calculation, the HE shell is designed to contain four compartments, each housing 20 tubes, resulting in a total of 80 tubes.
Step 2: estimating the heat transfer coefficient.
The next step involves estimating the heat transfer coefficient from the oil to the tube surface. This is achieved using three dimensionless numbers:
Re: Reynolds number.
Pr: Prandtl number.
Nu: Nusselt number.
Let v1 represent the velocity of the oil flowing through the baffles inside the HE shell and Q1 denote the oil flow rate. The Reynolds number (Re1) for oil is calculated using the oil’s density (ρ1) and dynamic viscosity (μ1), along with the characteristic dimension here taken as the outer diameter of the fuel tubes (d1). In Equation (7), Pr1 is the Prandtl number of oil, and Cp1 is the specific heat capacity of oil at 130°C. Both the Nusselt number (Nu1) and the heat transfer coefficient (h1) depend on the same parameter, l, which represents the length of the tube.
Step 3: estimating the heat transfer coefficient from tube to fuel.
Let S2 denote the total internal surface area of the fuel tubes and d2 represent the inner diameter of a single tube, as used in Equation (10). The symbol Qn indicates the flow rate per tube within a compartment. The parameters Re2, Pr2, and Nu2 correspond to the Reynolds number, Prandtl number, and Nusselt number of the fuel, respectively. These are calculated based on the relevant fluid properties and flow conditions.
Step 4: calculating the overall heat transfer coefficient.
In Equation (17), δ represents the tube thickness, which is calculated by subtracting the inner diameter from the outer diameter of the tube. r1 and r2 denote the thermal resistance of the fuel and oil, respectively, while λ3 is the thermal conductivity of steel, the material used for the tubes.
Step 5: calculation of output temperature and tube diameter.
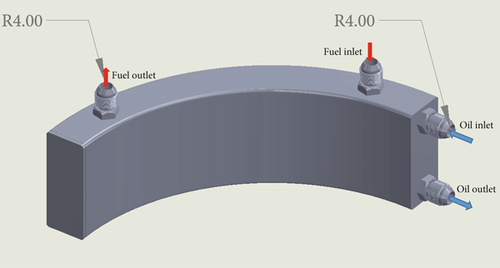
Using the parameters provided in Table 1, the results for the oil temperature and fuel temperature were calculated. The oil temperature decreased by 54°C, from 130°C to 76°C, while the fuel temperature increased by 20°C, from 20°C to 40°C. These results align with both the engine’s operating conditions and our expectations. After the calculations, a 3D model of the heat recovery system was designed using 3D software. A visual representation of the components of the system is shown in Figure 3, offering a schematic overview.
Our next step is to use CFD to simulate the temperature distribution of the fluid flowing through the pipes and sectors. CFD helps identify temperature variations across different parts of the HE, allowing us to assess the accuracy and efficiency of our theoretical calculations.
2.2. CFD Modeling
2.2.1. Geometry Setup
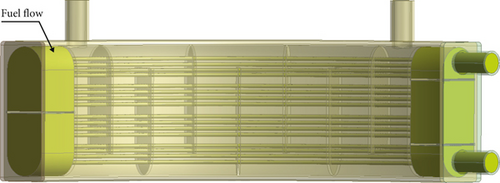
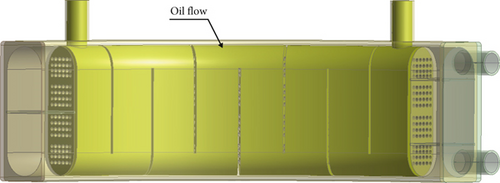
The modeling calculations need to be divided into two main regions for simulation. The first region, which involves the fluid flowing through the pipes, represents fuel, while the second region, passing through the baffles, represents oil. There are two steps involved in creating these regions. First, the inlets and outlets are enclosed by creating planes at the locations of the inlets and outlets. Next, the HE is filled with liquid using the fill command in the CFD software. These regions are then labeled according to their defined names in the body details. Figures 4 and 5 illustrate the hot and cold regions within the HE.
When meshing the hot and cold regions, different local sizings were selected with appropriate values to achieve optimal orthogonal quality. The concept of mesh orthogonality refers to how closely the angles between adjacent element faces approach the ideal angles. Cells with poor orthogonal quality will have values close to 0, while cells with excellent orthogonal quality will have values close to 1 [40].
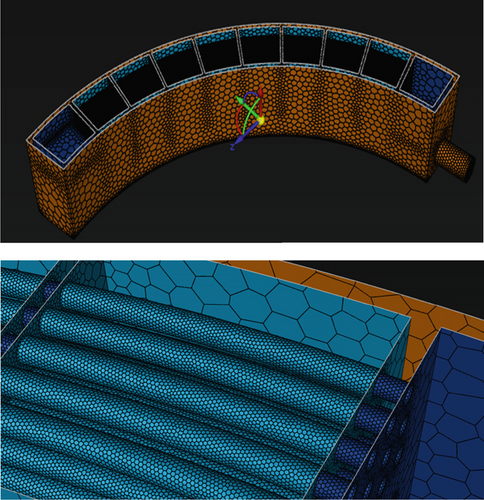
The flow regions are meshed using an unstructured mesh type. The element size is chosen freely, but it is constrained to be no larger than 1 mm and no smaller than 0.5 mm. The mesh growth rate is set to 1.1 for all regions. A total of five boundary layers are created, with a growth rate of 0.1. The mesh and its boundary layers are shown in Figure 6. Once the meshes for both regions are combined, they form a complete computational mesh. After the combination, the total number of elements in the configuration is seven million.
2.2.2. Physical Configuration Setting
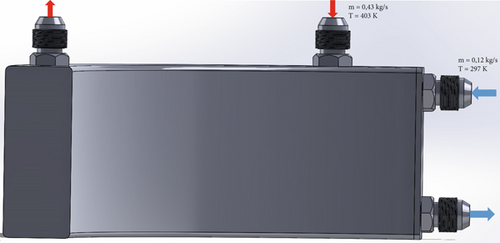
The tube region is connected with the hot flow and cold flow regions for the simulation. The results of the simulation are linked through an interface with a nonoverlapping condition. ANSYS Fluent is selected to solve the 3D Navier–Stokes equations, using the k-ε turbulence model and scalable wall functions to enclose the equations. Jet A1 is used as the fluid flowing through the pipes, while the fluid to be cooled is oil. The boundary conditions are defined based on the design point conditions. The boundary conditions for the inlet and outlet of both the hot flow and cold flow are shown in Figure 7. Both the scheme and turbulence are set to high resolution to improve the accuracy of the configuration.
The environment used for running simulation is similar to the laboratory environment where the jet engine experience. The testing environment for the HE is set at sea level, with a height of 0 m. The ambient temperature is maintained at a constant 20°C, and the atmospheric pressure is 1 atm. There is no wind, with a wind speed of 0, and the air is perfectly dry, as there is no humidity present. Gravity is disregarded for the purposes of this test, creating an idealized, controlled environment for accurate measurements and testing of the HE’s performance. To evaluate convergence, quantities such as mass flow, pressure, and temperature were monitored. A total of 1000 iterations were performed.
2.2.3. Calculation Result
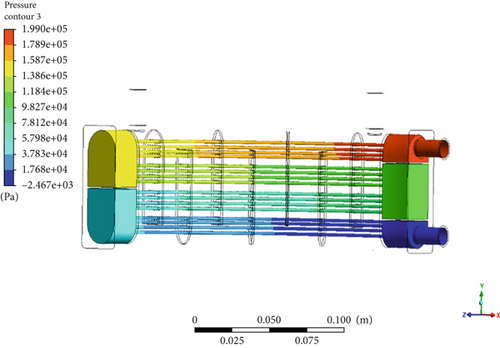
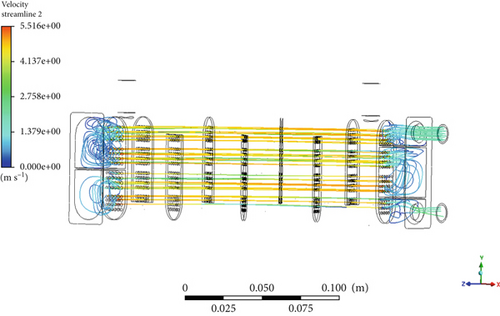
The total time required to complete the calculation was 2 h using a high-performance computing hardware configuration with 320 cores and eight clusters running in parallel. The convergence graph indicates that the calculation fully converged within 1000 iterations, with rapid convergence achieved after the 466th iteration. As a result, this data can be used to analyze and assess the aerodynamic properties. The outlet temperature, pressure distribution through the pipes and baffles, and fluid velocities are shown in Figures 8, 9, and 10.
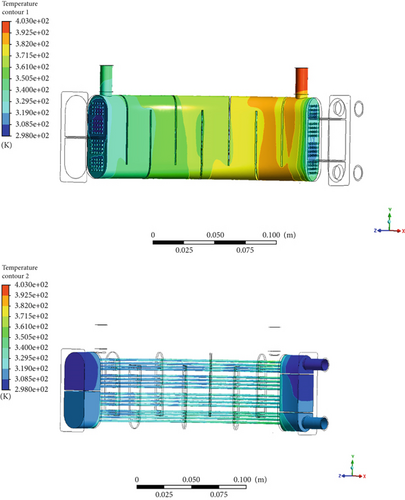
As shown in the results, the oil temperature decreases from 130°C to approximately 80°C, resulting in a 40% heat recuperation. Additionally, the fuel temperature increases from 20°C to 38°C, representing a 90% rise. Upon closer inspection of the temperature distribution, the heat loss is evenly distributed across the tubes and baffles. Comparing the simulation results with the numerical calculations, the error is less than 10%, which is an acceptable discrepancy, indicating that the simulation results closely align with the theoretical calculations. Moreover, these results meet the design requirement of a 40% heat recovery.
In Figure 9, the pressure loss when fuel flows through the pipes is minimal. The difference between the fuel inlet and outlet pressure is around 2 atm, which is within an acceptable range, meaning the system does not require excessive energy to maintain the process, thus minimizing energy loss. Regarding the velocity results, the flow is uniform across all pipes, and no blockages are observed at any point in the system. The velocity is adequate for the fluid to pass through the pipes and exit through the outlet. After conducting both theoretical calculations and simulations in ANSYS Fluent, it is evident that the HE configuration performs well. Consequently, we have decided to proceed with the construction of a physical model of the HE and validate the results in a laboratory setting.
2.3. Experimental Setup
2.3.1. Setting System
The tube heat recovery system designed for use in a turbojet engine was constructed, and an experiment was conducted to evaluate its accuracy. To closely replicate real engine conditions, the experimental setup was made nearly identical to the systems installed on the engine surface. The primary fluid used was Mobil Jet A1 oil, heated to the required temperature using an electric heating unit. To ensure proper circulation, a suction pump was installed immediately after the heating unit to maintain a consistent flow of oil throughout the system. The closed-loop system was composed of stainless steel pipes with a diameter of 0.02 m, connecting all the components. These pipes were chosen for their ability to withstand extreme conditions, including high temperatures exceeding 500°C and resistance to corrosion. For the secondary fluid circuit, Jet A1 fuel at ambient temperature was used to exchange heat with the oil. A second suction pump was included to ensure the fuel flow rate matched the conditions specified in Table 1. To monitor thermal performance, the inlet and outlet temperatures of both oil and fuel were measured using thermocouple sensors—devices commonly used for heat measurement. Two thermocouples were placed just before the inlets of the oil and fuel lines, and two more were positioned immediately after their respective outlets. These sensors consist of two dissimilar metal wires joined at one end and connected to a thermocouple thermometer at the other. Properly configured, thermocouples can accurately measure temperature over a wide range. With an accuracy rating of 0.25%, as stated by the manufacturer, these sensors offer high reliability. Additionally, two pressure sensors were installed alongside the fuel-line thermocouples to measure pressure loss after passing through the tubing.
2.3.2. Test Performance and Result
At this stage, the tube HE underwent an extensive series of tests to evaluate its efficiency. The oil was heated to a temperature of 130°C, and its flow velocity was maintained consistently at 1.9 m/s. The fuel, initially at ambient laboratory temperature (20°C), was pumped through the system until it reached a velocity of 0.53 m/s. Each test was conducted over a duration of 15 min, and to ensure accuracy and repeatability, the procedure was repeated five times. To support analytical calculations and comparisons, the average temperatures at both the inlet and outlet of the HE were recorded. The final results are presented in Table 2.
| Oil result | Fuel result | |
|---|---|---|
| Temperature inlet | 130°C | 20°C |
| Temperature outlet | 80°C | 38°C |
| Pressure inlet | 2 atm | 4.2 atm |
| Pressure outlet | 1.9 atm | 2.5 atm |
After the experiment, the results aligned well with the performance targets outlined in the introduction. The difference between the simulation and real-life experiment was minimal, confirming that the calculation method is reliable for selecting the appropriate size and number of tubes for the HE.
3. Conclusion
This study was aimed at designing and experimentally evaluating a heat recovery system using heat pipe technology to reduce the temperature of oil flow and transfer the recovered heat to the fuel stream. The research addressed the challenge of improving lubrication quality by lowering oil temperature to meet the required viscosity while simultaneously increasing fuel temperature to enhance ignition performance. Notably, this work is critical, as the HE serves to protect the aircraft engine during operation. The developed system not only minimizes oil waste used for bearing lubrication but also allows for a smaller oil tank, thereby reducing overall engine weight. Beyond aviation, this technology can be applied in various industries requiring heat recovery between two fluids, such as in automotive and refrigeration systems. With correct tube configuration, this type of HE brings multiple benefits, including energy savings and reduced operational risk.
The study was conducted in three main phases: theoretical calculations, CFD simulations to create a 3D prototype, and the fabrication of a physical model for experimental validation. The system achieved an efficiency of approximately 40%, depending on engine working temperatures and flow rates. The experimental results closely matched the simulation and theoretical outcomes, confirming the accuracy of the applied formulas and the effective use of ANSYS Fluent.
During engine operation, the observed temperatures of oil and fuel were nearly identical to the laboratory test values. The system operated smoothly without significant pressure loss. The amount of lubricating oil wasted was notably reduced due to effective heat recovery, which in turn allowed for a lighter oil tank. Fuel reached ignition temperatures more efficiently, and the HE itself, weighing less than 1 kg, added minimal mass to the engine. Its compact and simple structure facilitates easy manufacturing and testing, supporting large-scale production. The use of low-cost, readily available materials also provides a competitive edge over other HE designs.
In conclusion, this research highlights the potential of heat pipe–based heat recovery systems to enhance sustainability across a range of sectors. While the system demonstrated effective temperature regulation, the primary goal was to present a practical and efficient method for building a HE. However, other factors influencing performance, such as flow rate and pressure, were not fully addressed.
Future research should investigate the impact of fluid dynamics on system efficiency. Specifically, exploring the effects of mass flow and pressure variations will offer a more comprehensive understanding of the HE’s performance and guide improvements for future iterations.
Nomenclature
-
- Q
-
- specific heat, joules
-
- m
-
- mass of the object, grams
-
- c
-
- specific of object, J/(g−°C)
-
- ΔT
-
- change in temperature, degrees Celsius
-
- dQ/dT.A
-
- power per unit area transported
-
- k
-
- thermal conductivity, W/(m.K)
-
- ΔT/Δx
-
- temperature gradient
-
- S
-
- fuel inlet area, square meters
-
- D1
-
- oil diameter, meters
-
- n1
-
- number of tube per compartment
-
- v1
-
- oil velocity, meters per second
-
- Q1
-
- oil flow rate, liters per minute
-
- Re1
-
- oil Reynold number
-
- p1
-
- oil density, kilograms per cubic meter
-
- d1
-
- outside tube diameter, meters
-
- μ1
-
- oil dynamic viscosity, Pa.s
-
- Pr1
-
- oil Prandtl number
-
- Cp1
-
- oil heat capacity, J/(kg.K)
-
- λ1
-
- oil thermal conductivity, W/(m.K)
-
- Nu1
-
- oil Nusselt number
-
- h1
-
- oil heat transfer coefficient, W/(m2.K)
-
- S2
-
- area of tube section, square meters
-
- d2
-
- inside tube diameter, meters
-
- Qn
-
- flow rate per tube, liters per minute
-
- Q2
-
- fuel flow rate, liters per minute
-
- v2
-
- fuel velocity, meters per second
-
- Re2
-
- fuel Reynold number
-
- p2
-
- fuel density, kilograms per cubic meter
-
- μ2
-
- fuel dynamic viscosity, Pa.s
-
- Cp2
-
- fuel heat capacity, J/(kg.K)
-
- λ2
-
- fuel thermal conductivity, W/(m.k)
-
- Pr2
-
- fuel Prandtl number
-
- f
-
- Darcy friction
-
- Nu2
-
- fuel Nusselt number
-
- h2
-
- fuel heat transfer coefficient, W/(m2.K)
-
- δ
-
- tube thickness, meters
-
- K
-
- total heat transfer coefficient
-
- r1
-
- oil thermal resister, m2.K/W
-
- r2
-
- fuel thermal resister, m2.K/W
-
- d
-
- tube mean diameter, meters
-
- N
-
- quantity of heat, joules
-
- F
-
- total heat transfer area, square meters
-
- T1o
-
- oil inlet temperature, degrees Celsius
-
- T2o
-
- oil outlet temperature, degrees Celsius
-
- T1f
-
- fuel inlet temperature, degrees Celsius
-
- T2f
-
- fuel outlet temperature, degrees Celsius
Conflicts of Interest
The authors declare no conflicts of interest.
Funding
This work was supported by Viettel Aerospace under Viettel Group.
Open Research
Data Availability Statement
Research data are not shared.


