A 3D Multipath Planning Method for Guided Vehicles Using Improved A ∗ Algorithm Based on Multiple Avoidance Tactics and Terminal Attack Angles
Abstract
Existing path planning methods have limitations such as random solutions, lack of sharing initial and terminal waypoints, and rare consideration of avoidance between multipaths in 3D. This paper presents a 3D multipath planning method for guided vehicles by employing an improved A ∗ algorithm based on multiple avoidance tactics and terminal attack angles, which searches for a unique solution in restricted waypoint quantities under real-time conditions and solves four major problems. Intelligent optimization algorithms have the characteristics of random multiple solutions, whereas Classical A ∗ approaches show time consumption, insufficient smoothness, unsettable terminal attack direction, and collisions between multiple paths. To address these limitations, a terminal attack course orientation is achieved by solving the base unit vector, an engineering practical and implicit approach of node extension is built by extending the horizontal and vertical margin vectors, new tactics for terrain and threat zone avoidance are developed by filtering subnodes below the Earth’s surface with bilinear interpolation, and a detection tactic based on point-in-polygon checking is used to realize horizontal route avoidance with a better effect. The criteria used to measure multipath planning effectiveness include path length, path smoothness, avoidance capability, terminal attack angle settablity, and search time. Simulation results in two attack situations, three different degrees of freedom modes and 10 real-world scenarios demonstrate that the improved A ∗ search algorithm has higher efficiency and better performance than classical algorithms. The 3D multipath planning method shortened the search time by 91.4%, reduced the number of path nodes by 96.9% for Mode 1, improved the direction smoothness by 100% for Mode 3, and improved the pitch smoothness by 99.6% for Mode 2. The research not only provides practical tools for antisurface target operations and simulations but also offers new perspectives and methodological references for researchers in related fields.
1. Introduction
Multipath planning for guided vehicles is a global optimization issue that aims to program an optimal path for each vehicle from a common initial waypoint to a common terminal waypoint, under the condition that specific indicators meet specific constraints. Whether online, offline, optimal, or cooperative, path planning is basically divided into four types of basic methods: intelligent optimization algorithms, including simulated annealing algorithms, genetic algorithms [1–3], particle swarm optimization (PSO) algorithms [4–6], grey wolf algorithm [4], evolutionary algorithm [7], gravitational search algorithm [8], and ant colony algorithm; artificial potential field (APF) method [9]; mathematical-based planning methods, including nonlinear planning algorithms and dynamic planning algorithms; and graphical-based methods, including the Voronoi diagram method [10], rapidly exploring random tree (RRT) and variants, visibility binary tree algorithm, and A ∗ algorithm [11].
In the literature, there are several proposals for addressing optimal path planning and multipath planning problems. Multipath planning for guided vehicles represents a global optimization challenge, aiming to devise an optimal path for each vehicle as it traverses from a common starting waypoint to a common terminal waypoint, all while ensuring that specific performance indicators satisfy predefined constraints. Path planning, regardless of whether it is conducted online, offline, with an emphasis on optimality, or in a cooperative context, can be comprehensively categorized into four principal types of methodologies.
Intelligent optimization algorithms include simulated annealing algorithms, genetic algorithms [1–3], PSO algorithms [4–6], grey wolf algorithm [4], evolutionary algorithm [7], gravitational search algorithm [8], and ant colony algorithm. Based on Bellman’s optimality principle, a dynamic programming-genetic algorithm (DPGA) [1] is developed. By dividing the entire planning space into multiple sequential stages and applying genetic algorithms for optimization at each stage, the DPGA not only has a higher computational efficiency than the dynamic programming algorithm but also has a higher convergence probability and efficiency than the genetic algorithm. For the delivery problem in chain restaurants, [2] introduces an adaptive genetic algorithm. This algorithm refines traditional crossover and mutation operations by making adaptive adjustments according to the fitness of individuals and the population, thus effectively avoiding local optima. In the UAV/UGV cooperative system, a hybrid path planning algorithm [3] is proposed, which is a mixture of a genetic algorithm for global path planning and a local rolling optimization that constantly optimizes the results of the genetic algorithm. The improved PSO algorithm [4] integrates the grey wolf optimization algorithm [4], chaos theory, and adaptive inertial weights. During the evolutionary process, the grey wolf optimizer sorts particles to identify those with optimal fitness values, which then guide the search of other particles, enhancing the PSO algorithm’s global search ability. The parallel implementation of genetic and PSO algorithms, as studied in [5, 6], improves the real-time performance of UAV route planning. By separately evaluating and evolving waypoints, an evolutionary algorithm for single UAV path planning in complex 3D environments [7] is proposed. This method addresses the challenges of 3D space expansion, path smoothness and safety requirements for fixed-wing UAVs, and the rapid increase in calculation scale due to more obstacles and waypoints. A hybrid strategy based on the gravitational search algorithm for UAV path planning was presented in [8]. This strategy includes an adaptive adjustment mechanism for the gravity constant attenuation factor and the Cauchy mutation strategy. By constructing an objective function considering flight length cost, threat area cost, and turning angle constraints, this method reduces flight risks and generates smoother paths, demonstrating advantages in solution quality, robustness, and constraint-handling capabilities. Although not elaborated in detail in the reviewed literature, ant colony algorithms are an important part of intelligent optimization algorithms for path planning.
In [9], future movement prediction was integrated into the APF method. This innovation enables autonomous ground vehicles (AGVs) to reduce travel route length, improve path smoothness, and avoid local minima, enhancing the overall path-planning performance.
Mathematical-based planning methods consist of nonlinear planning algorithms and dynamic planning algorithms. Although not extensively detailed in the previously reviewed literature, these methods form the fundamental theoretical frameworks for path planning. They often serve as the basis for more complex path-planning strategies, frequently combined with other techniques to achieve optimal or suboptimal path solutions.
Graphical-based methods include the Voronoi diagram method [10], RRT and variants, visibility binary tree algorithm, and A ∗ algorithm [11] or its special case, Dijkstra algorithm [12]. The A ∗ algorithm [11] is a well-known heuristic optimal search method. It selects the node with the smallest heuristic function value in the search space for expansion during each iteration. Scholars, both domestic and international, have made numerous improvements to the A ∗ algorithm, including modifications to the dynamic or optimal weight heuristic function [13, 14], the implementation of an adaptive modifying step [15], integration with the dynamic window method [15], combination with the APF method [16], the use of the potential energy field to more accurately represent the environment [17], the adoption of a bidirectional search strategy [18], the incorporation of reinforcement learning strategies [19], and the utilization of meta-heuristics [20].
In addition to the abovementioned path-planning methods, there are other notable research efforts. For example, a suboptimal path-planning solution based on the game theory framework was proposed in [21].
In the area of multipath planning, which has become a focal point of research among scholars globally, the main goal is to preplan multiple routes and then select an appropriate route according to specific requirements during mission execution. To solve the rendezvous problem of multiple UAVs traveling from different initial waypoints to a common terminal waypoint, [22] proposed a solution based on reaching a consensus among the UAVs regarding the estimated time of arrival at the rendezvous point. This approach, involving velocity control, wandering maneuvers, inter-UAV communication, and the application of lateral accelerations to increase the line-of-sight rate between UAVs on a potential collision course, enables rendezvous while ensuring collision avoidance. Existing multipath planning methods include the evolutionary algorithm based on topological diversity [23], the genetic algorithm using path construction of a binary tree [24], the homotopic path- planning approach for a UAV swarm [25], the multipopulation chaotic grey wolf optimization algorithm [26], the personalized multigroup sparrow search algorithm [27], and the improved PSO [28]. As generalized shortest path algorithms, the k-shortest path algorithms, such as the multilabel algorithm [29] and the k-shortest paths based on A ∗ (KSPA) algorithm [30], also fall within the category of multipath planning. However, it is important to note that these methods are mainly applicable to vector maps or multigraphs and are not suitable for digital raster or grid maps.
Because the optimal path planning generated by the intelligent optimization algorithm has a random solution, the existing multipath planning algorithms do not share the initial waypoint and terminal waypoint, and avoidance between multipaths is rarely considered in 3D. To overcome these limitations, a guided vehicle multipath planning method based on an improved A ∗ search algorithm is proposed to realize a saturation attack from preset angles in a manner that obeys a uniform symmetric distribution, which is useful for antisurface target operations and simulations.
- 1.
A 3D multipath planning method for guided vehicles using an improved A ∗ algorithm based on multiple avoidance tactics and terminal attack angles is proposed to solve diverse multipath planning problems.
- 2.
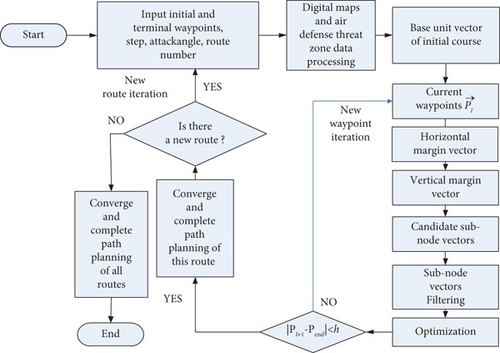
The proposed multipath planning method includes six operations: initial course orientation based on the terminal attack angle, horizontal margin constraint, vertical margin constraint, candidate subnode vector calculation, subnode vectors filtering by multiple avoidance tactics, optimization, iteration, and convergence.
- 3.
A set of experiments and studies demonstrates that the proposed multipath planning method successfully solves diverse multipath planning problems arising from numerous complex environments faced by guided vehicles.
We propose the following six assumptions: (a) Guided vehicles can avoid threats by making sharp turns rather than coordinated turns [12]. (b) Considering that the movement of the no-fly zone is relatively static with respect to the flight speed of a guided vehicle, it can be simplified as a known fixed threat. (c) Even if the vehicle’s launching point and target are in the normal maneuvering state, the route planned in this study is effective within a certain time range. If it exceeds the time range, it will be periodically replanned by the vehicle planning system until the launch moment. The planned route is uploaded to the vehicle at the launch moment and is effective during the entire flight phase. (d) Only one vehicle is assigned to a planned path. (e) In order to ensure that the vehicle follows the planned route, the wind speed is required to be no more than 15 m/s, and the sea condition is lower than Level 5.
The remainder of this paper is organized as follows. Section 2 describes the procedure and formulation of the proposed improved algorithm. Section 3 provides the application scenarios and presents the results of simulations that demonstrate the performance of the proposal. Finally, the conclusions of this study is drawn in Section 4.
2. Improved Algorithm
Considering only the motion of the vehicle’s center of mass and ignoring the rotation around the center of mass, a right-handed and inertial simulation coordinate system oxyz is created, whose origin o selects the position of the acquisition radar, x-axis points east, y-axis points north, and z-axis points vertically upwards.
To obtain the space vector and displacement of each waypoint, the waypoint coordinate system OXYZ is set up by translating the simulation coordinate system, whose origin O represents the position of the current waypoint, x-axis points east, y-axis points north, and z-axis points vertically upwards. The grid data of the raster digital map are stored in three m × n matrices , , and , where matrix stores the geographically horizontal coordinates of the jth column of the grid, matrix stores the geographically vertical coordinates of the ith row of the grid, and matrix stores the height of the ith row and jth column of the grid. The actual geographic coordinates are (aij, bij, zij) = (xi, yj, z(xi, yj)), corresponding to the grid (i, j, z(i, j)) on the raster digital map. The continuous coordinates of the planned waypoints can be derived from discretized grid points but are not limited to grid points.
2.1. Base Unit Vector of Initial Course Based on Terminal Attack Angle
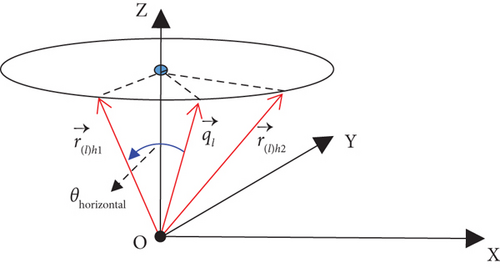
2.2. Horizontal Margin Vector
2.3. Vertical Margin Vector
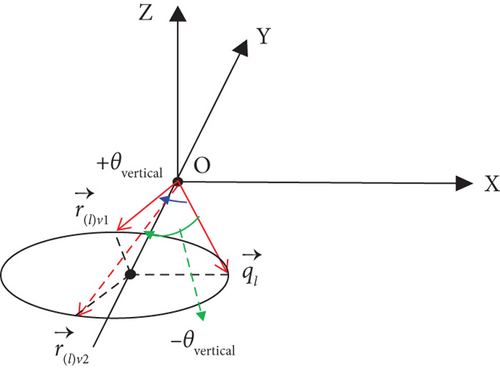
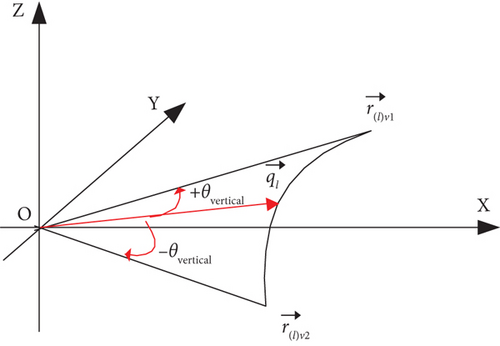
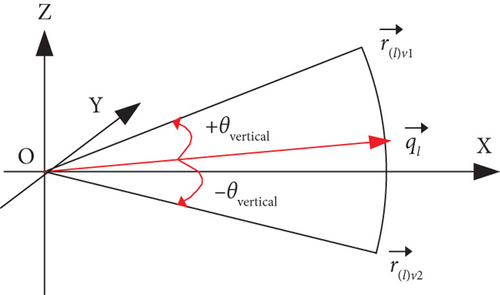
The lth waypoint vector is , whose base unit vector is and the vertical turning limit angle [7, 12] is θvertical; if the vertical margin vector is , the upper margin vector and the lower margin vector are obtained through three different degrees of freedom modes.
2.3.1. Mode 1
2.3.2. Mode 2
2.3.3. Mode 3
2.4. Candidate Subnode Vectors
A spatial region can be constructed by setting the lth waypoint as the origin from step size h and the horizontal and vertical turning restriction angles, θhorizontal, and θvertical. According to Equations (6)–(9), the spatial region can be divided into 16 equal parts to attain 25 candidate subnode vectors depicted in Figure 5, from which the next waypoint will be selected as the optimal solution without constraining the path to grid edges to find “any-angle” path [31] within the turning angle range.
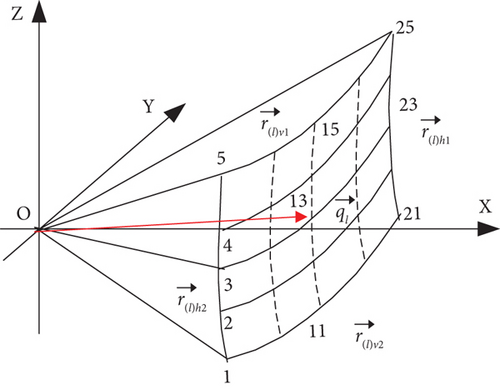
2.5. Subnode Vectors Filtered by Multiple Avoidance Tactics
2.5.1. Terrain Avoidance
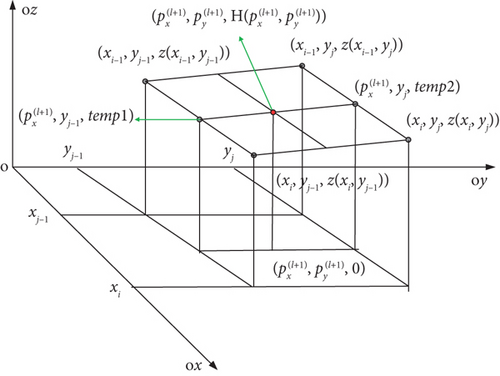
All are deleted [7] from the candidate subnode vector table .
According to Equations (10)–(12), can be obtained. All and are deleted from the candidate subnode vector table .
2.5.2. No-Fly Zone Avoidance
For the safe concealment of vehicle flights, the no-fly zone is considered as an area centered at (Wi,Wj) with threat radius r according to assumption b.
2.5.3. Horizontal Multipath Collision Avoidance
- 1.
Route channel polygon.
Let k waypoint vectors of the planned route i with a smaller absolute value of attack angle successively be , ,…, , excluding the initial waypoint vector and the terminal waypoint vector , whose coordinates of the xoy plane are (Pi1x, Pi1y),(Pi2x, Pi2y),…,(Pikx, Piky). If the width of the route channel is 2d, then (Pi1x, Pi1y + d), (Pi2x, Pi2y + d),…,(Pikx, Piky + d), (Pikx, Piky − d), (Pi(k − 1)x, Pi(k − 1)y − d),…,(Pi1x, Pi1y − d), and (Pi1x, Pi1y + d) form the route channel polygon .
Given , , ,
- 2.
Quadrant number vector.
- 3.
Cross product vector.
- 4.
Quarter angle vector.
Define the quarter angle [32] vectors , where , −qi1 and i = 1, 2, ⋯, 2k.
- 5.
Logical criterion.
For any detection point vector on the XOY plane, detect whether it is in the closed-route channel polygon route or on the boundary using Equations (28)–(29).
After completing the detection, we set the height of the grid points in and on the boundary of the planned route channel as the maximum height of the terrain and no-fly zone.
2.6. Optimization
Take the optimal subnode vector as the (l + 1)th waypoint vector .
2.7. Iteration and Convergence
If the condition is not satisfied by Equation (34) or (35), it is necessary to iterate and determine the next waypoint by using the aforementioned five steps. If the condition is satisfied by Equation (34) or (35), the path planning of this route converges and is completed. All routes with different terminal attack angles are path planned in the above manner.
A flowchart of the 3D multipath planning method for guided vehicles using the improved A ∗ algorithm based on multiple avoidance tactics and terminal attack angles is shown including above 7 steps in Figure 7. And the advantages of the proposed algorithm will be analyzed and verified through the following simulation experiments.
3. Simulation Analysis
Referring to the application scenarios in [33–35], the effectiveness of the proposed method is verified and explored based on two types of typical attack situations and 10 real-world scenarios as shown in Table 1. Among them, Scenarios 1, 3, and 4 are used for the hidden initial waypoint situation without no-fly zone or with five no-fly zones near initial waypoint (islands and reefs) or terminal waypoint on the sea; Scenarios 2, 5, 6, and 7 are used for the hidden terminal waypoint situation without no-fly zone or with five no-fly zones near terminal waypoint (islands and reefs) or in the midway or near initial waypoint on the sea; Scenario 8 is used for algorithm comparison; Scenario 9 as the combination of Scenarios 1 and 4, near initial waypoint (islands and reefs) and near terminal waypoint on the sea; Scenario 10, as the combination of Scenarios 2, 6, and 7, is used for the hidden terminal waypoint situation near initial waypoint and in the midway on the sea and near terminal waypoint (islands and reefs).
| Situation and scenario | 2D initial waypoint | 2D terminal waypoint | No-fly zone |
|---|---|---|---|
|
(489, 449) | (1109, 1069) | r1 = 3 km, r2 = 4 km, r3 = 2 km, r4 = 3.5 km, r5 = 4.2 km, W1 = (559, 539), W2 = (659, 569), W3 = (759, 739), W4 = (609, 739) and W5 = (659, 499) near initial waypoint (islands and reefs) |
|
(1509, 1469) | (489, 449) | The same as Scenario 1, near terminal waypoint (islands and reefs) |
|
(489, 449) | (1109, 1069) | No |
|
(489, 449) | (1109, 1069) | r1 = 3 km, r2 = 4 km, r3 = 2 km, r4 = 3.5 km, r5 = 4.2 km, W1 = (859,839), W2 = (959,869), W3 = (1059, 1039), W4 = (909, 1039), and W5 = (959,799) near terminal waypoint on the sea |
|
(1509, 1469) | (489, 449) | No |
|
(1509, 1469) | (489, 449) | r1 = 3 km, r2 = 4 km, r3 = 2 km, r4 = 3.5 km, r5 = 4.2 km, W1 = (859,839), W2 = (959,869), W3 = (1059, 1039), W4 = (909, 1039), and W5 = (959,799) in the midway on the sea |
|
(1509, 1469) | (489, 449) | r1 = 3 km, r2 = 4 km, r3 = 2 km, r4 = 3.5 km, r5 = 4.2 km, W1 = (1159, 1139), W2 = (1259, 1169), W3 = (1359, 1339), W4 = (1209, 1339), and W5 = (1259, 1099) near initial waypoint on the sea |
|
(460, 420) | (909, 829) | No |
|
(489, 449) | (1109, 1069) | The combination of Scenarios 1 and 4 near initial waypoint (islands and reefs) and near terminal waypoint on the sea |
|
(1509, 1469) | (489, 449) | The combination of Scenarios 2, 6, and 7 near initial waypoint and in the midway on the sea, and near terminal waypoint (islands and reefs) |
3.1. In Hidden Initial Waypoint Situation
The terminal waypoint is located at the grid position (1109, 1069, z(1109, 1069)) at sea, and the initial waypoint is located at the grid position (489, 449, z(489, 449)) near the islands and reefs. Plans 2–8 path for guided vehicles one-to-one in coordinated and stealthy attacks and carry out terrain, no-fly zones, and collision avoidance between multipaths.
Actual digital map parameters for a certain zone: The island sea zone is at the grid position (460–918, 420–838, 1–16), the entire zone is at the grid position (1–1836, 1–1676, 1–16), the accuracy of the grid is 0.09266 km, and the highest elevation is 1.4488 km.
Given that θhorizontal = θvertical = pi/6 rad, waypoint number k ≤ 15, and the basic step size h = 8 km.
3.1.1. Mode 1
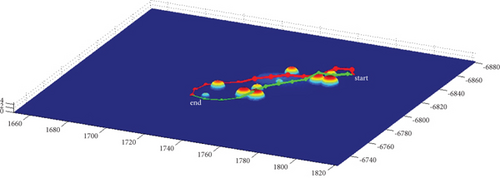
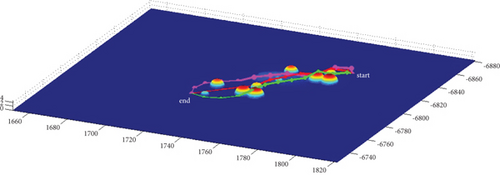
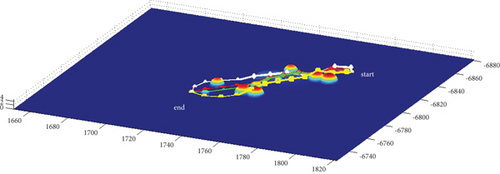
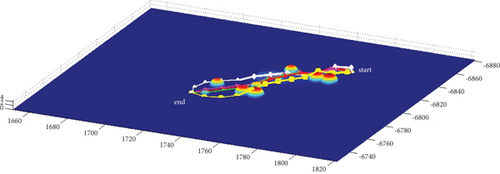
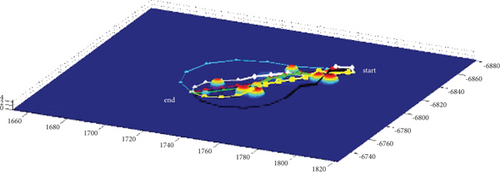
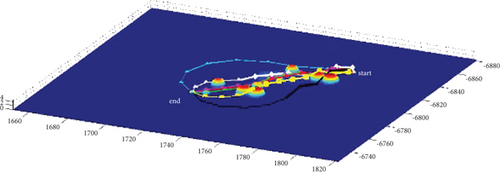
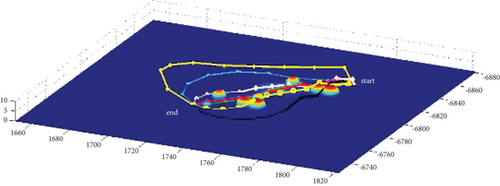
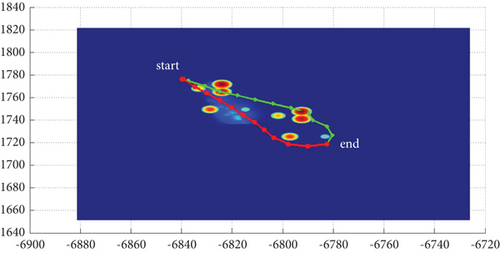
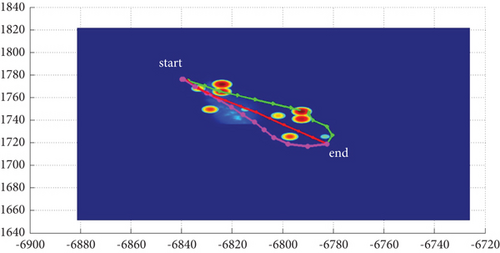
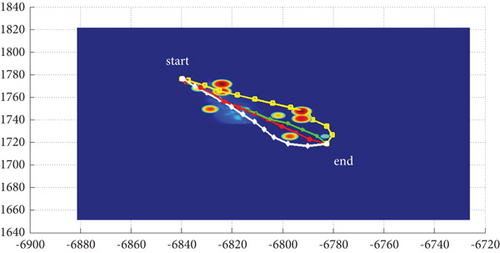
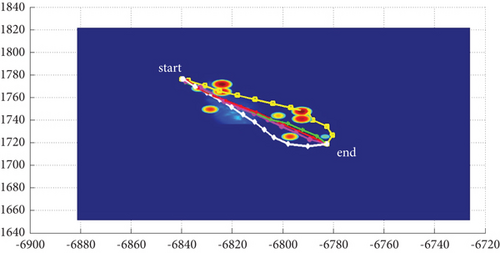
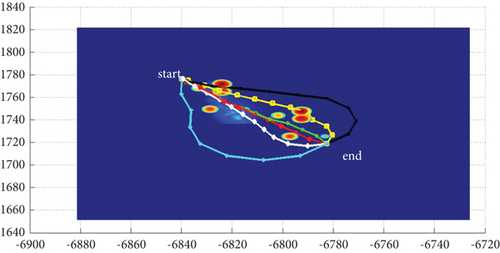
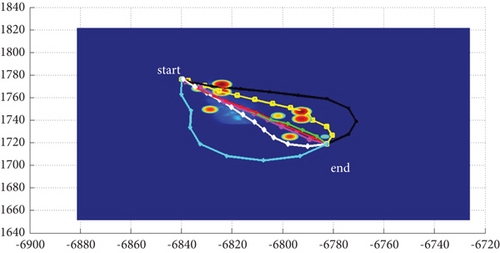
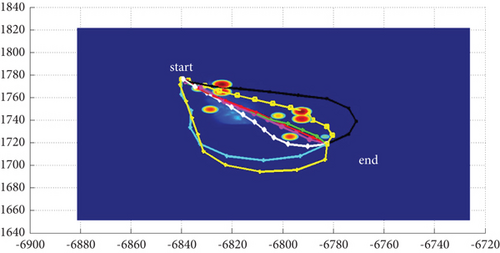
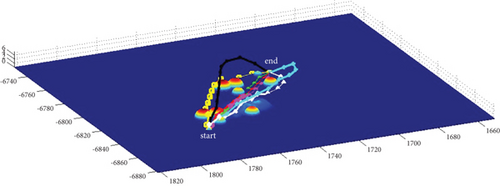
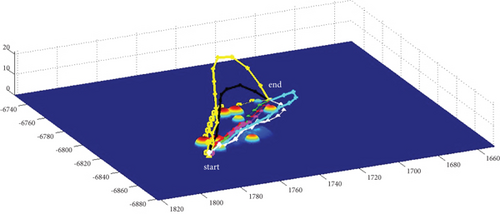
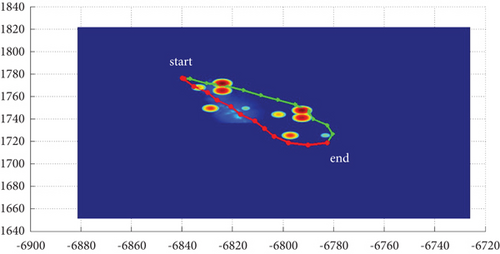
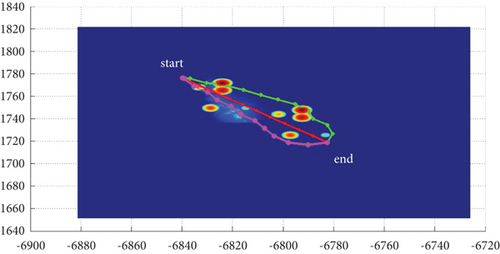
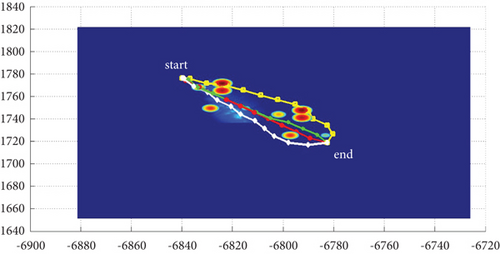
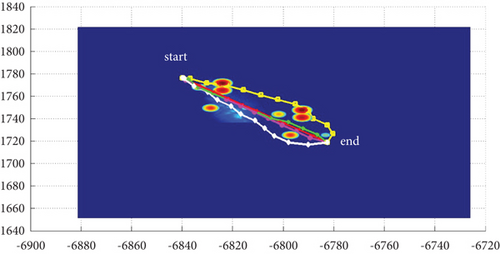
In Scenario 1/9, the azimuth of the reference attacking direction is 3 pi/4 rad, and the multipath planning is shown in Table 2 and Figures 8 and 9. “Start” in all the following figures represents the initial waypoint, and “end” represents the terminal waypoint.
| Path count | Attack angle (rad) | Path length (step size) (km) |
|---|---|---|
| 2-path | -pi/2, pi/2 | 92.15/91.11, 90.97/90.97 |
| 3-path | 0, -pi/2, pi/2 | 83.14/83.14, 92.15/91.11, 90.97/90.97 |
| 4-path | -pi/4, pi/4, -pi/2, pi/2 | 83.30/83.45, 83.14/83.14, 92.15/91.11, 90.97/90.97 |
| 5-path | 0, -pi/4, pi/4, -pi/2, pi/2 | 83.14/83.14, 83.30/83.45, 83.14/83.14, 92.15/91.11, 90.97/90.97 |
| 6-path | -pi/4, pi/4, -pi/2, pi/2, -2pi/3, 2pi/3 | 83.30/83.45, 83.14/83.14, 92.15/91.11, 90.97/90.97, 110.81/110.81 (12), 118.48/118.48 (15) |
| 7-path | 0, -pi/4, pi/4, -pi/2, pi/2, -2pi/3, 2pi/3 | 83.14/83.14, 83.30/83.45, 83.14/83.14, 92.15/91.11, 90.97/90.97, 110.81/110.81 (12), 118.48/118.48 (15) |
| 8-path | 0, -pi/4, pi/4, -pi/2, pi/2, -2pi/3, 2pi/3, 9pi/10 | 83.14/83.14, 83.30/83.45, 83.14/83.14, 92.15/91.11, 90.97/90.97, 110.81/110.81 (12), 118.48/118.48 (15), 144.38/144.38 (15) |
3.1.2. Mode 2
In Scenario 1, the azimuth of the reference attacking direction is 3pi/4 rad, and the multipath planning is shown in Table 3 and Figures 10 and 11.
| Path count | Attack angle (rad) | Path length (h/d ) (km) |
|---|---|---|
| 2-path | -pi/2, pi/2 | 101.34, 94.73 |
| 3-path | -pi/2, pi/2, -2pi/3 | 101.34 (d = 10), 94.73, 124.84 (h = 13) |
| 4-path | -pi/2, pi/2, -2pi/3, 2pi/3 | 101.34 (d = 10), 94.73 (d = 10), 124.84 (h = 13), 107.65 (h = 10) |
| 5-path | -pi/2, pi/2, -2pi/3, 2pi/3, -4pi/5 | 101.34 (d = 10), 94.73 (d = 10), 124.84 (d = 10, h = 13), 107.65 (h = 10), 156.11 (h = 14) |
| 6-path | -pi/2, pi/2, -2pi/3, 2pi/3, -4pi/5, 4pi/5 | 101.34 (d = 10), 94.73 (d = 10), 124.84 (d = 10, h = 13), 107.65 (d = 5, h = 10), 156.11 (h = 14), 120.00 (h = 15) |
| 7-path | -pi/2, pi/2, -2pi/3, 2pi/3, -4pi/5, 4pi/5, -9pi/10 | 101.34 (d = 10), 94.73 (d = 10), 124.84 (d = 10, h = 13), 107.65 (d = 5, h = 10), 156.11 (d = 5, h = 14), 120.00 (h = 15), 172.62 (h = 12) |
| 8-path | -pi/2, pi/2, -2pi/3, 2pi/3, -4pi/5, 4pi/5, -9pi/10, 9pi/10 | 101.34 (d = 10), 94.73 (d = 10), 124.84 (d = 10, h = 13), 107.65 (d = 5, h = 10), 156.11 (d = 5, h = 14), 120.00 (d = 5, h = 15), 172.62 (h = 12), 136.53 (h = 15) |
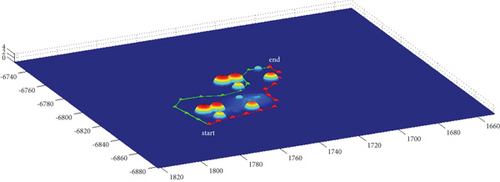
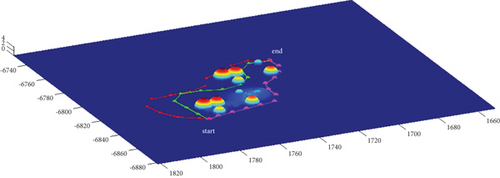
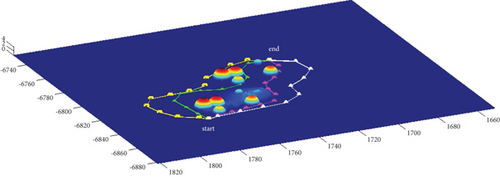
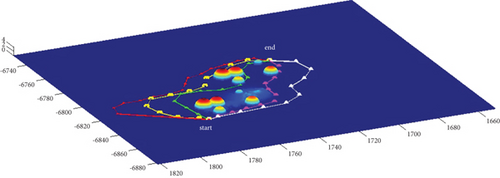
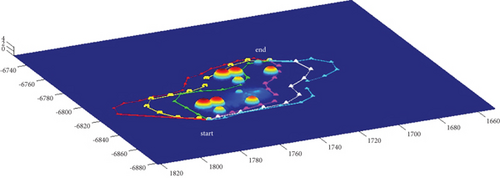
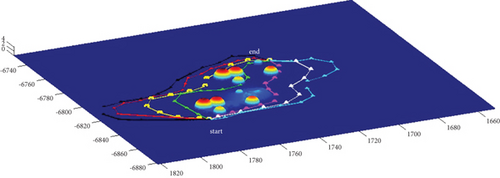
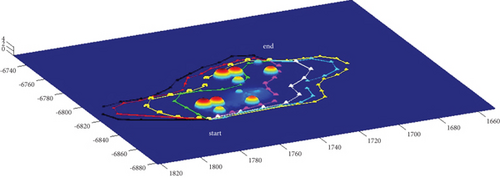
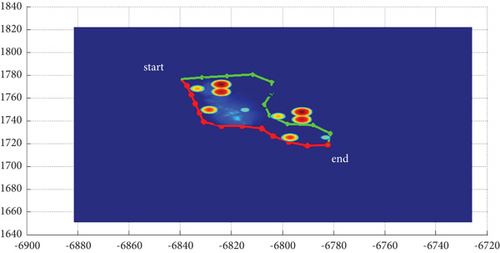
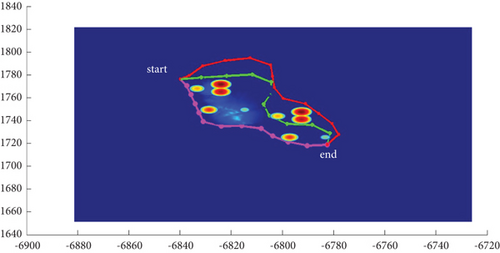
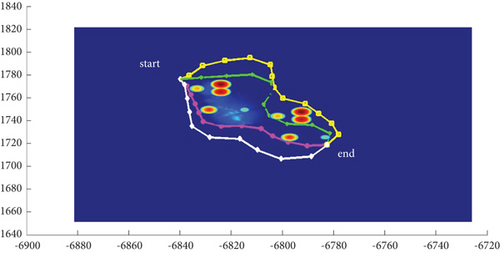
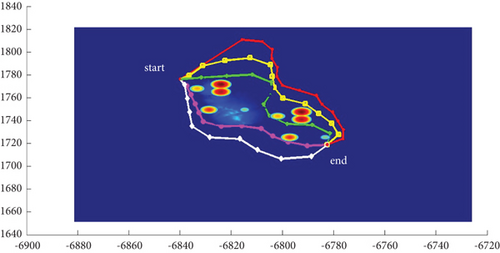
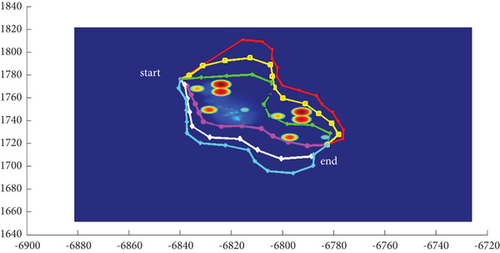
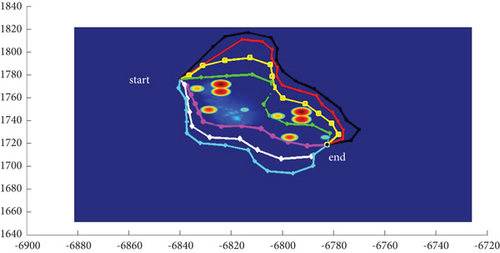
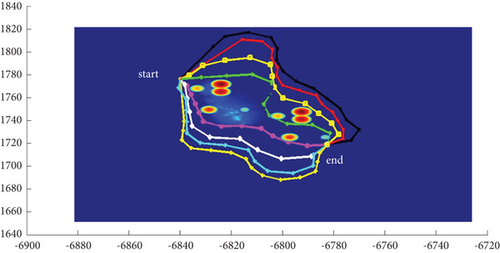
In Scenario 9, the multipath planning is shown in Table 4 and Figures 10 and 11.
| Path count | Attack angle (rad) | Path length (h/d ) (km) |
|---|---|---|
| 2-path | -5pi/9, 5pi/9 | 108.37 (h = 10), 94.41 |
| 3-path | -5pi/9, 5pi/9, -2pi/3 | 108.37 (d = 10, h = 10), 94.41, 124.62 (h = 10) |
| 4-path | -5pi/9, 5pi/9, -2pi/3, 2pi/3 | 108.37 (d = 10, h = 10), 94.41 (d = 10), 124.62 (h = 10), 113.48 (h = 12) |
| 5-path | -5pi/9, 5pi/9, -2pi/3, 2pi/3, -4pi/5 | 108.37 (d = 10, h = 10), 94.41 (d = 10), 124.62 (d = 10, h = 10), 113.48 (h = 12), 154.19 |
| 6-path | -5pi/9, 5pi/9, -2pi/3, 2pi/3, -4pi/5, 4pi/5 | 108.37 (d = 10, h = 10), 94.41 (d = 10), 124.62 (d = 10, h = 10), 113.48 (d = 5, h = 12), 154.19, 137.91 (h = 10) |
| 7-path | -5pi/9, 5pi/9, -2pi/3, 2pi/3, -4pi/5, 4pi/5, -9pi/10 | 108.37 (d = 10, h = 10), 94.41 (d = 10), 124.62 (d = 10, h = 10), 113.48 (d = 5, h = 12), 154.19 (d = 5), 137.91 (h = 10), 170.80 (h = 10) |
| 8-path | -5pi/9, 5pi/9, -2pi/3, 2pi/3, -4pi/5, 4pi/5, -9pi/10, 9pi/10 | 108.37 (d = 10, h = 10), 94.41 (d = 10), 124.62 (d = 10, h = 10), 113.48 (d = 5, h = 12), 154.19 (d = 5), 137.91 (d = 5, h = 10), 170.80 (h = 10), 149.40 |
3.1.3. Mode 3
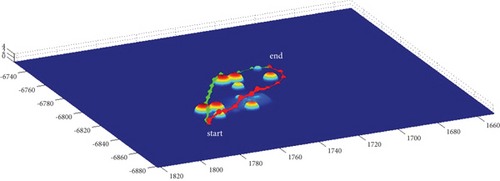
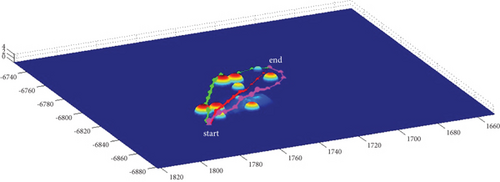
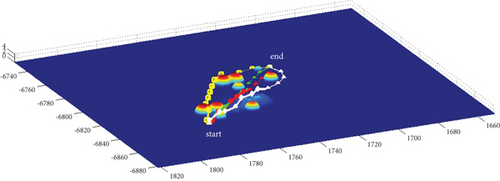
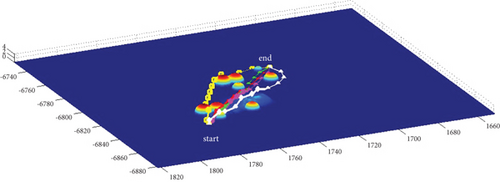
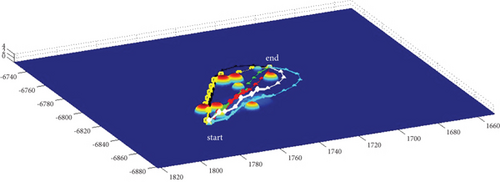
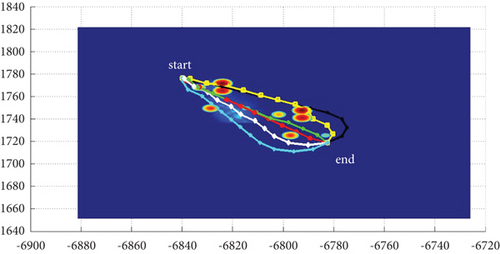
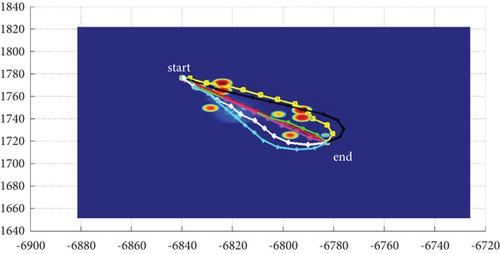
In Scenario 1/9, the azimuth of the reference attacking direction is 3 pi/4 rad, and the multipath planning is shown in Table 5 and Figures 12 and 13.
| Path count | Attack angle (rad) | Path length (step size) (km) |
|---|---|---|
| 2-path | -pi/2, pi/2 | 90.72/91.47, 90.41/90.41 |
| 3-path | 0, -pi/2, pi/2 | 82.44/82.44, 90.72/91.47, 90.41/90.41 |
| 4-path | -pi/4, pi/4, -pi/2, pi/2 | 82.82/83.15, 83.06/83.06, 90.72/91.47, 90.41/90.41 |
| 5-path | 0, -pi/4, pi/4, -pi/2, pi/2 | 82.44/82.44, 82.82/83.15, 83.06/83.06, 90.72/91.47, 90.41/90.41 |
| 6-path | -pi/4, pi/4, -pi/2, pi/2, -2pi/3, 2pi/3 | 82.82/83.15, 83.06/83.06, 90.72/91.47, 90.41/90.41, 98.66/98.57, 98.86/98.86 |
| 7-path | 0, -pi/4, pi/4, -pi/2, pi/2, -2pi/3, 2pi/3 | 82.44/82.44, 82.82/83.15, 83.06/83.06, 90.72/91.47, 90.41/90.41, 98.66/98.57, 98.86/98.86 |
| 8-path | 0, -pi/4, pi/4, -pi/2, pi/2, -2pi/3, 2pi/3, -9pi/10 | 82.44/82.44, 82.82/83.15, 83.06/83.06, 90.72/91.47, 90.41/90.41, 98.66/98.57, 98.86/98.86, 120.48/120.48 (10) |
3.2. In Hidden Terminal Waypoint Situation
The terminal waypoint is located at the grid position (489, 449, z(489, 449)) near islands and reefs, and the initial waypoint is located at the grid position (1509, 1469, z(1509, 1469)) on the sea. Plans 2–8 route for guided vehicles one-to-one in coordinated way, perform terrain and no-fly zones, and avoid multiple routes between routes. The parameter settings for actual digital map and no-fly zone, the horizontal turning limit angle θhorizontal, the vertical turning limit angle θvertical, waypoint number, and the basic step size in Scenario 2, Attack Situation 2, are the same as those for Scenario 1, Attack Situation 1.
3.2.1. Mode 1
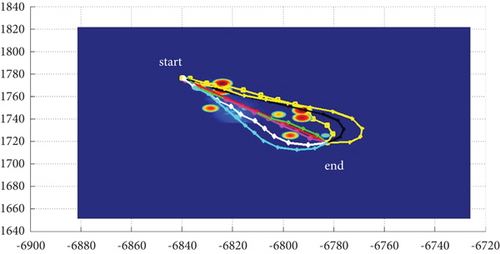
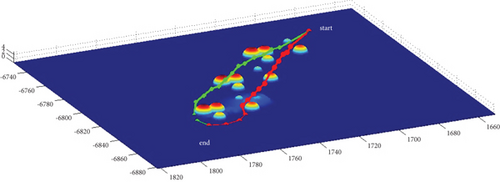
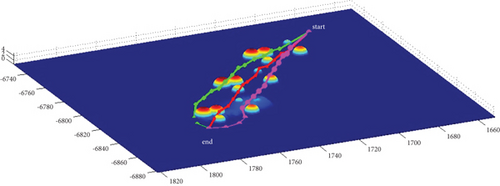
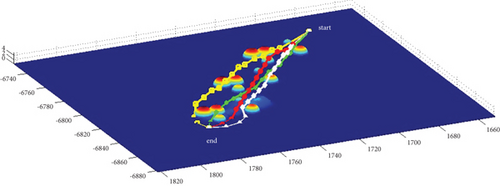
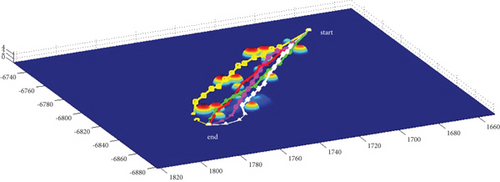
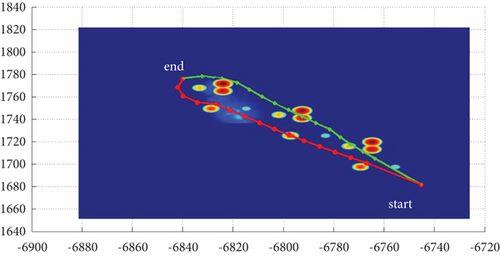
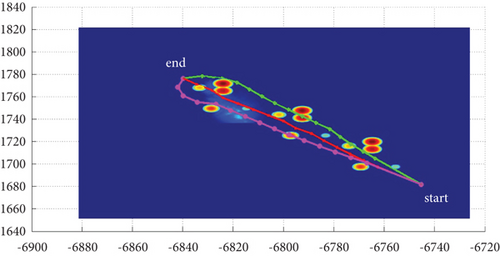
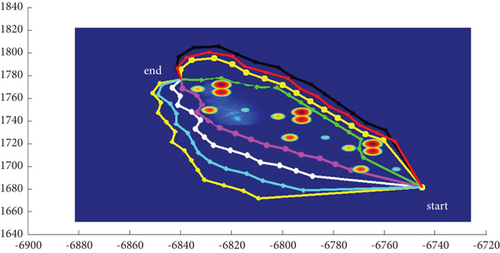
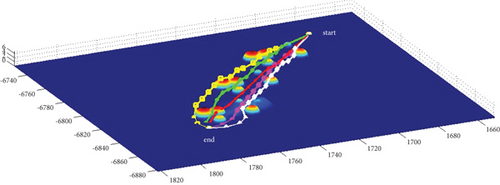
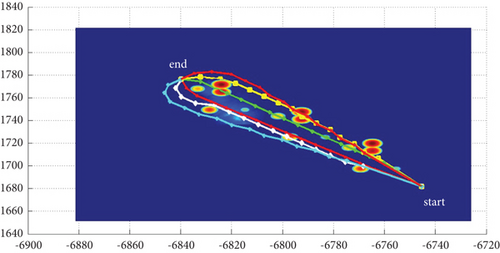
In Scenario 2/10, the azimuth of the reference attacking direction is -pi/4 rad. Each planned path can effectively avoid the no-fly zone and terrain under various constraints, as shown in Table 6 and Figures 14 and 15, respectively.
| Path count | Attack angle (rad) | Path length (step size) (km) |
|---|---|---|
| 2-path | pi/2, -pi/2 | 141.58/141.58, 140.47/140.93 |
| 3-path | 0, pi/2, -pi/2 | 135.19/135.19, 141.58/141.58, 140.47/140.93 |
| 4-path | pi/4, -pi/4, pi/2, -pi/2 | 135.92/135.88, 136.10/136.10, 141.58/141.58, 140.47/140.93 |
| 5-path | 0, pi/4, -pi/4, -pi/2, pi/2 | 135.19/135.19, 135.92/135.88, 136.10/136.10, 141.58/141.58, 140.47/140.93 |
| 6-path | pi/4, -pi/4, pi/2, -pi/2, 2pi/3, -2pi/3 | 135.92/135.88, 136.10/136.10, 141.58/141.58, 140.47/140.93, 158.05/158.70 (12), 163.19/163.19 (15) |
| 7-path | 0, pi/4, -pi/4, pi/2, -pi/2, 2pi/3, -2pi/3 | 135.19/135.19, 135.92/135.88, 136.10/136.10, 141.58/141.58, 140.47/140.93, 158.05/158.70 (12), 163.19/163.19 (15) |
| 8-path | 0, pi/4, -pi/4, pi/2, -pi/2, 2pi/3, -2pi/3, 9pi/10 | 135.19/135.19, 135.92/135.88, 136.10/136.10, 141.58/141.58, 140.47/140.93, 158.05/158.70 (12), 163.19/163.19 (15), 175.48/175.98 (12) |
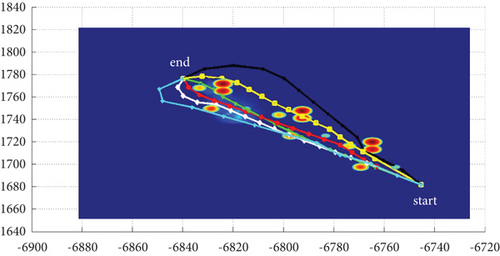
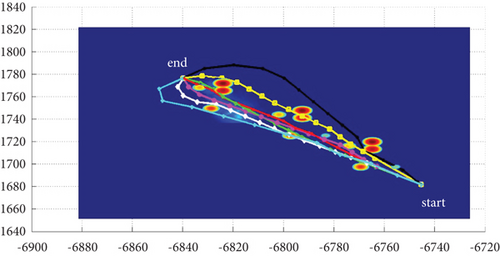
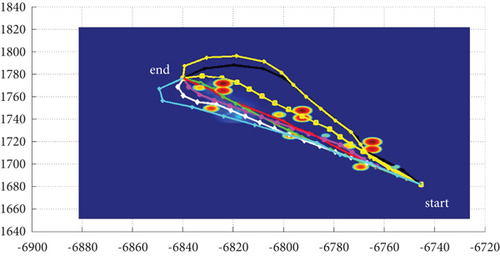
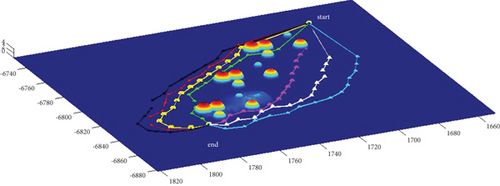
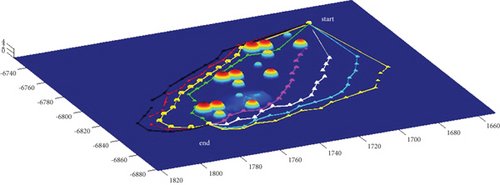
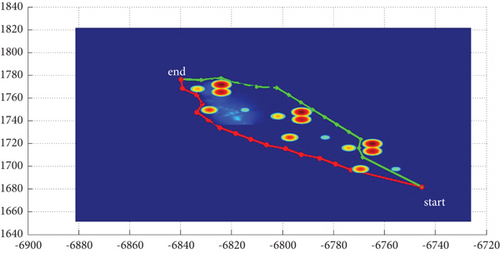
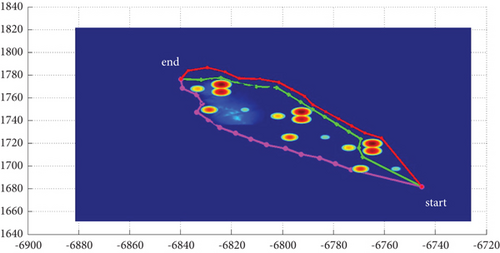
3.2.2. Mode 2
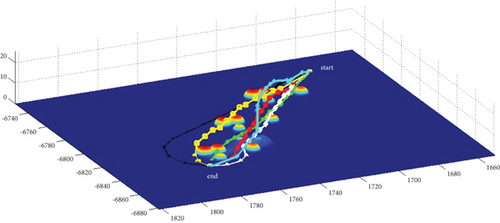
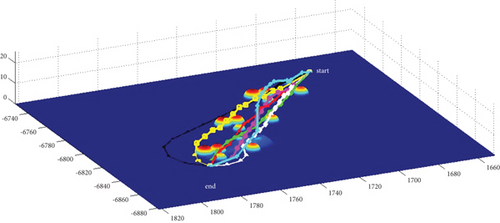
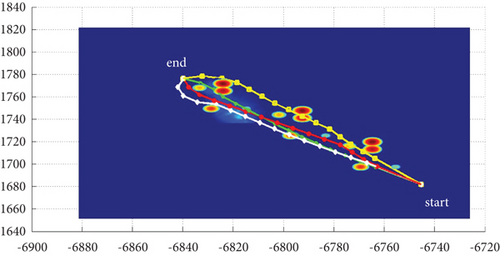
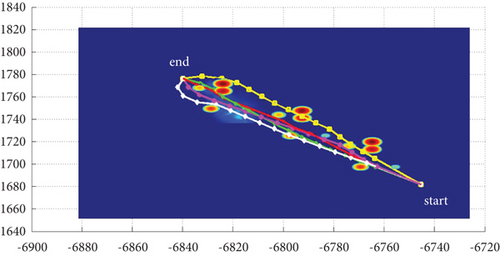
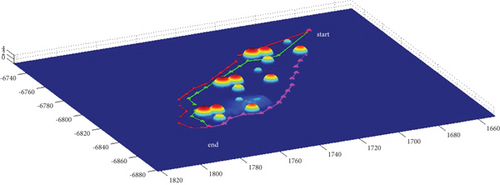
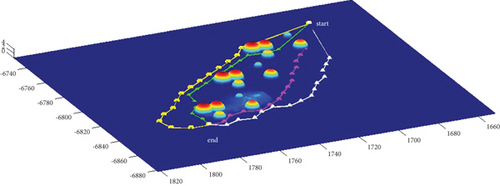
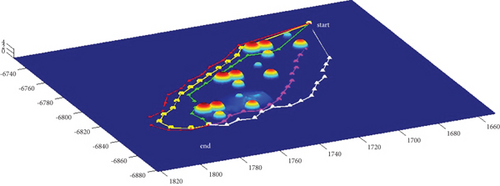
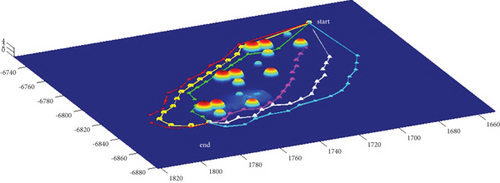
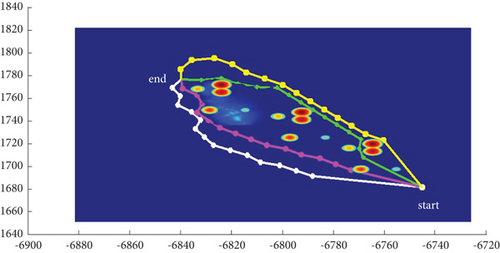
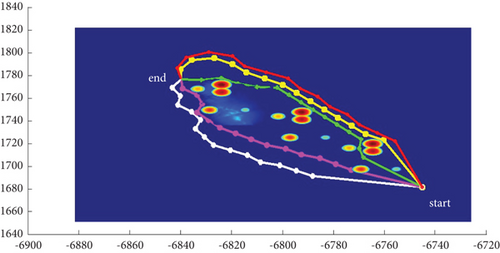
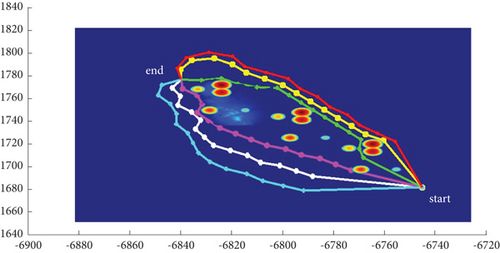
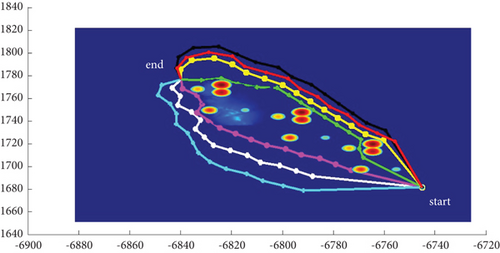
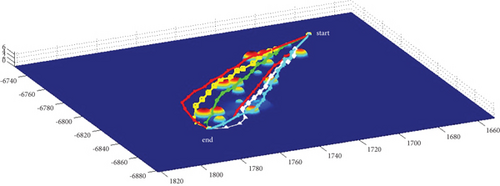
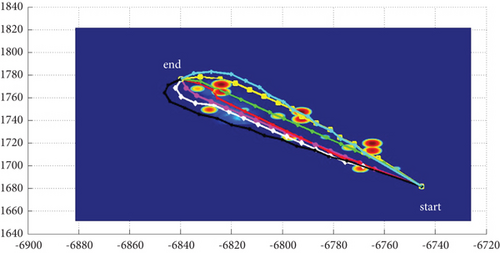
In Scenario 2/10, the azimuth of the reference attacking direction is -pi/4 rad. All the planned paths can effectively avoid the no-fly zone and terrain under larger attack angles with absolute values above pi/2 rad. Most paths are in level flight over the sea with collision-free between horizontal paths, as shown in Table 7 and Figures 16 and 17.
| Path count | Attack angle (rad) | Path length (h/d ) (km) |
|---|---|---|
| 2-path | pi/2, -pi/2 | 144.43/146.86, 143.53/143.58 |
| 3-path | pi/2, -pi/2, 4pi/5 | 144.43/146.86 (d = 4), 143.53/143.58, 156.32/157.59 |
| 4-path | pi/2, -pi/2,2pi/3, -2pi/3 | 144.43/146.86 (d = 4), 143.53/143.58 (d = 15), 168.78/169.78 (h = 9), 156.00/156.00 |
| 5-path | pi/2, -pi/2, 2pi/3,-2pi/3, 4pi/5 | 144.43/146.86 (d = 4), 143.53/143.58 (d = 15), 168.78/169.78 (d = 4, h = 9), 156.00/156.00, 180.73/181.71 (h = 10) |
| 6-path | pi/2, -pi/2, 2pi/3,-2pi/3, 4pi/5, -4pi/5 | 144.43/146.86 (d = 4), 143.53/143.58 (d = 15), 168.78/169.78 (d = 4, h = 9), 156.00/156.00 (d = 15), 180.73/181.71 (h = 10), 172.63/172.63 (h = 9) |
| 7-path | pi/2, -pi/2, 2pi/3,-2pi/3, 4pi/5, -4pi/5, 9pi/10 | 144.43/146.86 (d = 4), 143.53/143.58 (d = 15), 168.78/169.78 (d = 4, h = 9), 156.00/156.00 (d = 15), 180.73/181.71 (d = 4, h = 10), 172.63/172.63 (h = 9), 191.88/191.88 (h = 10) |
| 8-path | pi/2, -pi/2, 2pi/3,-2pi/3, 4pi/5, -4pi/5, 9pi/10, -9pi/10 | 144.43/146.86 (d = 4), 143.53/143.58 (d = 15), 168.78/169.78 (d = 4, h = 9), 156.00/156.00 (d = 15), 180.73/181.71 (d = 4, h = 10), 172.63/172.63 (d = 15, h = 9), 191.88/191.88 (h = 10), 190.86/190.86 (h = 9) |
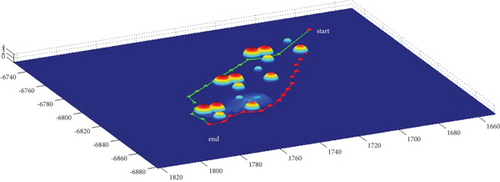
3.2.3. Mode 3
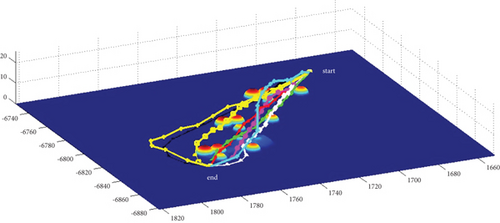
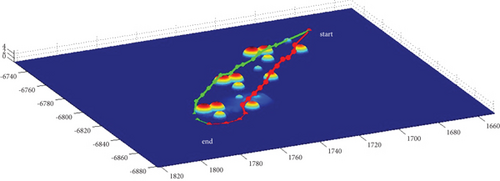
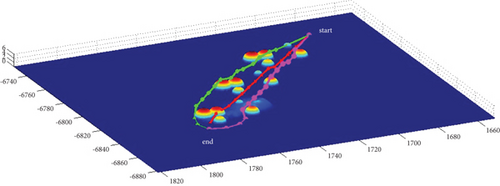
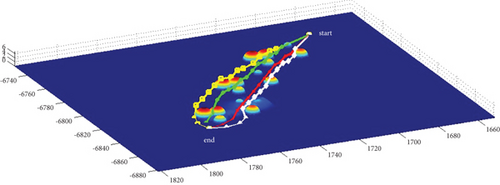
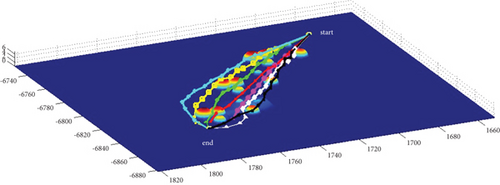
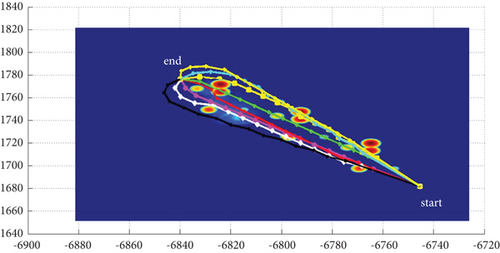
In Scenario 2/10, the azimuth of the reference attacking direction is -pi/4 rad. All the planned paths can effectively avoid the no-fly zone and terrain under various constraints, as shown in Table 8 and Figures 18 and 19, respectively. Although the route in the penetration stage is relatively gentle after crossing the obstacles, that in the launch stage is relatively steep. Therefore, it is suitable for the vertical launch method, and the route during the cruise stage fluctuates significantly.
| Path count | Attack angle (rad) | Path length (step size) (km) |
|---|---|---|
| 2-path | pi/2, -pi/2 | 142.10/142.10, 140.68/141.35 |
| 3-path | 0, pi/2, -pi/2 | 136.73/136.73, 142.10/142.10, 140.68/141.35 |
| 4-path | pi/3, -pi/3, pi/2, -pi/2 | 137.45/137.45, 135.97/135.97, 142.10/142.10, 140.68/141.35 |
| 5-path | 0, pi/3, -pi/3, pi/2, -pi/2 | 136.73/136.73, 137.45/137.45, 135.97/135.97, 142.10/142.10, 140.68/141.35 |
| 6-path | pi/3, -pi/3, pi/2, -pi/2, 2pi/3, -2pi/3 | 137.45/137.45, 135.97/135.97, 142.10/142.10, 140.68/141.35, 149.35/149.35, 149.35/149.35 |
| 7-path | 0, pi/3, -pi/3, pi/2, -pi/2, 2pi/3, -2pi/3 | 136.73/136.73, 137.45/137.45, 135.97/135.97, 142.10/142.10, 140.68/141.35, 149.35/149.35, 149.35/149.35 |
| 8-path | 0, pi/3, -pi/3, pi/2, -pi/2, 2pi/3, -2pi/3, 9pi/10 | 136.73/136.73, 137.45/137.45, 135.97/135.97, 142.10/142.10, 140.68/141.35, 149.35/149.35, 149.35/149.35, 162.19/162.19 |
3.3. Algorithms Comparison
3.3.1. Path Smoothness
3.3.2. Comparison With Different Modes and Situations
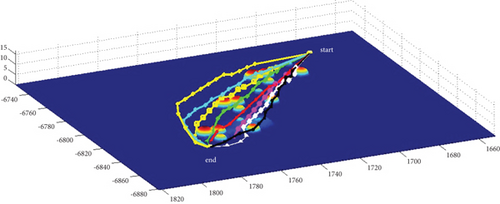
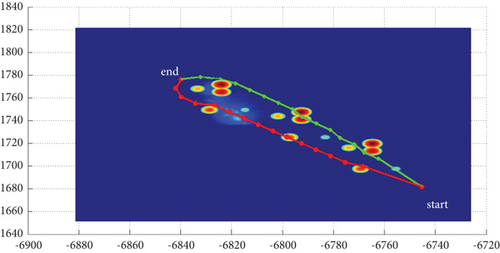
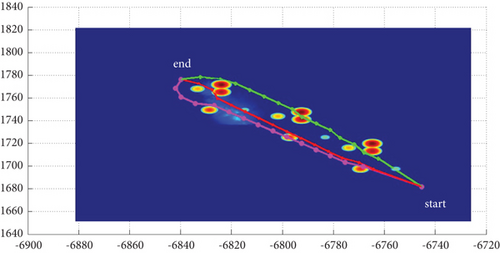
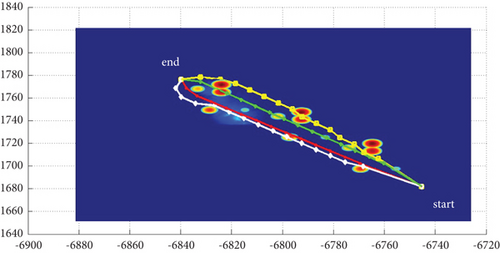
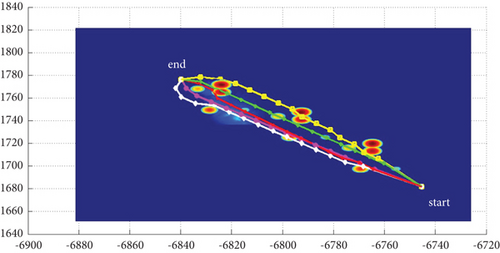
Multipath planning for guided vehicles in different modes and Scenarios 3–7 is simulated and compared, as shown in Figure 20. Mode 1 has strong applicability to both operational situations, with strong horizontal and vertical planning capabilities and a more jumpy course, mainly preventing obstacle penetration. Mode 2 is inclined to plan in the horizontal plane, with less altitude change throughout, a smooth pitch trajectory, and better concealment. However, multipath collision must be avoided, and a larger attack angle is required, which often requires a planning step size larger than the basic step size. This will lead to no convergence if it cannot be satisfied. Mode 3 is more oriented to plan in the vertical plane, with a strong obstacle avoidance capability and route fluctuation degree in the obstacle crossing stage similar to mode 1; however, it requires high maneuverability for the vehicle. Mode 1 and Mode 3 can use a combination of a 0 rad attack angle route with positive and negative attack angle routes when planning odd-numbered routes, whereas Mode 2 generally uses a combination of positive and negative attack angle routes plus the attack angle route with an absolute value greater than pi/2 rad when planning odd-numbered routes.


Multipath planning for guided vehicles is simulated and compared in hidden initial waypoint situations, hidden terminal waypoint situations, and Scenarios 3–7, as shown in Figure 20. For the same mode, the planned path length in Attack Situation 2 is much longer than that in Attack Situation 1. Under Modes 1 and 3, only the route jumps during the obstacle crossing stage in Attack Situation 1. The route during the cruise stage is relatively flat, and the multipath collision in the horizontal plane is not obvious. However, in Attack Situation 2, most of the routes fluctuate; only the small section after obstacle crossing becomes smooth, and multipath collision in the horizontal plane is obvious. In Mode 2, a large heading change occurs during the initial obstacle avoidance phase in Attack Situation 1, and the heading of the main cruise stage is close to the reference attacking direction. However, the heading of the entire route deviates significantly from the reference attacking direction in Attack Situation 2.
A data-driven analysis of the impact of no-fly zones on path planning performance is conducted. The comparative analysis of Scenario 1 (with no-fly zones) and Scenario 3 (without no-fly zones) across three operational modes reveals significant trends in computational efficiency, path optimality, waypoint inflation, fixed step sizes, mode-specific trade-offs, and no-fly zone complexity as shown in Table 9. The runtime difference is minimal (≤ 0.01 s), suggesting that no-fly zones do not significantly increase computational overhead in Modes 1 and 3. A 2.8% runtime reduction in Scenario 3 indicates that no-fly zones impose higher computational demands in Mode 2. No-fly zones force a 12.0% longer path in Scenario 1, highlighting inefficiencies in Mode 2’s obstacle circumvention logic. This suggests that the algorithm prioritizes safety over optimality, generating conservative detours. The minor path length differences (≤ 0.7%) indicate that Modes 1 and 3 exhibit resilience to no-fly zones. Scenario 1 requires 10 waypoints versus nine in Scenario 3, indicating that no-fly zones force additional intermediate nodes to navigate complex geometries and Mode 2’s waypoint inflation. Despite no-fly zones, step sizes remain unchanged, suggesting rigid resolution parameters. Mode 2’s larger step size (12 km) may exacerbate detour lengths when avoiding obstacles. Modes 1 and 3 prioritize path optimality with minimal runtime penalties, and Mode 2 sacrifices path length for robustness, reflecting reactive planning strategies. Increased path length and waypoints correlate with obstacle density and spatial distribution (e.g., Mode 2’s 11.96 km detour implies clustered or large no-fly zones). No-fly zones impose measurable penalties on path planning performance, particularly in Mode 2 prioritizing safety over optimality. Modes 1 and 3 demonstrate resilience through efficient threat handling, suggesting their suitability for environments with static obstacles.
| Mode and scenario | Mode 1 scenario 1 | Mode 1 scenario 3 | Mode 2 scenario 1 | Mode 2 scenario 3 | Mode 3 scenario 1 | Mode 3 scenario 3 |
|---|---|---|---|---|---|---|
| Runtime/s | 2.52 | 2.51 | 2.82 | 2.74 | 2.58 | 2.57 |
| Number of waypoints | 9 | 9 | 10 | 9 | 9 | 9 |
| Path length/km | 83.21 | 82.90 | 111.48 | 99.52 | 82.79 | 82.25 |
| Step size/km | 10 | 10 | 12 | 12 | 10 | 10 |
3.3.3. Comparison With Traditional Algorithms
This study proposes a path planning method with three modes to form and filter a set of subnode vectors.
In Scenario 8, the grid part (460–918, 420–838, 1–16) of the digital map in 4.1 and 4.2 is taken as the island sea zone and translated to (1–459, 1–419, 1–16); the map size is 459 × 419 × 16. The grid position (1, 1, z(1, 1)) is taken as the initial waypoint, the grid position (450, 410, z(450, 410)) is taken as the terminal waypoint, and the no-fly zone is neglected.
Because the planned route is an ideal route or a planned, not the actual flight route, no matter how many experiments are carried out, all performance parameters remain unchanged except runtime and are unique solutions. As shown in Table 10 and Figure 21, the BFS algorithm with cost function f = 0∗g + h, the adding-weight A ∗ algorithm with increased heuristic function weights in the cost function f = g + 2∗h [14], and the A ∗ algorithm optimizing the OPEN table [15] to save only the subsequent nodes of the current expansion node and the three modes in this study, adopting terminal attack angles of 0 rad, -pi/2 rad, and 0 rad, are compared in search time/runtime, path length, and number of search nodes and waypoints, respectively. The method in this study shortens the search time by 91.4%, reduces the number of path nodes by 96.9% to meet the requirements of k ≤ 15, and has better real-time performance. Mode 1 has the fastest search speed; Mode 3 has the shortest and smoothest planned path on the horizontal plane, which is 100% better than the traditional method; Mode 2 has the smoothest path on the vertical plane, which is 99.6% better than the traditional method, although the planned path is slightly longer than the other two modes. The method in this study does not rely on the arc of the curvature circle between the tangent points of the two adjacent path segments [12] or the Bezier curve [15] to improve smoothness, but on limited rotation of the trajectory in multiple degrees of freedom.
| Algorithm type | BFS | f = g + 2∗h | Optimizing OPEN A ∗ | Mode 1 | Mode 2 | Mode 3 |
|---|---|---|---|---|---|---|
| Runtime/s | 28.17 | 46.81 | 5.26 | 3.62 | 4.03 | 3.72 |
| Number of search nodes | 449 | 449 | 449 | 14 | 14 | 14 |
| Number of waypoints | 450 | 450 | 450 | 15 | 15 | 15 |
| Path length (km) | 58.66 | 59.93 | 57.71 | 56.73 | 62.35 | 56.64 |
| Terrain avoidance capability | No | No | No | Yes | Yes | Yes |
| Terminal attack angle is settable or no | No | No | No | Yes | Yes | Yes |
| Direction smoothness (°) | 45 | 45 | 45 | 2.21 | 16.26 | 0.00 |
| Pitch smoothness (°) | 37.29 | 35.26 | 35.26 | 8.85 | 0.13 | 8.33 |


The standard A ∗ algorithm with cost function f = g + h and Dijkstra algorithm [12, 40] with cost function f = g + 0∗h take much longer to search than the data in Table 2. Assuming that the number of search nodes is n, the time complexity [27] or the computational complexity [41–43] of the various algorithms in Table 2 is O (n). Although these algorithms have the same form of computational complexity, algorithms with fewer search nodes have smaller computational complexity and shorter runtime, which also can explain why the traditional methods have significantly longer runtime than the three modes in this study in Table 2. In traditional methods, the optimizing OPEN A ∗ method has the shortest runtime because its OPEN table only contains subsequent nodes of the current extension node, while the BFS algorithm and the A ∗ algorithm with cost function f = g + 2∗h have a longer runtime because their OPEN table contains all subsequent nodes of previous generations of extension nodes and removes the extended nodes. All planning methods were implemented using script and function m file programming in MATLAB 8.3 and executed on a 2.9 GHz Intel Core i5 with 32 GB of RAM.
4. Conclusion
In this work, the proposed 3D multipath planning method using an improved A ∗ algorithm based on multiple avoidance tactics and terminal attack angles successfully solves the multipath planning problems of guided vehicles. This method can overcome the drawbacks of classical A ∗ approaches, such as time consumption, insufficient smoothness, unsettable terminal attack directions, and collisions between multiple paths. All the simulation results demonstrate that the proposed multipath planning method can improve the planning speed, smoothness and coordination of multiple paths.
For two types of typical attack situations, a uniform and symmetrical attack from a single starting point to a unique target and a new practical engineering approach of implicitly extending the parent-child node are established. New tactics for terrain and threat zone avoidance are developed by filtering subnodes below the Earth’s surface, and a detection tactic based on point-in-polygon is used to realize horizontal route avoidance with a better effect. Compared with the traditional A ∗ algorithms, the method in this study shortened the search time by 91.4%, reduced the number of path nodes by 96.9%, improved direction smoothness by 100%, and pitch smoothness by 99.6%.
We presented different real-world scenarios to evaluate the multipath planning method. The results obtained in two typical attack situations with different no-fly zones show that the proposed multipath planning method efficiently solves four major problems: symmetrically distributed terminal attack angles, limited rotation of trajectory in multiple degrees of freedom, terrain avoidance, and collision-free between routes. This makes the proposed multipath planning appropriate to find competitive results for guided vehicles in complex and real scenarios.
Moreover, the 3D multipath planning method using an improved A ∗ algorithm based on multiple avoidance tactics and terminal attack angles could be useful for many mission planning applications, including land-attack vehicles, UAVs, unmanned underwater vehicles, and war game systems.
There are three possible directions to extend this work in the future. Firstly, in the iterative process of multipath planning, the fixed step size needs to be adaptive or variable in numerous complex environments. Secondly, for guided vehicles with coordinated turn, an explicit node extension approach should be developed by adjusting the heading at the parent node for a smooth turn to the child node with a larger radius. Thirdly, considering the current technical limitations of guided vehicles in sensing, memory, and computing power for online path planning, the realization of online planning with the solution of these technical bottlenecks will be a future trend.
Conflicts of Interest
The authors declare no conflicts of interest.
Funding
This research is supported by the National Science Foundation of China (62073334).
Acknowledgments
The authors gratefully acknowledge the contribution of the National Science Foundation of China (62073334).
Open Research
Data Availability Statement
The data used to support the findings of this study are available from the authors upon request.


