Fuel Reactivity Controlled Autoignition and Combustion Characteristics in a Supersonic Combustor With Different Turbulence Models
Abstract
The choice of turbulence model significantly impacts the prediction of the supersonic combustion flow field. In this study, the transient autoignition process and steady supersonic combustion performance of methane fuel with adjustable reactivity in a scramjet combustor were numerically investigated, employing different turbulence models including standard k - ε, renormalization group (RNG) k - ε, and realizable k - ε. Within the flight Mach number range of 3.5–7.0 and activation energy coefficient range of 0.5–1.0, five distinct autoignition modes are observed: misfire, blowoff, diverging section combustion, flashback, and constant-area section combustion. For a given combustor inlet Mach number, equivalence ratio, and fuel temperature, each turbulence model corresponds to a distinct autoignition boundary. This discrepancy reflects the variations in the interaction between supersonic flow and chemical reaction. Moreover, the disparities are also evident in the characteristics of the steady supersonic combustion flow field. Specifically, at a flight Mach number of 7.0 and an activation energy coefficient of 1.0, both the standard k - ε and realizable k - ε models exhibit similar trends in the streamwise distribution of static temperature, as well as static pressure, Mach number, and combustion efficiency. When using the RNG k - ε model, autoignition occurs closer to the fuel injector, thereby attenuating flow disturbance caused by combustion heat. Consequently, mixing between the main flow and fuel is not significantly enhanced, resulting in a lower combustion efficiency at the combustor outlet. With the activation energy coefficient reduced to 0.5, reactions occur more readily under the Ma0 = 7.0 condition. All three k - ε turbulence models predict a constant-area section combustion mode, while they display notable differences in the reacting flow fields. These findings are valuable for analyzing how different turbulence models influence the autoignition process and for performance evaluation in supersonic combustion.
1. Introduction
It is widely acknowledged that the scramjet engine represents the most promising power system for air-breathing hypersonic flight, primarily due to its significant specific impulse [1, 2]. Within a scramjet engine combustor, fuel–air mixing, ignition, and combustion occur within milliseconds, highlighting the critical challenges of achieving reliable ignition and stable combustion. Recently, there has been increasing research focus on scramjet engines operating under low flight Mach number conditions. Because of the relatively low stagnation parameters of the incoming flow, reliable ignition and flame holding pose greater challenges [3, 4]. Despite various proposed high-energy ignition approaches such as spark ignitor, pilot flame, and plasma ignitor, autoignition remains appealing due to lots of benefits [5]. Therefore, it is crucial to determine the autoignition characteristics and combustion performance of a scramjet combustor across a wide range of flight conditions.
The utilization of numerical simulation has been widely adopted in aerospace applications for the purpose of conducting high-speed flow calculations and investigating the reaction and flow properties [6, 7]. Kumaran, Behera, and Babu [8] conducted numerical investigations on the mixing and combustion performance of liquid kerosene in a supersonic combustor using a one-step chemistry model. The dispersion of fuel in nonreacting flows and the heat release pattern in reacting flows were computed. By simulating the ram-to-scram mode transition process in a strut-based dual-mode scramjet combustor, Huang and Yan [9] observed that an increase in the jet-to-crossflow pressure ratio resulted in an expansion of the subsonic flow region, causing the combustor to operate in ramjet mode when the pressure ratio exceeded 10. In a hydrogen-fueled scramjet combustor, Kummitha et al. [10, 11] investigated the impact of the cavity and strut on the combustion flow field. The optimization of the structure was found to enhance pressure, temperature, and combustion efficiency. The findings from 3D (three-dimensional) RANS (Reynolds-averaged Navier–Stokes) simulations conducted by Rasheed and Mishra [12] demonstrated that the flame characteristics of transverse hydrogen injection into a supersonic crossflow were significantly influenced by the inlet turbulent intensity. Both the presence of low-velocity recirculation regions upstream of the injector and the interaction between the reflected shock and boundary layer downstream of the injector contributed to flame stabilization. According to the numerical results from Tian, Yang, and Le [13], it was demonstrated that air throttling facilitated flame stabilization in an ethylene-fueled scramjet combustor, leading to more intense combustion in the cavity and boundary due to improved thermodynamic parameters of the reacting flow. Zhang et al. [14] calculated the combustion flow field in a strut-based scramjet combustor and found that increasing the air intake area and height enhanced mixing and combustion efficiency. An optimized combustor configuration was then preliminarily proposed. Yang, Wu, and Wang [15] employed the RANS method with the shear-stress transport (SST) k - ω turbulence model to numerically examine the impacts of equivalence ratio and fuel distribution on combustion efficiency, total pressure recovery, and drag coefficient in a kerosene-fueled scramjet combustor. It was observed that these factors conflicted with each other, necessitating a tradeoff.
The prediction of fuel–air mixing and supersonic combustion in a scramjet engine is influenced by the choice of turbulence models [16, 17]. The one-equation Spalart–Allmaras model and two-equation turbulence models, including k - ε and k - ω, were extensively employed. Menter [18] developed two two-equation turbulence models based on the k - ω equation. By utilizing the baseline (BSL) k - ω model, it was possible to eliminate free-stream dependency while maintaining results that closely resembled those obtained with the original k - ω model. The SST k - ω model exhibited a remarkable enhancement for flows featuring adverse pressure gradients. Kummitha [19] compared the performance of the standard k - ε model, SST k - ω model, and large eddy simulation method in evaluating the static pressure distribution and velocity profiles within a scramjet combustor. Their findings revealed that the results obtained from the SST k - ω model exhibited superior qualitative and quantitative agreement with experimental data. Kumaran and Babu [20] utilized the Spalart–Allmaras one-equation turbulence model and the SST k - ω model to numerically simulate 3D compressible reacting flows. The findings indicated that the Spalart–Allmaras model exhibited an overestimation of mixing and heat release, while the SST k - ω model demonstrated superior performance in accurately predicting peak values of temperature and pressure. When simulating the flow field in a scramjet combustor under low Mach number flight conditions, Nishiguchi, Kodera, and Tomioka [21] observed that the renormalization group (RNG) k - ε model combined with the explicit algebraic stress model (EASM) demonstrated enhanced effectiveness in the ramjet-mode analysis, while without EASM, it proved suitable for scramjet-mode analysis. The combustion flow field in a scramjet combustor calculated by four turbulence models was compared by Sun et al. [22]. The results demonstrated that the detached eddy simulation method yielded a more precise temperature distribution when compared to the k - ε, k - ω, and realizable k - ε models. Rasheed and Mishra [12] also demonstrated the accurate prediction of flame structures away from the combustor wall and the flame penetration height by employing the SST k - ω turbulence model. However, in terms of calculating laminar to turbulent transition onset, the Langtry–Menter SST k - ω model exhibited superior performance. Recently, Li et al. [23] employed the SST k - ω turbulence model to compute the autoignition boundary and combustion flow field of a scramjet combustor without a flame holder. By manipulating fuel reactivity, three distinct autoignition modes were identified, accompanied by diverse characteristics of reacting flows.
To achieve autoignition and improve combustion performance in a scramjet engine combustor operating at low flight Mach numbers, modifying fuel reactivity is essential [23, 24]. Based on the aforementioned description, it is evident that the turbulence model plays a pivotal role in predicting compressible reacting flows. However, existing literatures lack a detailed discussion on how turbulence models influence autoignition modes and combustion characteristics across a wide range of flight conditions and fuel reactivities. Therefore, this study is aimed at addressing this research gap by (i) identifying specific autoignition modes and boundaries under various flight Mach number conditions in a scramjet combustor and (ii) investigating the characteristic features of compressible reacting flow with various turbulence models and fuel reactivities. To achieve these objectives, the structure of the present paper is as follows. The geometry of the two-dimensional supersonic combustor and the computational procedures employed in this study are presented in Section 2, along with the methodologies for handling incoming flow conditions and chemical reactions. This section also provides an overview of the governing equations of the three turbulence models. Section 3 then addresses the grid scale and validates the computational results against experimental data. In Section 4, a detailed comparison is conducted on the autoignition characteristics and combustion flow field features under different turbulence models and fuel reactivity conditions. Finally, the key findings of this work are summarized.
2. Scramjet Combustor Model and Numerical Methods
2.1. Geometry of the Scramjet Combustor
In this study, a two-dimensional scramjet combustor was utilized based on our previous work [23]. To specifically investigate the impact of the turbulence model and fuel reactivity on the properties of autoignition and supersonic combustion, physical flame-holders were excluded. The scramjet combustor model, as depicted in Figure 1, comprises a constant-area section and a diverging section, both measuring 38.1 mm in width. The constant-area section features an entrance height of 25.4 mm and spans a length of 453.3 mm, while the diverging section extends for 349 mm with a lower wall divergence angle of 4.0°. A transverse fuel injection strategy is employed. The gaseous fuel is injected into the constant-area section through a narrow slot with a width of 0.1278 mm, situated 358 mm downstream from the combustor inlet.

2.2. Numerical Methods
The detailed information can be accessed in Ref. [25]. A numerical approach utilizing an implicit second-order upwind solution, coupled with the advection upstream splitting method (AUSM) algorithm, is implemented. The air and the combustible mixture are considered thermally and calorically perfect gases, with their viscosity and specific heat simulated by the mass-weighted mixing law. Adiabatic and nonslip wall conditions are assumed. Additionally, standard wall condition is utilized to compute the flow parameters in close proximity to the wall. A pressure inlet boundary condition is specified for the combustor entrance, while a mass flow rate inlet with sonic speed is utilized for fuel injection. The dynamic pressure q () is defined as a constant value of 50 kPa, along with a consistent Mach number of 2.2 at the combustor entrance under all flight conditions. Assuming an isentropic compression of the incoming airflow at the inlet, flow properties at the entrance of the combustor can be calculated using a specific Ma0 and the standard atmosphere model. The demonstrations have revealed that the mechanism of fuel reaction has minimal impact on the assessment of features in a supersonic combustion flow field, thus allowing for a significant reduction in computational cost through the utilization of a simplified chemical mechanism [11, 26]. Consequently, to simulate the reactions within the combustor, a finite-rate/eddy-dissipation kinetics solver is employed in conjunction with a one-step CH4-O2 reaction mechanism, as shown in detail in Table 1. The reactivity of methane can be modified through a simplified approach employed in this study, wherein Ea = Ea0 × KEa (KEa > 0) [23]. In the transient calculations conducted to examine the dynamic autoignition process in Section 4.1, a time step size of 10−3 ms is established, and a maximum of 20 iterations are conducted per time step. For investigating the features of high-speed reaction flows in Section 4.2, steady calculations are employed. The convergence criteria for these computations necessitate a reduction in residuals by more than three orders of magnitude while ensuring that the difference in mass flow rate between the inlets and outlet remains below 1 g/s.
| Reaction | A0 (m, s, kmol) | Ea0 (J/kmol) | nCH4 | nO2 |
|---|---|---|---|---|
| CH4+2O2→CO2+2H2O | 2.119 × 10¹¹ | 2.027 × 10⁸ | 0.2 | 1.3 |
2.3. Governing Equations of Different Turbulence Models
To facilitate solving the coupled conservation equation more efficiently, it is common practice to utilize a turbulence model for simplifying the treatment of the Reynolds stress term in the Navier–Stokes equation. The FLUENT software incorporates multiple turbulence models, including the Spalart–Allmaras model, the k - ε model, and the k - ω model. The two-equation turbulence models are commonly used in the performance evaluation of a scramjet engine combustor. In our previous work [23], the SST k - ω model has been discussed. Therefore, this study examines the influence of three k - ε turbulence models (standard k - ε, RNG k - ε, and realizable k - ε) on both the autoignition process and supersonic combustion characteristics. The governing equations for these three turbulence models are described below [27].
2.3.1. Standard k-ε
2.3.2. RNG k-ε
2.3.3. Realizable k-ε
Undoubtedly, each of the three turbulence models possesses distinctive characteristics. Based on their respective governing equations, they offer advantages in simulating diverse turbulence features. However, accurately predicting the performance of supersonic combustion directly through the governing equations of a turbulence model becomes challenging in complex scenarios involving shock wave and boundary layer interaction as well as turbulence–combustion interaction within a supersonic combustor. Therefore, it is crucial to investigate the influence of different turbulence models on the autoignition process and characteristics of supersonic reaction flow while considering a wide range of flight Mach number and fuel reactivity.
3. Grids and Validation
The suitability of a structured and multiblocked grid with dimensions of 730 × 64 has been demonstrated in the previous work for this two-dimensional model combustor [23]. The grids were strategically clustered in close proximity to the wall and at the junction between neighboring blocks. In order to maintain an appropriate y+ value, a uniform initial cell layer was established at a distance of 10−2 mm away from the inner wall for all cases.
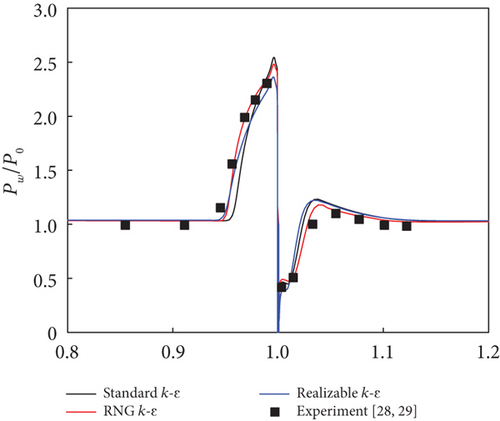
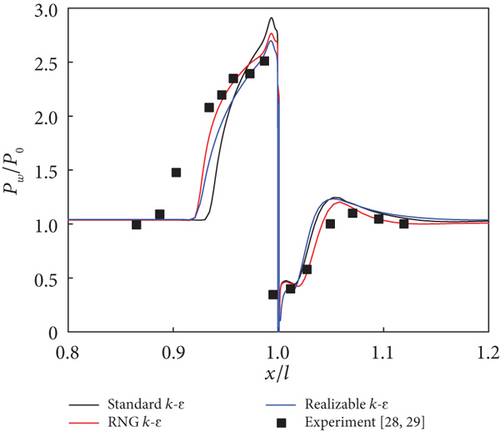
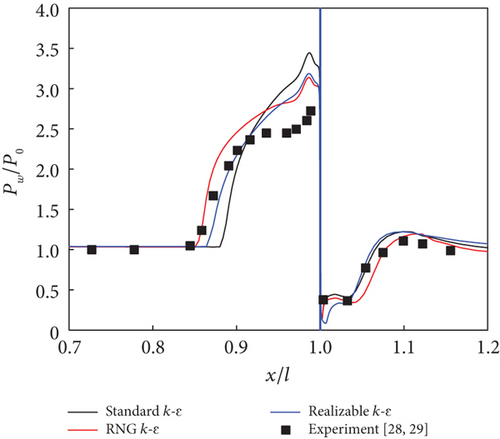
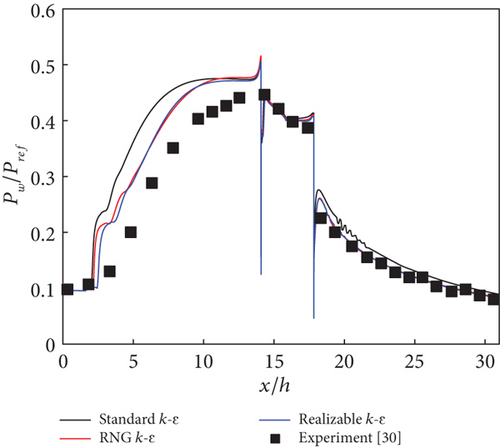
The accuracy of the numerical calculations was validated against experimental results involving a transverse slot injection scheme and supersonic combustion in a scramjet combustor. For the transverse slot injection scheme [28], detailed computational domains of the supersonic flow field are provided in Ref. [29]. Based on the grid independence analysis from that study, a grid scale of 410 × 280 was used in the present calculations, comparable to the grid density near the fuel injector shown in Figure 1. The Mach number, static pressure, and static temperature of the main airflow were 3.5, 3145 Pa, and 86.5 K, respectively. For the nitrogen jet, at a jet-to-crossflow pressure ratio of 8.74, these values were set to 1.0, 27487.3 Pa, and 248.3 K, respectively. As shown in Figure 2(a), the three k - ε turbulence models agree well with the experimental data. The size of the separation region upstream of the injector is better simulated by the RNG k - ε and realizable k - ε models. At a jet-to-crossflow pressure ratio of 17.12 in Figure 2(b), the three k - ε turbulence models provide more accurate predictions for the peak pressure upstream of the injector than for the size of the separation region. In contrast, when the jet-to-crossflow pressure ratio increases to 42.79 in Figure 2(c), the peak pressure is overpredicted. It is observed that all turbulence models predict the wall pressure downstream of the injector satisfactorily. For the supersonic combustion, a two-dimensional supersonic model combustor, identical to the configuration proposed by Micka, Torrez, and Driscoll [30], was used. The boundary conditions are taken from case 2H in Ref. [30], where the inflow Mach number, total temperature, and total pressure are 2.2, 1370 K, and 590 kPa, respectively, with hydrogen as the fuel and an equivalence ratio of 0.27. The pressure distribution along the lower wall, normalized by the inflow total pressure, is shown in Figure 3. The results of the RNG k - ε and realizable k - ε models nearly coincide with each other. The three k - ε turbulence models predict the wall pressure downstream of the fuel injector satisfactorily but overpredict the intensity of the pseudoshock wave system upstream of the injector. In general, the three turbulence models are capable of simulating the flow properties under different conditions, particularly downstream of the injector.
4. Result and Discussion
To determine the autoignition and supersonic combustion characteristics of methane under varying activation energies, it becomes imperative to define the boundary conditions corresponding to different flight Mach numbers. It is possible to establish flight parameters by setting q = 50 kPa. Typical boundary conditions, ranging from Ma0 = 5.0 to 7.0, are presented in Table 2, considering a specific heat ratio of 1.394 as an assumption.
| Ma0 | H (km) | Pt0 (kPa) | Tt0 (K) | Mac | Maf | Ttf (K) | Ф |
|---|---|---|---|---|---|---|---|
| 5.0 | 24.2 | 1554.6 | 1308.2 | 2.2 | 1.0 | 300.0 | 0.5 |
| 5.5 | 25.5 | 2270.2 | 1545.1 | 2.2 | 1.0 | 300.0 | 0.5 |
| 6.0 | 26.6 | 3252.4 | 1805.8 | 2.2 | 1.0 | 300.0 | 0.5 |
| 6.5 | 27.7 | 4574.1 | 2090.3 | 2.2 | 1.0 | 300.0 | 0.5 |
| 7.0 | 28.7 | 6321.4 | 2398.9 | 2.2 | 1.0 | 300.0 | 0.5 |
4.1. Autoignition Characteristics With Different Turbulence Models
4.1.1. Autoignition Modes
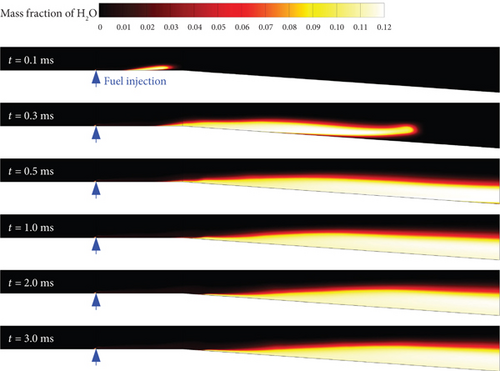
Based on the aforementioned grid morphology and boundary conditions, flame development patterns corresponding to different turbulence models and activation energy coefficients can be computed. In this study, the contour of the water mass fraction is employed to characterize the reaction region and flame structure. The results of representative autoignition models are presented in Figures 4, 5, and 6. For a flight Mach number of 5.5 and an activation energy coefficient of 0.7 (Figure 4) using the realizable k - ε turbulence model, at t = 0.1 ms, H2O emerges in the constant-area section downstream of the fuel injector, indicating the immediate occurrence of a reaction upon fuel injection into the combustor. At t = 0.3 ms, there is downstream movement observed in the position where water appears along with an expansion in its distribution area. After a duration of 0.2 ms (at t = 0.5 ms), H2O is distributed throughout both the diverging section and the constant-area section, although in small quantities for the latter. During the t = 0.5–3 ms period, slight downstream displacement occurs for the reaction region until it stabilizes within the diverging section after approximately 1 ms, without significant shape alteration. This mode is referred to as diverging section combustion (DSC).
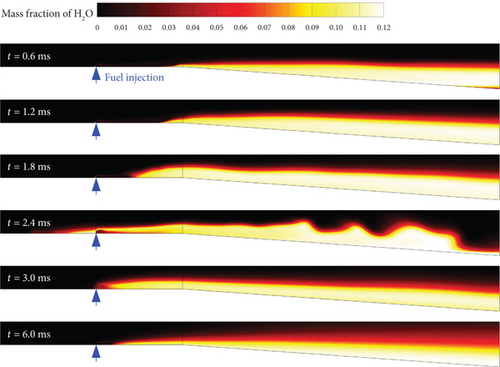
When employing the standard k - ε turbulence model, with a flight Mach number of 4.0 and an activation energy coefficient of 0.5 (as illustrated in Figure 5), before 0.6 ms, the flame morphology exhibits a similar evolution pattern to that depicted in Figure 4 from t = 0.1 to 0.5 ms. From t = 0.6 to 1.2 ms, there is an augmentation in reaction intensity, accompanied by an expansion in the distribution area of the reaction zone as it progresses upstream. At t = 2.4 ms, H2O emerges upstream of the fuel injector while noticeable fluctuations occur on the flame surface within the diverging section. Subsequently (t > 3.0 ms), the reaction zone retracts back downstream from the fuel injector, characterizing this phenomenon as flashback combustion (FBC). Owing to its heightened reactivity, H2O manifests itself near the fuel injector within the constant-area section. Meanwhile, due to a lower flight Mach number, water distribution becomes more dispersed within the diverging section, resulting in increased flame penetration depth.
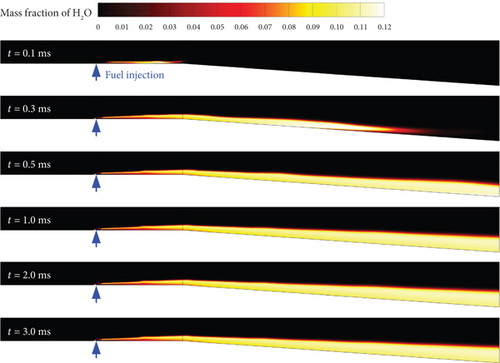
In the case of the RNG k - ε turbulence model, characterized by a flight Mach number of 7.0 and an activation energy coefficient of 0.6 (as depicted in Figure 6), the reactions under this condition are more facile due to the higher flight Mach number and smaller activation energy. At t = 0.1 ms, the flame front is observed to be closer to the fuel injector compared to Figure 4, with the flame being in proximity to the lower wall of the combustor. Subsequently, at t = 0.3 ms, there is a rapid downstream expansion of the reaction zone along with an upstream movement of the flame front that nearly reaches contact with the fuel injector. Beyond t = 0.5 ms, it can be noted that there is minimal change in shape within the reaction zone while exhibiting a smooth appearance on its flame surface—this phenomenon is referred to as constant-area section combustion (CSC).
To enhance the discernment of activation energy and turbulence model on stable combustion mode, the previously identified stable combustion mode [23] is subdivided into two categories: CSC and DSC. Furthermore, a new mode called FBC has been introduced here. In addition to these three combustion modes, our previous work has defined the misfire and blowoff combustion modes [23], which will not be further discussed here. Notably, all three turbulence models exhibit the DSC, FBC, and CSC autoignition modes. To illustrate typical flame evolution processes, different flight Mach numbers and fuel reactivities are used in Figures 4, 5, and 6.
4.1.2. Autoignition Boundary With Different Turbulence Models
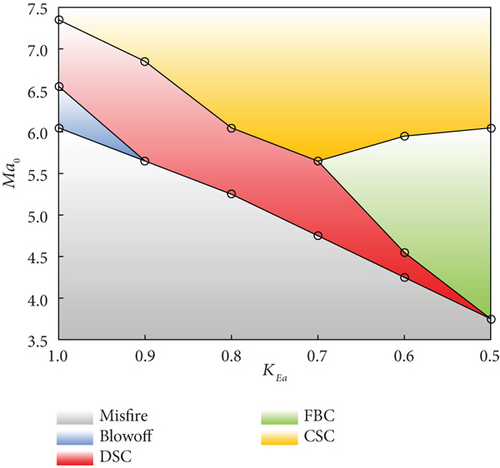
Different autoignition modes can be determined using the aforementioned approach, considering various flight Mach numbers, activation energies, and turbulence models. The flight Mach number ranges from 3.5 to 7.5 with increments of 0.1, while the activation energy coefficient varies between 0.5 and 1.0, with an interval of 0.1 as well. Figure 7 illustrates the distribution of five distinct autoignition modes: misfire, blowoff, DSC, FBC, and CSC.
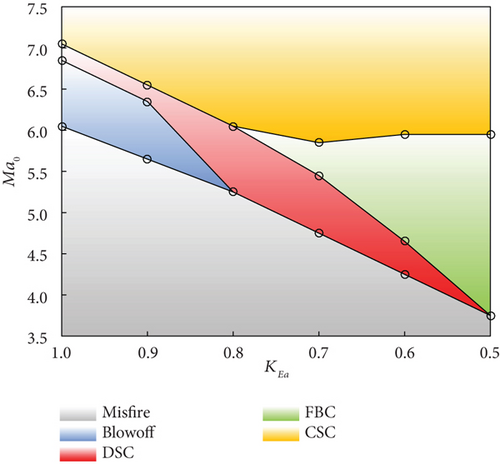
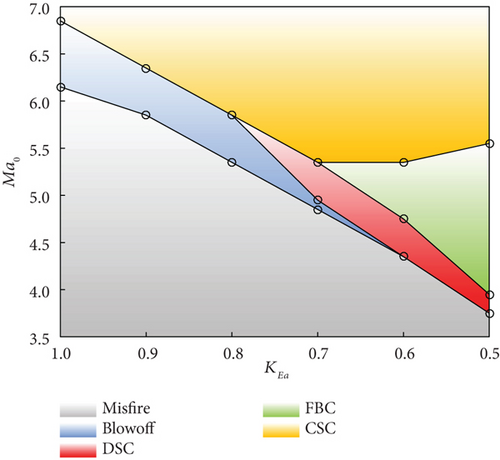
When utilizing the standard k - ε turbulence model (Figure 7(a)), methane combustion is not feasible at flight Mach numbers below 6.0. Within the range of flight Mach numbers from 6.1 to 6.8, blowoff mode occurs, while DSC manifests when the Ma0 ranges between 6.9 and 7.0. Further elevation of the flight Mach number leads to CSC. Decreasing the KEa from 1.0 to 0.8 leads to a reduction in the corresponding flight Mach numbers for these three combustion modes mentioned above. When the activation energy coefficient is set at 0.8, FBC emerges at a flight Mach number of 6.1, causing blowoff mode to vanish. Continuously diminishing the activation energy coefficient linearly decreases the boundary between misfire and DSC. The rate of descent for the boundary between DSC and FBC intensifies, whereas nonmonotonic patterns are observed for the boundary between FBC and CSC.
When employing the RNG k - ε model (Figure 7(b)), the lowest Ma0 required for methane autoignition experiences a slight increase to 6.1. The transition Mach number from blowoff mode to CSC is observed at 6.8. With this turbulence model, methane does not exhibit DSC as the Ma0 increases. However, when the activation energy coefficient decreases to 0.8, DSC occurs. FBC is triggered at KEa = 0.7, while blowoff mode ceases at KEa = 0.6. With the exception of the boundary between FBC and CSC, all other boundary lines decrease with decreasing activation energy.
When utilizing the realizable k - ε turbulence model (Figure 7(c)), similar to the standard k - ε model, a minimum flight Mach number of 6.0 is required for methane autoignition. As the Ma0 surpasses 6.5, methane transitions into blowoff mode, and the range of DSC expands from 6.6 to 7.3. Blowoff mode ceases earlier at KEa = 0.9 with a corresponding Ma0 of 5.6. FBC occurs when KEa = 0.7 and the flight Mach number is 5.6.
By analyzing the results presented in Figure 7, it becomes apparent that significant disparities exist in the regions where different autoignition modes occur under various turbulence models. Taking blowoff mode as an example, the realizable k - ε model exhibits a relatively limited area, whereas the RNG k - ε model demonstrates the most extensive coverage. Conversely, DSC displays a wide distribution within the realizable k - ε model, while its corresponding region is the smallest in the RNG k - ε. Nevertheless, there are resemblances among different turbulence models concerning the maximum flight Mach number associated with misfire mode. Additionally, when the activation energy coefficient decreases below 0.8, FBC may transpire. The boundaries of the FBC mode diverge as the activation energy coefficient decreases.
4.2. Combustion Characteristics With Different Turbulence Models
The structure of the supersonic combustor employed in this study is relatively simple. However, due to the influence of transverse fuel injection, bow shocks generated undergo multiple reflections within the duct and interact with the boundary layer at the wall. Consequently, under varying inflow conditions, supersonic reacting flows described using different turbulence models will exhibit varying degrees of disparity. In this section, taking a flight Mach number of 7.0 as an example, the compressible combustion flow characteristics corresponding to different turbulence models are discussed for activation energy coefficients of 1.0 and 0.5, respectively.
4.2.1. Ma0 = 7.0 and KEa = 1.0
The Mach number contours corresponding to different turbulence models are depicted in Figure 8. Notably, within the constant-area section downstream of the fuel injector, distinct bow shocks generated by transverse injection and reflected shock waves are observed. In the diverging section, there is an acceleration of the reacting flow, resulting in extensive regions with high Mach numbers. However, due to the relatively high flight Mach number, the momentum of incoming airflow into the combustor surpasses that of transverse fuel injection significantly. Consequently, bow shocks (generated by the transverse injection) and pressure increases (caused by combustion) have a negligible impact on the main flow upstream of the fuel injector.

Diverse descriptions of turbulence–combustion interactions among different turbulence models result in significant disparities in the characteristics of supersonic reacting flows. As shown in Figure 8, within the constant-area section downstream of the fuel injector, both the standard k - ε and realizable k - ε models exhibit similar Mach number contours with subtle differences observed in shock waves, expansion waves, and reflected wave systems. In contrast, the RNG k - ε model reveals a subsonic region near the lower wall boundary layer on a smaller scale. Within the diverging section, compared to the other two turbulence models, the RNG k - ε model demonstrates an earlier occurrence of subsonic regions. Furthermore, Mach number contours for both standard k - ε and realizable k - ε models illustrate extensive low Mach number regions appearing in the latter half of the diverging section.
These findings are supported by the one-dimensional streamwise Mach number curves depicted in Figure 9. Prior to the fuel injection point, the three curves closely coincide. Upon fuel injection (x > 358 mm), there is a rapid decrease in Ma along the streamwise direction. Notably, at approximately x = 400 mm, the curve of the RNG k - ε model exhibits a swift descent below Ma = 1.8. As the flow enters the diverging section (x = 453.3 mm), mainstream velocity steadily increases and reaches approximately Ma = 2.25 at the combustor exit, surpassing that of inlet conditions. In contrast to this behavior, within the region of 400 mm < x < 453.3 mm for both the standard k - ε and realizable k - ε models, there is a less pronounced rate of Mach number descent compared to that observed with the RNG k - ε model. Within the diverging section, Mach numbers for these two turbulence models exhibit nonmonotonic variations: the standard k - ε model shows the maximum and minimum values located around x = 547 mm and x = 700 mm, respectively. An inflection point appears at x = 625 mm for the realizable k - ε model. In most regions examined here, Ma of the standard k - ε model is lower than that obtained using the realizable k - ε model, with their intersection occurring at x = 749 mm. At the combustor exit plane, Mach numbers predicted by these two turbulence models are approximately equal to 2.07 and 2.00, respectively.
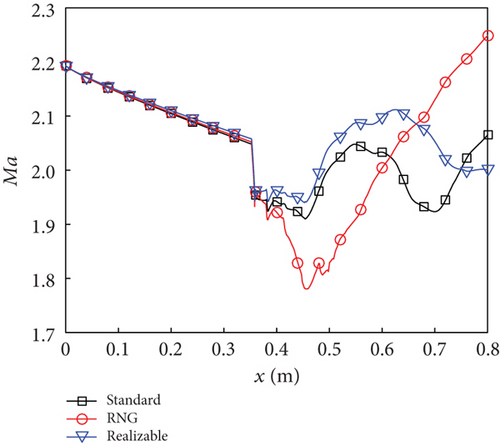
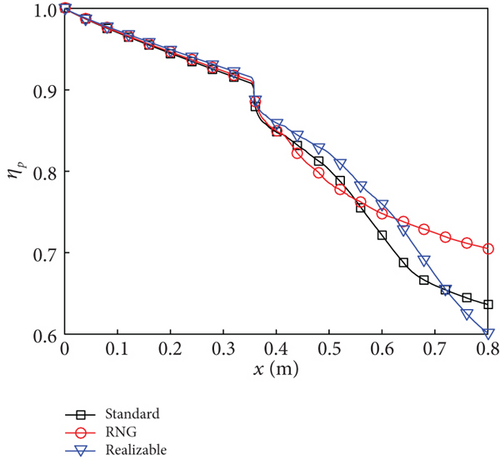
The distribution of the Mach number is influenced by both the geometric structure of the combustor and the heat release during combustion. When maintaining a consistent geometric structure of the combustor, variations in Ma can primarily be attributed to the differences in flow–combustion interactions simulated by various turbulence models. By examining the streamwise variations of multiple parameters, as depicted in Figure 10, a clearer elucidation of the characteristics of the combustion flow field calculated by the three turbulence models can be achieved.
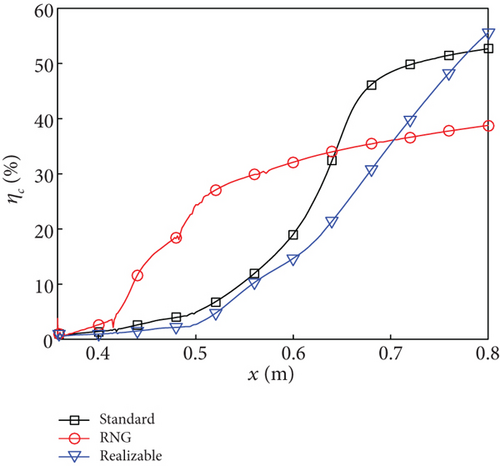
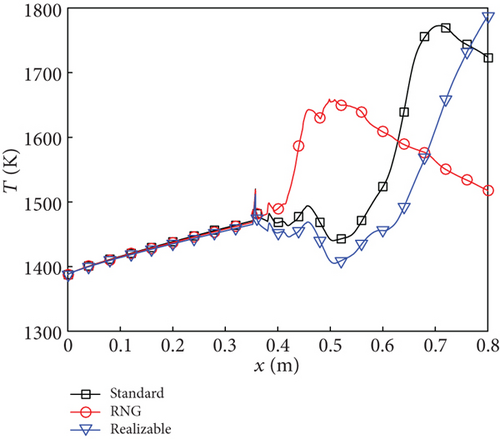
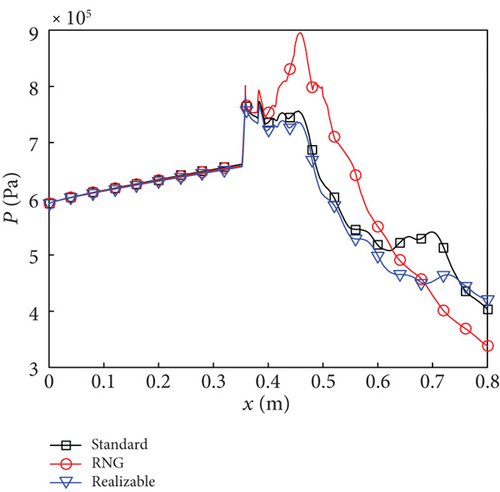
Based on the combustion efficiency curve shown in Figure 10(a), it can be inferred that the RNG k - ε model simulates autoignition occurring shortly downstream of the fuel injector, resulting in considerable fuel consumption within the constant-area section (combustion efficiency of 14.8% at x = 453.3). This corresponds to the CSC mode depicted in Figure 7(b). Consequently, Figures 10(b) and 10(c) demonstrate a rapid increase in temperature and pressure within the constant-area section when using the RNG k - ε model. In the diverging section, there is a steady increase in combustion efficiency, reaching 38.8% at the combustor exit, while temperature and pressure decrease due to the main flow acceleration.
For the standard k - ε and realizable k - ε models, at the interface between the constant-area section and the diverging section, combustion efficiencies of 3.2% and 1.8% are observed, respectively, indicating negligible reaction, in accordance with the DSC modes depicted in Figures 7(a) and 7(c). Within the constant-area section (358 mm < x < 453.3 mm), static temperature and pressure exhibit fluctuations for both turbulence models. The intense combustion simulated by these two turbulence models occurs within the diverging section. In the case of the standard k - ε model, a rapid increase in combustion efficiency is observed within the range of 500 mm < x < 675 mm, followed by a slower rate of increase, reaching a maximum value of 52.7% at the combustor exit. Meanwhile, for the realizable k - ε model, there is an almost linear increase in combustion efficiency beyond x = 500 mm, which surpasses that of the standard k - ε model at x = 780 mm, with the highest value of 55.6% achieved at combustor exit. Due to the rapid release of heat, although the main flow within the diverging section undergoes acceleration, the static temperature and pressure for these two turbulence models still increase in certain intervals. Particularly, there is a significant increase in static temperature (as observed in the black and blue curves in Figure 10(b)). The variation pattern of the total pressure recovery shown in Figure 10(d) opposes that of combustion efficiency. Specifically, a higher combustion efficiency corresponds to a smaller total pressure recovery. At the exit of the combustor, the total pressure recovery decreases from 0.71 to 0.64 and then to 0.60.
4.2.2. Ma0 = 7.0 and KEa = 0.5
The reactivity of the fuel is enhanced by reducing the activation energy to half of its initial value, thereby facilitating combustion. Under high flight Mach number conditions (Ma0 = 7.0), as depicted in Figure 7, all three turbulence models exhibit the CSC mode. In Figure 11, a subsonic region in green emerges near the lower wall of the constant-area section for each turbulence model. The influence of incident shock waves has dual effects: firstly, it reduces fluid velocity near the boundary layer, leading to an increase in static temperature and pressure [33]; secondly, shock waves promote fuel–air mixing and enhance combustion. Consequently, there is a significant expansion in the area of the low Mach number region (as indicated by the dashed line). Among these turbulence models, the RNG k - ε model demonstrates clarity in shock wave systems with minimal a subsonic region.

The streamwise Mach number distributions exhibit similar patterns for all three turbulence models, as observed from the one-dimensional curves in Figure 12. Within the constant-area section downstream of the fuel injector, fluctuations are evident during the descent of the curves due to the presence of oblique shock waves, with the realizable k - ε model reaching its lowest point at 1.65. In contrast, within the diverging section, all three curves monotonically increase and demonstrate relatively smooth behavior, resulting in Mach numbers ranging from 2.1 to 2.3 at the exit of the combustor. Notably, among these models, it is observed that the RNG k - ε model exhibits the maximum Ma while the realizable k - ε shows the minimum value.
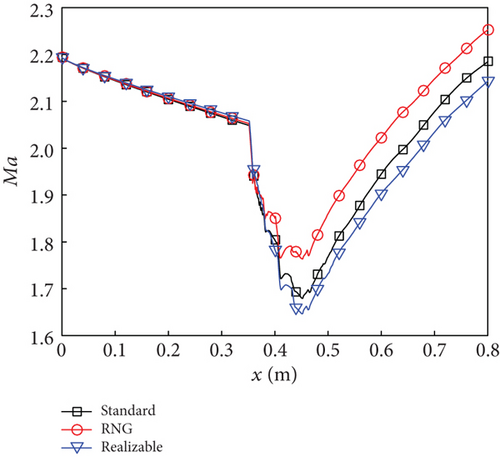
Under the condition of Ma0 = 7.0 and KEa = 0.5, despite all three turbulence models indicating a CSC mode, there exist disparities in combustion efficiency. As depicted in Figure 13(a), the realizable k - ε model exhibits the highest efficiency at the combustor exit, reaching 53.7%, while the RNG k - ε model demonstrates the lowest efficiency at only 38.2%. This finding explains the distribution patterns of other parameters shown in Figure 13. Specifically, higher combustion efficiency corresponds to elevated static temperature and pressure but reduced total pressure recovery.
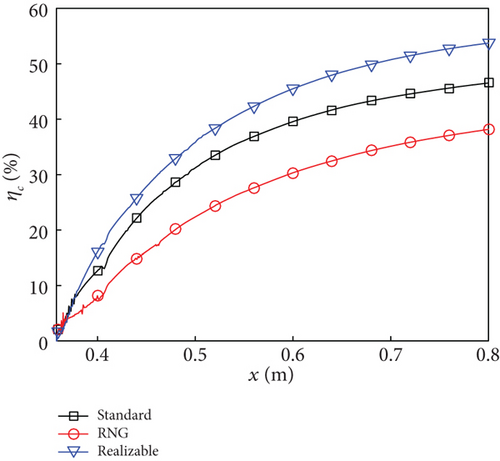
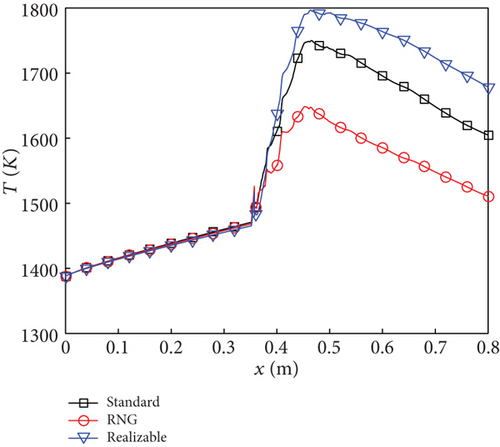
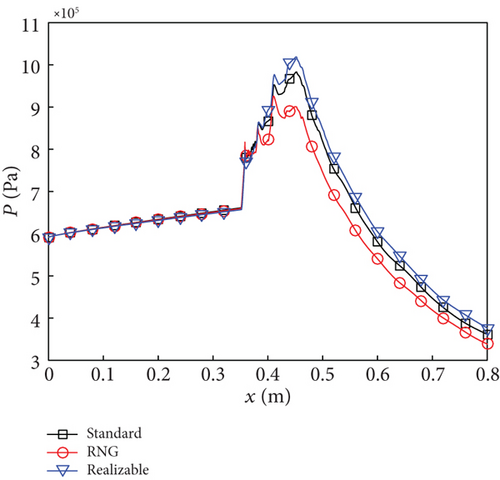
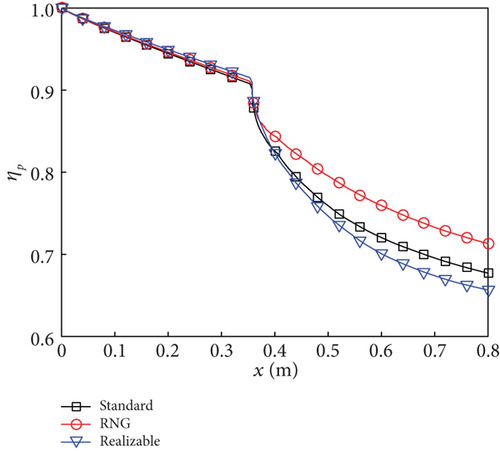
It is noteworthy that, in comparison to KEa = 1.0 in Figure 10(a), the combustion efficiencies of the three turbulence models decrease by 6.2% (standard k - ε model), 0.6% (RNG k - ε model), and 1.9% (realizable k - ε model) at the exit of the combustor when KEa is reduced to 0.5. This observation suggests that under high flight Mach number conditions, the momentum of the mainstream significantly surpasses that of the transverse jet, leading to suppression in fuel–air mixing. Merely increasing fuel reactivity does not effectively enhance combustion efficiency. Instead, an optimization design considering combustion–flow interaction becomes imperative for achieving desired engine propulsion performance. This conclusion aligns with our previous research findings [23].
5. Conclusions
The autoignition characteristics and supersonic combustion performance of methane fuel under different fuel reactivities and flight Mach numbers were calculated by the RANS method considering different turbulence models in a scramjet combustor. The boundaries of the respective ignition modes were determined. The streamwise distribution of typical performance parameters of the reaction flow field was analyzed. The following is a summary of the key findings.
Based on the transient calculation results, five autoignition modes are identified with variations in flight Mach number and fuel reactivity, including misfire, blowoff, DSC, flashback, and CSC. The boundaries for these autoignition modes exhibit discrepancies among the three turbulence models. According to the partitioning of combustion modes based on different boundaries, the RNG k - ε model exhibits the broadest blowoff mode distribution, whereas the realizable k - ε model displays the narrowest distribution area. However, a contrasting trend is observed for the DSC mode. With the reduction of the activation energy coefficient, the maximum flight Mach number corresponding to the misfire mode is similar across different turbulence models. However, there are disparities in the minimum flight Mach number required for the CSC mode.
The steady-state results of the combustion flow field indicate that at a flight Mach number of 7.0 and an activation energy coefficient of 1.0, the RNG k - ε model predicts an autoignition mode of CSC, while both the standard k - ε and realizable k - ε models predict DSC modes. The location where autoignition occurs determines the position of flow disturbance resulting from intense heat release. This disturbance promotes fuel–air mixing and enhances combustion. When the activation energy coefficient is reduced to 0.5 (with the same flight Mach number of 7.0), all three turbulence models exhibit a CSC mode. The variation trends of typical flow field parameters corresponding to these three turbulence models are similar. At the exit of the combustor, the realizable k - ε model achieves the highest combustion efficiency (53.7%), while the RNG k - ε model attains the lowest combustion efficiency (38.2%). The static temperature and static pressure increase with increasing combustion efficiency. However, there exists an inverse relationship with respect to the total pressure recovery.
This study demonstrates the disparities among the three k - ε turbulence models in simulating the autoignition process and combustion performance in a supersonic combustor, which arise not only from their governing equations but also from interactions involving flow dynamics, fuel–air mixing, and reaction. To achieve satisfactory engine propulsion performance across various flight Mach numbers, it becomes imperative to consider the synergistic effects of flow conditions, fuel reactivity, and combustor structure. The findings presented in this paper provide preliminary insights into the effects of turbulence models on numerical simulations of scramjet combustor performance across a broad range of flight Mach numbers and fuel reactivities. Further research in two areas is suggested to refine the numerical investigations. One is a comprehensive study of the applicability of different turbulence models and reaction mechanisms. The other is to explain the discrepancies in predictions from the governing equations of different turbulence models and to investigate the interaction mechanisms between turbulence and reaction.
Nomenclature
-
- A
-
- area
-
- A0
-
- pre-exponential factor of methane
-
- C1ε
-
- constant
-
- C2
-
- constant
-
- C2ε
-
- constant
-
- C3ε
-
- constant
-
- et
-
- total energy per unit volume
-
- Ea
-
- activation energy of reactivity modified fuel
-
- Ea0
-
- activation energy of methane
-
- Gb
-
- generation of turbulence kinetic energy due to buoyancy
-
- Gk
-
- generation of turbulence kinetic energy due to the mean velocity gradients
-
- H
-
- altitude
-
- h
-
- height of combustor entrance
-
- ht
-
- total enthalpy per unit volume
-
- k
-
- turbulence kinetic energy
-
- KEa
-
- activation energy coefficient
-
- Ma
-
- Mach number
-
- Ma0
-
- flight Mach number
-
- Mac
-
- Mach number at combustor entrance
-
- Maf
-
- Mach number of fuel
-
- nCH4
-
- rate exponent of methane
-
- nO2
-
- rate exponent of oxygen
-
- P
-
- static pressure
-
- P0
-
- static pressure of free-stream
-
- Pref
-
- reference pressure
-
- Pt
-
- total pressure
-
- Pt0
-
- total pressure of free-stream
-
- Pw
-
- wall pressure
-
- q
-
- dynamic pressure
-
- qi
-
- heat flux vector
-
- Sε
-
- user-defined source term
-
- Sk
-
- user-defined source term
-
- t
-
- time
-
- T
-
- static temperature
-
- Tt0
-
- total temperature of free-stream
-
- Ttf
-
- total temperature of fuel
-
- u
-
- streamwise velocity
-
- ui
-
- velocity component
-
- uj
-
- velocity component
-
- V0
-
- velocity of free-stream
-
- x
-
- x coordinate
-
- y
-
- y coordinate
-
- Yf
-
- mass fraction of fuel
-
- YM
-
- contribution of the fluctuating dilatation
-
- Ys
-
- species mass fraction
-
-
- mass flow rate of fuel
-
-
- diffusion velocity component
-
- αε
-
- inverse effective Prandtl numbers for ε
-
- αk
-
- inverse effective Prandtl numbers for k
-
- ηc
-
- combustion efficiency
-
- ηp
-
- total pressure recovery
-
- γ
-
- specific heat ratio
-
- ωs
-
- species production rate
-
- Ф
-
- equivalence ratio
-
- ρ
-
- density
-
- σε
-
- turbulent Prandtl numbers for ε
-
- σk
-
- turbulent Prandtl numbers for k
-
- τij
-
- stress tensor
-
- ε
-
- dissipation rate
Conflicts of Interest
The authors declare no conflicts of interest.
Funding
This work was supported by the Zhejiang Provincial Natural Science Foundation of China (grant number LQ21E060004) and the Ningbo Major Research and Development Plan Project (grant number 2024Z159).
Open Research
Data Availability Statement
The data that support the findings of this study are available from the corresponding author upon reasonable request.


