Propagation Characteristics of Measurement Error of Low-Cost Sensors in Solar-Powered Unmanned Aerial Vehicle (UAV) Flight Control
Abstract
The large measurement bias and noise fluctuations of low-cost sensors hinder their use in industrial-grade UAVs. However, for large-scale, low-speed fixed-wing UAVs, attitude stabilization throughout the entire flight is more critical than trajectory accuracy. This attribute enables the practical application of low-cost sensors, with solar-powered UAVs exemplifying this category. In light of this, this paper proposes a state estimation method for low-cost flight controllers that incorporates attitude, heading, and navigation hierarchies, and analyzes the error propagation characterization in estimation, control law solving, and control mode switching. The results show that the cross-axis error and root-mean-square noise of the sensor can be relaxed to 1.9 and 1.3 times of the nominal, which can be used as relaxed stability margins for sensor applications; estimation error stabilization guarantees the stability of error propagation through control laws and state switches. This paper demonstrates that measurement error bounds for low-cost sensors can be relaxed and that adaptations at the estimation, control, and navigation levels can facilitate the use of low-cost sensors and support the cost-effective development of navigation systems.
1. Introduction
Small fixed-wing UAVs have been widely researched and play an important role in both military and civil applications due to their flexibility and convenience [1], while cost remains a critical factor that constrains the industrialization of UAVs [2]. In general, UAVs consist of airframe structure, flight controller, actuator, mission payload, data link, energy system, and engine system [3]. The technical specifications including structural weight, thrust-to-weight ratio, wing loading, and communication distance are determined by the mission requirements, such as payload, range, endurance, and target altitude, and these requirements constrain the design parameters of the subsystems [4]. As a result, for a defined mission flight, the technical specifications is fixed, leaving little room for optimization of subsystem design parameters. This constraint makes it challenging for designers to minimize the cost of the platform while meeting mission requirements [5].
Solar-powered UAVs are based on electric UAVs with photovoltaic cells as the source of energy, charging the battery to increase the endurance [6], so that the UAVs trade off a smaller weight and PV cell for a larger range or endurance, resulting in a lower cost over the net flight time [7, 8]. They are well suited for long-distance, wide-area, and long-duration residence missions [9, 10]. For a permanently stationed platform, maintaining stable attitude is critical and high precision in trajectory control is not essential, which lessens the demands on the navigation system [11, 12]. By optimizing the control strategy throughout the entire flight to accommodate acceptable trajectory errors and reducing the frequency of control computations to align with the low-cost flight controllers, it is anticipated that the overall cost of UAV can be decreased. However, the control accuracy achievable by the low-cost flight controller, which consists of inexpensive sensors and low-computing processors, is limited [13]. Data fusion can fully leverage the strengths of different sensors. If the control accuracy of low-cost flight control systems is effectively enhanced to meet mission requirements, solar-powered UAVs will be able to achieve the most cost-effective flights with extended endurance.
The large measurement bias and noise amplitudes of the low-cost sensor constrain its application, and its dynamic range and cross-axis error are notably larger than those of industrial-grade, high-precision sensors. As a result, initial measurements with excessive fluctuations and significant noise cannot be used directly as input to the control. Although mature filtering methods [14], such as complementary filter (CF) [15], extended Kalman filter (EKF) [16–18], unscented Kalman filter (UKF) [19], and particle filter (PF) [20], provide a solution, selecting the appropriate filter depends on several factors [21]. These include the specific characteristics of the platform, computational power limitations, and sensor measurement errors, which are not fully understood in terms of its impact on the final control accuracy.
Furthermore, navigation system engineers are primarily concerned with whether the state error of the closed-loop control can meet mission requirements and select sensors to optimize the balance between accuracy and cost within acceptable limits. Thus, the control error under a closed-loop system becomes important. Chingiz, Demet, and Ulviye [22] address the challenge of estimating wind for small, low-cost UAVs by introducing a robust Kalman filter in the middle layer of wind speed and attitude estimation. Morales et al. [23] use a low-cost quadrotor UAV to recognize the state, demonstrating that fusion of state and image can improve the stability of measurements from low-cost sensors. Guo et al. [24] propose a probability-based adaptive state estimation method and apply it to a low-cost flight controller to improve control stability under dynamic noise and unmodeled disturbances, but only the longitudinal controller is validated. Gamagedara, Lee, and Snyder [25] tackle the issue of inconsistent update frequency and latency in data fusion between low-cost GPS and inertial measurement unit (IMU) by integrating GPS latency time with attitude estimation and demonstrate fusing measurements from low-cost sensors to improve the positioning accuracy through flight experiments. Patel and Faruque [26] address the issue of safe deployment of UAVs in GPS-denied environments by proposing a federal Kalman filter based on multiple low-cost IMUs, which supplements the position extrapolation into the data fusion and improves the stability of measurements from low-cost sensors. Liu et al. propose a local-global filtering framework [27], a model-free distributed EKF method [17], and a federal sampling filter [18] to address the problem of integrated navigation system (INS) with low-cost sensors and demonstrate that low-cost hardware is available within the measurement error threshold. Causa, Opromolla, and Fasano [28] use visual information to enhance position estimation accuracy in swarm UAV closed-loop control, but the machine learning with a high computational burden. Gao et al. [29] proposed a closed-loop control scheme using the posterior state and its covariance as the feedback state, which can effectively avoid the detrimental effect of inaccurate noise statistics on the filter. Sun et al. [30] proposed a continuous finite-time control scheme based on extended state observer (ESO-CFTC), which supplements the model uncertainty and external disturbances into the closed-loop control and improves the convergence speed of the control error, and the method requires high computational power of the controller.
Reducing the cost of UAVs through the low-cost sensors and data fusion is a feasible approach. However, accurately determining the error thresholds of these sensors, particularly the boundary conditions that dictate their applicability, remains an unsolved problem. Therefore, this paper investigates how measurement error propagates in state estimation, control, and mission, and analyzes the influence of measurement error on state estimation and control accuracy. The contribution of this paper is to introduce a method for the quantitative analysis of errors from the measurement to the navigation, which is aimed at determining the propagation characteristics, enabling the identification of accurate error boundaries and applicability ranges for sensors. Besides, appropriate measurement error thresholds are determined according to the mission flights, and state hierarchical estimation is employed to reduce computational demands, which is anticipated to support the cost-effective development of solar-powered UAV navigation systems.
The paper is organized as follows. The low-cost sensor models are developed in Section 2. Section 3 presents the hierarchical state estimation method. Section 4 analyzes the stability of the state estimation error. Sections 5 and 6 describe the propagation of measurement errors in control law solving and switching. Section 7 discusses the propagation characteristics of the measurement error. Section 8 presents the conclusions.
2. Low-Cost Sensor Modeling
This paper utilizes an open-source low-cost flight controller, including IMU, magnetometer, and pressure sensor to examine the characteristics of measurement error.
Table 1 displays the basic properties of the measurement error, and Table 2 shows the error characteristics of the industrial-grade IMU SBG Ellipse. The measurement error involves both bias ε and noise η, which are determined by hardware properties and ambient temperature [31]. The cross-axis sensitivity and noise of the low-cost sensors in Table 1 are more than five times those of industrial-grade sensors in Table 2, indicating that measurements from low-cost sensors cannot be directly used as control input, and data fusion is required to enhance the stability.
| Accelerometer | Dynamic range | Nonlinearity | Cross-axis sensitivity | Noise |
|---|---|---|---|---|
| MPU6050 | ±8 g | 0.5% | ±2% | ±80 mg |
| Gyroscope | ±2000°/s | 0.2% | ±2% | 0.05°/s |
| MPU6050 | ||||
| Magnetometer | Dynamic range | Nonlinearity | Cross-axis sensitivity | Sensitivity |
| LSM303D | ±12 gauss | 0.5% | 1%/gauss | ±0.05% |
| Static pressure | Dynamic range | Accuracy | Error | Delay time |
| MS5611 | 10–1200 kPa | ±1.5 mbar %Vfss | ±2.5 mbar V/kPa | 0.5 ms |
| Dynamic pressure | ±2 kPa | ±2.5 mbar %Vfss | ±1 mbar V/kPa | 1 ms |
| MPXV7200D | ||||
| GPS | Horizontal accuracy | Update rate | Start time | Sensitivity |
| NEO-M8N | ±2.5 m | 10 Hz | 26 s | −148 dbm |
| SBG-Ellipse | Dynamic range | Nonlinearity | Cross-axis sensitivity | Root-mean-squared noise |
|---|---|---|---|---|
| Accelerometer | ±18 g | 0.1% | 0.04% | 0.07 mg |
| Gyroscope | ±425°/s | 0.01% | 0.05% | 0.05°/s |
The cross-axis sensitivity shown in Table 1 refers to the alignment error of the x-, y-, and z-axes, which can be treated as a static bias between the measured and true signals, and the noise denotes the amplitude of signal fluctuations, which can be treated as a zero-mean Gaussian noise. Table 3 shows the measurement model of the low-cost sensor. In Table 3, y is the measurement signal vector; vb and ωb = [p, q, r]T are the translational and angular velocities of the UAV; R(Θ) is the inertial frame to the body frame transformation matrix; Θ = [ϕ, θ, ψ]T is the attitude angle; ρ represents the air density; h represents the altitude; Va represents the airspeed; p represents the position; v is the position update rate; w is the wind speed vector; and subscripts n, e, and h correspond to the north, east, and height components.
| Sensor | Measurement model | |
|---|---|---|
| Accelerometer | (1) | |
| Gyroscope | ygyro = ωb + εgyro + ηgyro | (2) |
| Magnetometer | (3) | |
| Static pressure | yabspres = ρghAGL + εabspres + ηabspres | (4) |
| Dynamic pressure | (5) | |
| GPS | (6) | |
Sensor measurement bias, noise, and update frequency are different in steady-state or dynamic processes, and the impact of these errors can be minimized through the fusion and complementing of measurements from multiple sensors. In order to verify the accuracy of the model, a full-wing solar-powered UAV with a wingspan of 7 m and a weight of 15 kg is used as an example. The measurement model in Table 3 is added to the nonlinear dynamics model of the UAV, and a cruise flight simulation is performed at an altitude of 600 m, an airspeed of 12.5 m/s, and an ambient temperature of 25°C. The true state and measured state of the sensors are shown in Figure 1.
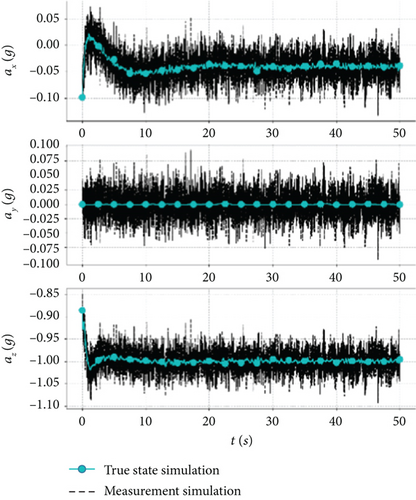
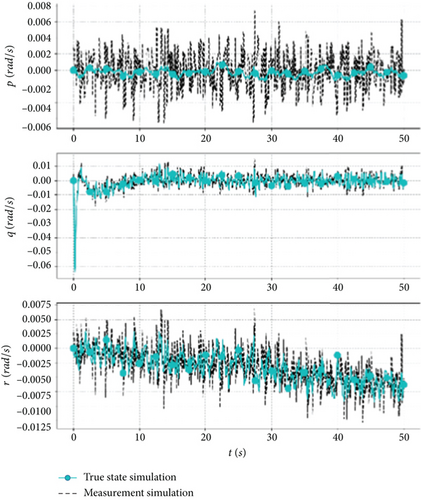
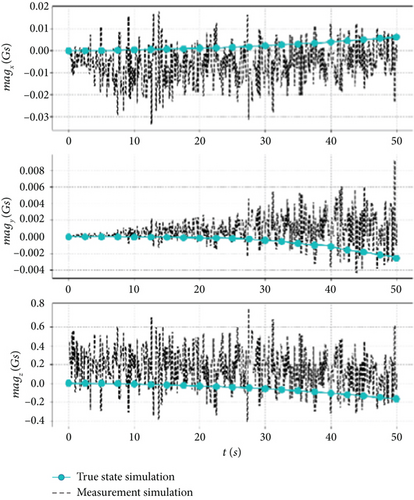
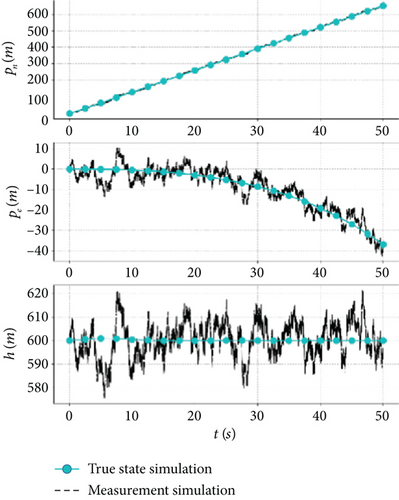
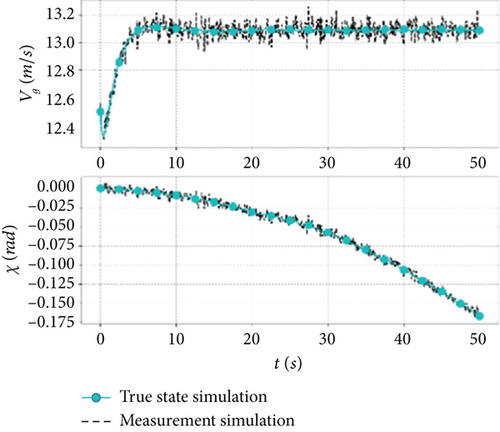
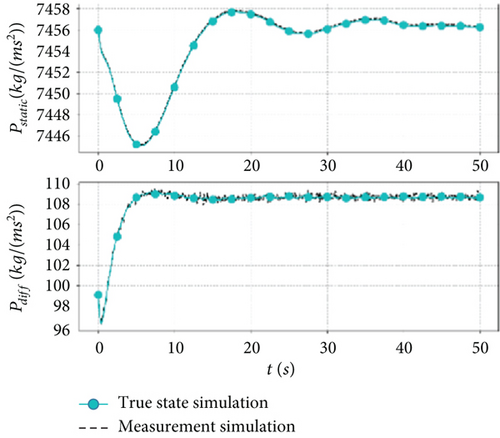
Figure 1a,b illustrates the measurement simulations of the IMU, where the accelerometer and gyroscope exhibit high-frequency characteristics, and the effect of noise on the measurements becomes more apparent, and Figure 1c shows the magnetometer measurement, where noise and bias are more prominent. The high-frequency signals may introduce bias when measuring the steady-state process, but they enable capturing the trend in the measurement of the dynamic process and are suitable for state prediction. Figure 1d,e depicts the GPS measurement simulation, which exhibits low-frequency for position, ground speed, and heading angle, and Figure 1f illustrates the pressure sensor measurement simulation, where the dynamic and static pressures are characterized by midfrequency. The mid- and low-frequency signals exhibit less bias and accurately represent the dynamic process and are suitable for state correction.
3. Hierarchical State Estimation Method
Considering the differences in sampling frequency and measurement accuracy between static and dynamic processes of low-cost sensors, it is possible to combine the dynamics model of the UAV with the sensor measurement to achieve optimal estimation at minimum computational cost. The EKF is a first-order linearization of the nonlinear part of state prediction and measurement updating based on the KF [32], which has the advantages of low computational cost and high applicability, and is well suited for application to the low-cost flight controller.
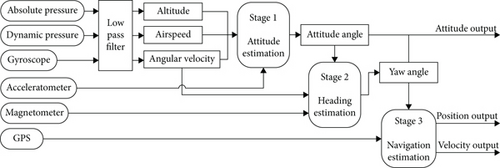
Given that the 14-dimensional observation state is computationally intensive and not suitable for low-cost flight controllers, we reorganize the state parameters into lower-order groups based on the mission requirements of UAVs, which can significantly reduce the computational burden of state estimation. As shown in Figure 2, attitude and altitude accuracy are the highest requirements for horizontal position accuracy during mission flight, and the attitude estimation is used as the first stage. Next, the yaw angle estimation is performed to maintain a stable heading angle throughout the climb and descent phases, which is used as the second stage. Finally, navigation estimation is performed based on the low-frequency characteristics of the GPS.
3.1. Attitude Estimation
3.2. Heading Angle Estimation
The heading angle is of utmost importance for aerial photography missions, particularly when the UAV is equipped with an optical or infrared camera. During landing or upwind conditions where the ground speed is low, the accuracy of the heading angle obtained from GPS cannot meet the mission requirements, whereas the magnetometer is unaffected by wind and low speed and is well suited for estimating the yaw angle. To minimize the effects of wind and ensure an accurate field of view for both the camera and the data link, it is essential to determine a crabbing angle χcrab = χ − ψ that compensates for wind interference. In addition, to avoid the photovoltaic cells on the wings from interfering with the magnetometer, it is separated from the flight controller and mounted independently on the wingtip, as shown in Figure 3.

3.3. Navigation Estimation
Then, calculations are carried out within each layer according to Equation (3), and the estimated states are utilized as input for the subsequent layer. The initial 14-dimensional observation state is decomposed into 5-dimensional low-pass filtering, 2-dimensional attitude estimation, 1-dimensional heading estimation, and 6-dimensional navigation estimation after the hierarchical process. This approach converts the single prediction and measurement update of the high-dimensional state into multiple updates of the low-dimensional state, achieving a downscaling of the computation.
4. Stability Analysis of Estimation Error
State estimation accuracy and computational cost are often in conflict [33], and hierarchical estimation reduces computational cost while also reducing estimation accuracy. Therefore, it is essential to establish accurate bound regarding estimation errors. To address this, a Lyapunov function is constructed for the estimation error and the bias and noise are relaxed along the lines of hierarchical structure, leading to the derivation of a new stability constraint that provides guidance for the application of low-cost sensors.
Taking the simulation in Figure 1 as an example, the singular values of the state matrices Ak and Ck are a2 = 13.6 and c2 = 18.88. Further, the singular values of the covariance matrix Pk are found to be p1 = 0.001 and p2 = 0.01, and r1 = 0.025 based on the cross-axis sensitivity of the gyroscope in Table 1. Assuming that the predicted noise is the same as the measured noise, let q1 = 0.001; substituting these parameters into Equation (20) yields εφ = 4 × 10⁻⁴, εχ = 5 × 10⁻⁵, κφ = 4.6 × 10⁻⁵, κχ = 0.87 × 10⁻⁴, α = 0.0017, ε = 4 × 10⁻⁴, and .
The stabilization boundaries derived from the above calculations are quite strict, with ε and exceeding the error and noise requirements of the high-precision sensor listed in Table 2. The control accuracy requirements for different flight phases of solar-powered UAVs are different, and the factors affecting error stability can be evaluated independently. By disregarding the effects of coupling at each stage, and assuming that prediction and measurement updates are independent, along with the independence of sensor measurement bias and noise, the error bounds of a sensor can be significantly relaxed.
4.1. Relaxation of Measurement Bias
Using the simulation data of Figure 1 as an example, α1 = 8.43 × 10⁻⁴ and α = 0.78 can be obtained based on the minimum eigenvalue of . Then, substituting them into Equation (20) yields an initial error of ε = 0.038 and , both of which are more stringent than the accuracy requirements of the accelerometer specified in Table 1.
4.2. Relaxation of Measurement Noise
Under the above simulation example, we can get , w2 = 6.52 × 10³, and δw = 1.68 × 10⁻⁶, with as the relaxed noise boundary.
After relaxing the noise boundary, the initial error ε = 0.038, a noise variance δw = 1.68 × 10⁻⁴, and root-mean-square noise . Table 4 lists a comparison between the measurement error boundaries after the initial stability analysis, initial error boundary relaxation, and noise boundary relaxation.
| Initial stability analysis | Initial error boundary relaxation | Noise boundary relaxation | |
|---|---|---|---|
| Threshold | |||
| Assumption | Lyapunov stabilization | Bias and noise independent | Prediction and measurement independence |
| Accuracy | Industrial-grade accuracy | Higher than low-cost sensors | Slightly lower than low-cost sensors |
| Application | Preliminary analysis of the stability of estimation errors | Analysis of the effect of measurement bias on estimation | Low-cost sensor error threshold determination |
The use of a hierarchical state estimation architecture relaxes the stability constraints on the estimation error. Under the prediction and measurement process independence and measurement bias and noise independence assumptions, it is possible to relax the initial error bounds from 0.0004 to 0.038 and the root-mean-square noise from 1.44 × 10⁻⁷ g to 0.103 g, which corresponds to a 1.9-fold increase in cross-axis error and a 1.3-fold increase in root-mean-square noise of Table 1, demonstrating that the applicability of the low-cost sensors can be extended.
4.3. Effect of Measurement Error on Estimation Accuracy
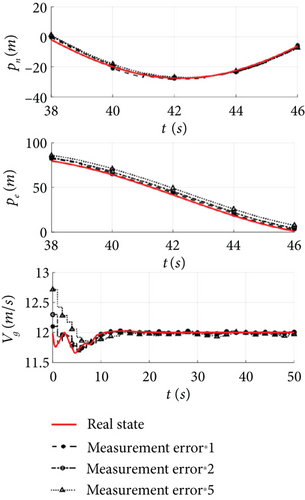
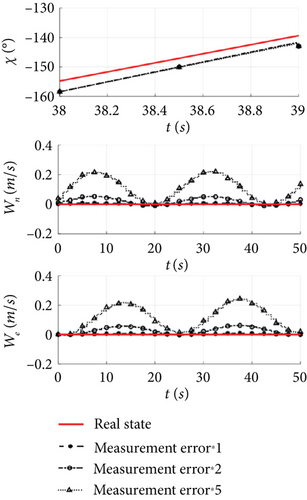
Then, the effect of measurement bias and noise on the estimation accuracy is analyzed by state estimation of a solar-powered UAV in cruising under the previous simulation conditions. The stability analysis of the state estimation reveals that the estimation error tends to be unstable when the bias and noise increase up to a factor of two. In order to quantitatively analyze the effect of measurement errors, the bias and noise are scaled by 1, 2, and 5 times in the simulation, and the estimation results of attitude angle and position are shown in Figures 4 and 5.
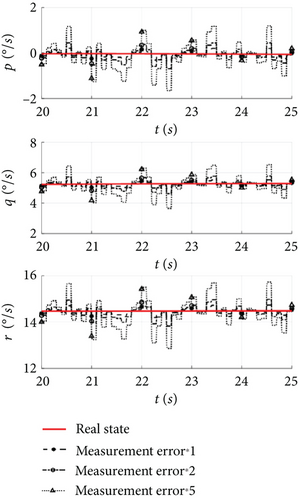
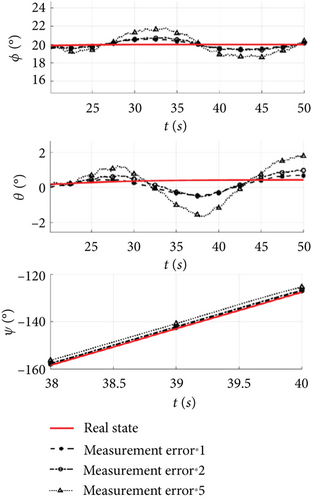
As the measurement error increases, the steady-state noise amplitude of the angular velocity estimation in Figure 4a increases, and the pitch and roll angles fluctuate between 20 and 50 s in Figure 4b. Under the error conditions in Table 1, the steady-state estimates of the attitude angle oscillate and converge, with the yaw angle estimation error of 0.5°, which can be used as the control input. However, when the error is increased to 2 and 5 times, the steady state of the attitude angle oscillates and diverges, and the yaw angle estimation error exceeds 3°, rendering it unsuitable for the feedback control. Therefore, it is important to note that under a hierarchical estimation structure, a steady-state estimation of the attitude angle is crucial for estimating the heading angle, and if the former experiences fluctuations, the estimation error for the latter will further increase.
Attitude and heading are the basis of navigation estimation, and the position, ground speed, and heading angle in Figure 5 exhibit a similar trend to the real state, but with fluctuations introduced by measurement errors affecting the steady-state estimates. Under the error conditions in Table 1, the ground speed estimate stabilizes within 0.5 s and the position estimates are accurate. However, when the measurement error is increased to 2 and 5 times, the instability of the attitude angle estimation leads to a position estimation error of 2.5 and 3.5 m, the initial error in the ground speed estimation increases by 0.7 and 1 m/s, and the steady-state convergence time is increased to 4 and 8 s. The slow convergence speed and large steady-state error make them unsuitable as control input.
Within the error threshold, hierarchical estimation reduces the effects of measurement bias and noise, thus improving the accuracy of the control inputs. Beyond the threshold, the layered states tend to couple with each other and the state estimation error is unstable. The magnification of the measurement error is consistent with the estimated error stability boundary in Table 4, proving the accuracy of the error stability analysis, and the state estimation transforms the measurement error into estimation error, which provides a quantitative basis for analyzing the impact of measurement error on control accuracy.
5. Propagation of Measurement Error in the Control Loop
To optimize the arrangement of PV cells, the solar-powered UAV illustrated in Figure 3 eliminates ailerons and utilizes only differential throttle for lateral control. As an under-input control platform, it experiences significant coupling between roll and heading. Therefore, the design of the attitude, heading, and navigation control loops is structured according to the order of state estimation, as shown in Figure 6, with control input including pitch angular velocity, pitch angle, vertical velocity, and estimated altitude and airspeed.
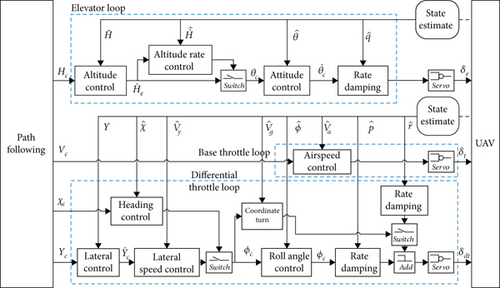
For large-scale wings with high aspect ratios, the roll moment coefficient Cl significantly exceeds the yaw moment coefficient Cn, indicating that the roll effect becomes more pronounced when differential throttle control induces sideslip. Therefore, the roll angle serves as the inner loop of the lateral control, with heading angle and lateral position as the outer loop.
5.1. Effect of Measurement Error on Attitude Control Accuracy
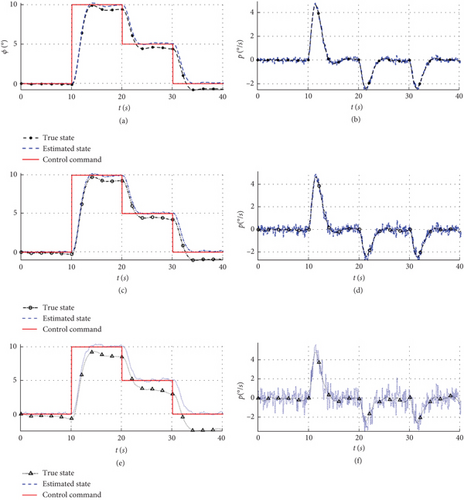
To validate the effectiveness of the attitude control, simulations are performed using the same conditions as before, where the estimated states are used as input to the control, considering measurement errors of the sensors in Table 1 scaled at 1, 2, and 5 times, and the control commands are varied in a step-wise manner. The above control law gains are Kθ = 0.15, Kq = 2, Kqi = 0.3, Kϕ = 1.8, Kp = 1, Kpi = 0.5, and Kr = 0.4, and the simulations of the pitch and roll angles are shown in Figures 7 and 8.
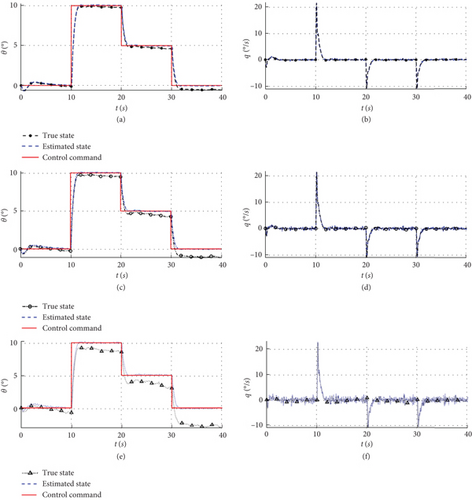
Under the error conditions in Table 1, the pitch angle estimation error amounts to 0.8°, and the steady-state error of Figure 7 after feedback control is less than 0.5°, which can be used as the inner loop of altitude control. However, under conditions of 2 and 5 times measurement error, the fluctuation observed in the pitch angle estimation (Figure 4) leads to an increase in the error exhibited in Figure 7 after the feedback control. In these cases, the pitch angle control errors of 1.5° and 3° exceed the magnitude of the estimation error, and excessive measurement error renders the attitude control unfit for pitch hold as the inner loop for altitude control attitude control, indicating that the estimation error is amplified by the control in case the measurement error surpasses the stability boundaries; thus, the stability of the outer-loop control cannot be guaranteed.
Similar to Figure 7, the roll angle control error shown in Figure 8 remains below 0.5° under the error condition of Table 1. It is worth noting that for the 2 and 5 times measurement error conditions, the control error also exceeds the estimation error. Attitude control simulations show that the estimation error is amplified by the closed loop in case the measurement error surpasses the stability boundaries; thus, the stability of the outer-loop control cannot be guaranteed.
5.2. Effect of Measurement Error on Position Control Accuracy
Differential throttle control exhibits a slower response compared to the aileron, resulting in a delayed heading angle control response that impacts trajectory control accuracy. To address this, a vector field (VF) [31] control method is implemented to enable a smooth transition from trajectory to heading angle control. The VF method dynamically adjusts the heading angle command based on the relationship between the lateral distance and the target heading angle, utilizing the nonlinear transition of the inverse tangent function. This results in a more gradual change in command compared to lateral distance feedback, as depicted in Figure 9, where the straight line represents the target path and the arrow represents the transitional heading angle command. Here, ep represents the position error vector, χ∞ represents the reference heading angle, χq represents the target heading angle, and the heading angle command χc undergoes a transition from χ∞ to χq during the cross-track error epy correction.
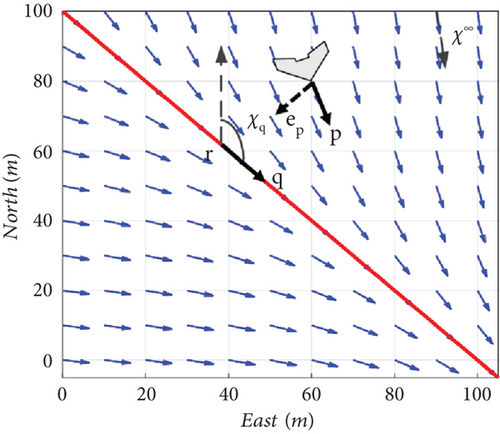
Then, the trajectory control method is validated using the same model, the UAV is initialized from the point (0, 0) towards the east to track the target path with the starting point (0, 0) and ending point (−300, −600), and the control gains are set at and χ∞ = π/6. The trajectory control simulation under different measurement error conditions is shown in Figure 10.
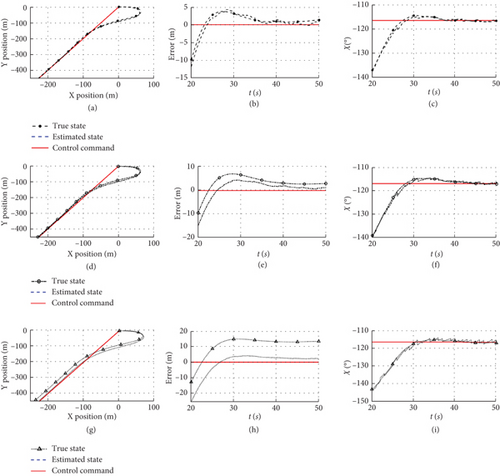
The initial heading angle between the UAV and the target trajectory is −120°, which stabilizes after a substantial change in the heading angle. However, there is a significant difference in the steady-state error for different error conditions. Under the error conditions in Table 1, the trajectory control error shown in Figure 10b aligns closely with the estimated error in Figure 5a, attaining a control accuracy within 1 m. When the error is increased to 2 and 5 times, the amplitude of heading angle control oscillation depicted in Figure 10c also increases due to the estimation errors of heading angle and trajectory in Figure 10a, and the steady-state error in Figure 10b rises to 2.9 and 13 m, rendering the UAV incapable of accurately tracking the target trajectory.
Attitude and trajectory control simulations show that accurate state estimation in the inner loop is the basis for stabilization of control errors in the outer loop. When the measurement error exceeds the threshold, excessive position estimation error leads to significant changes in the trajectory control command, resulting in fluctuations in the inner-loop control command. Moreover, the instability of the inner-loop control also affects the feedback state estimation, ultimately causing the outer-loop control error to continuously increase, and the UAV cannot maintain a stable flight.
6. Propagation of Measurement Errors in Mission Control
6.1. Flight Control Mode Switching
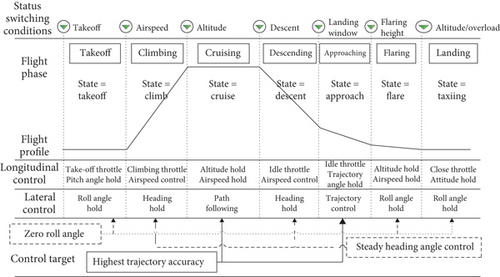
The control objectives of the UAV vary across different phases, indicating that not all states require precise control. Instead, the emphasis should be on achieving the target state. Due to the differing control law objectives at different phases, this paper proposes a mode switching transition strategy, to mitigate state fluctuations that may arise from mode switching.
As shown in Figure 11, during take-off or landing (h < 10 m), it is essential for the UAV to maintain a 0° roll angle to ensure the safety of its large wings. The control strategy for these phases includes managing maximum or idle throttle, as well as controlling pitch and roll angles. Climbing and descending account for a small proportion of the mission flight; in these phases, it is sufficient to ensure the accuracy of the heading angle, allowing for a moderate relaxation of trajectory control precision. The control law during these stages relies on managing pitch angle, airspeed, and heading angle. In contrast, during cruising or loitering, the UAV must accurately follow the target path while maintaining stable altitude and airspeed. The control law in this phase encompasses altitude and airspeed control, as well as VF trajectory control.
6.2. Effect of Measurement Error on Mission Control Accuracy
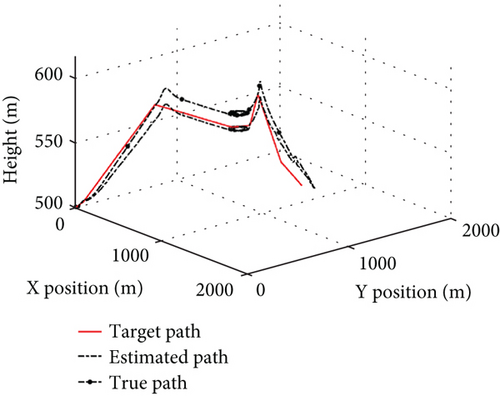
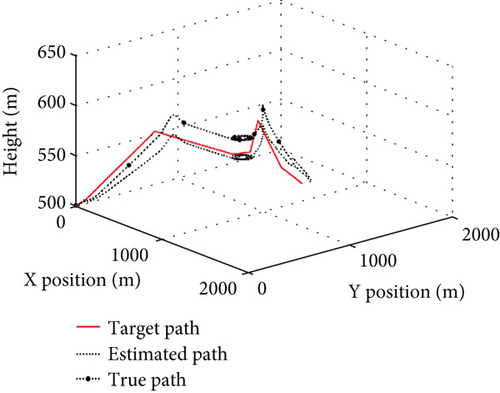
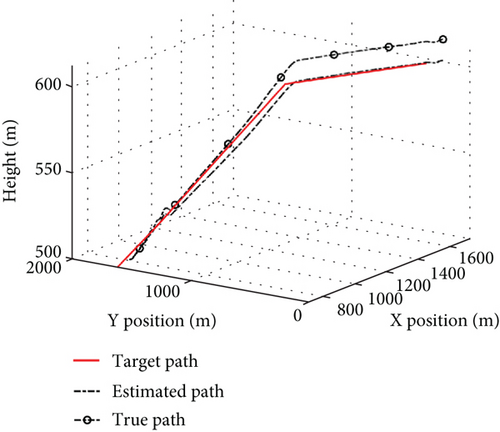
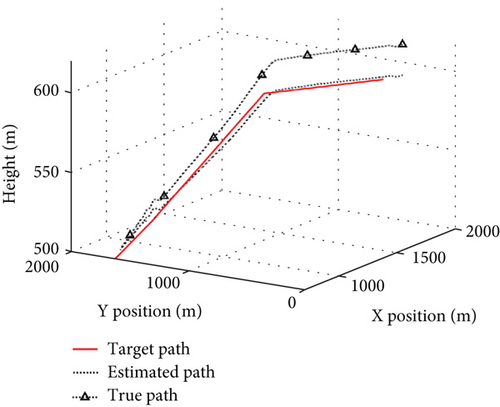
To evaluate the propagation characteristics of measurement errors in mission control, the control mode switching is incorporated for different measurement error simulations. The UAV operates with a runway of 500 m for take-off and landing, an ambient temperature of 25°C, no wind, and waypoint as shown in Table 5, with a simulation time of 420 s. The whole trajectories under different error conditions are shown in Figure 12, the landing trajectories are shown in Figure 13, and the control errors are shown in Figure 14.
| Waypoint | Starting point | Climbing point | Cruising point | Mission point | Returning point | Landing point | Endpoint |
|---|---|---|---|---|---|---|---|
| North position (m) | 0 | 92 | 850 | 1620 | 1150 | 760 | 700 |
| East position (m) | 0 | 0 | 60 | 170 | 810 | 1370 | 1620 |
| Altitude (m) | 500 | 510 | 600 | 600 | 600 | 525 | 500 |
| Airspeed (m/s) | 15 | 16 | 13 | 13 | 13 | 9 | 5 |
| Simulation time (s) | 0 | 10 | 60 | 120 | 285 | 340 | 415 |
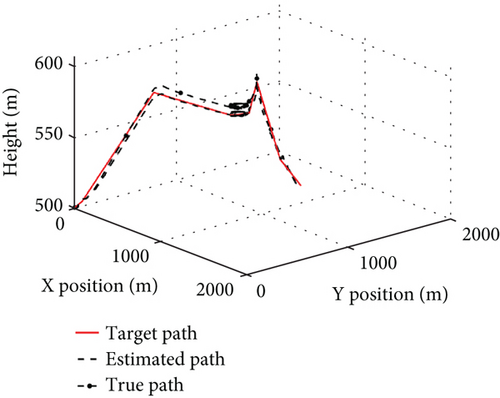
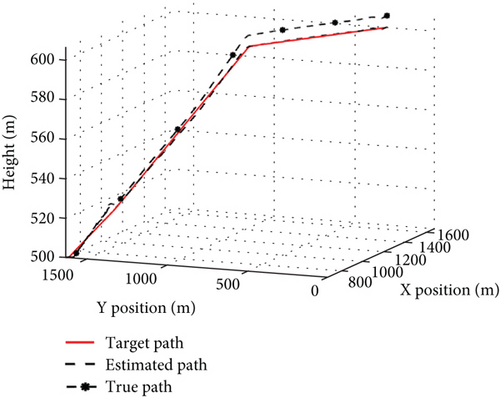
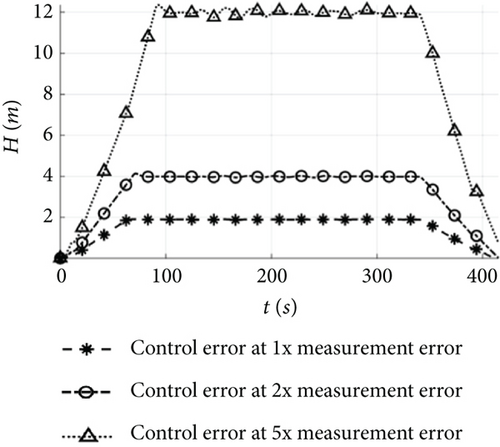
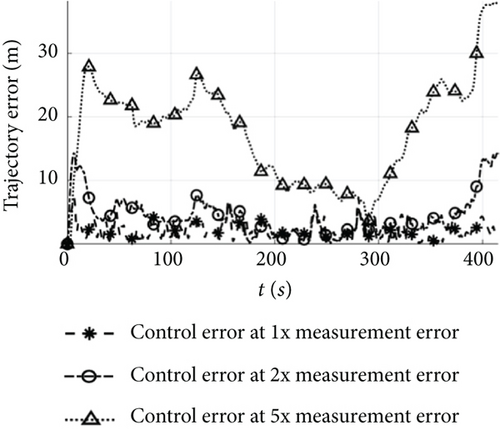
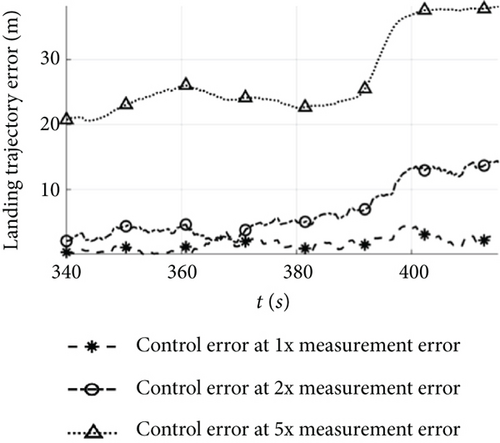
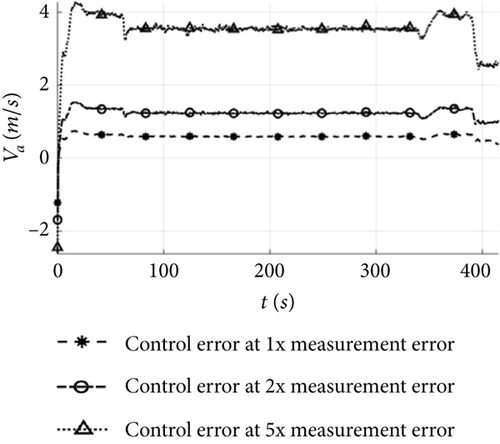
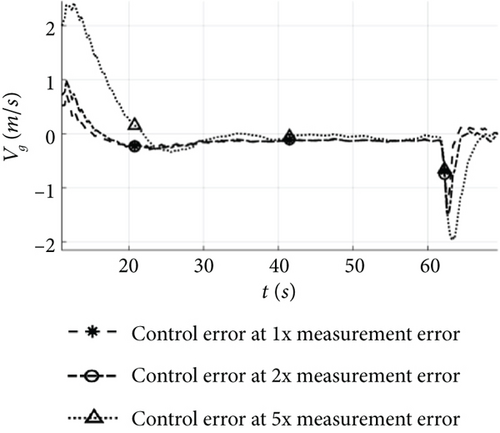
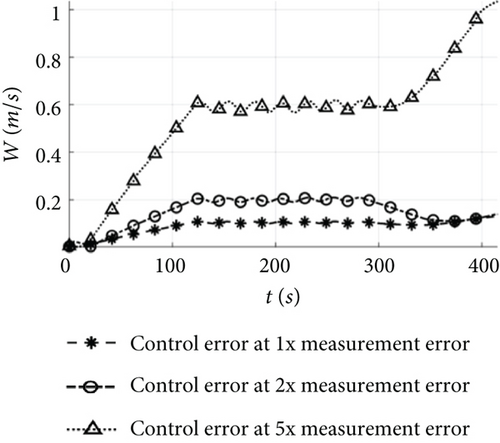
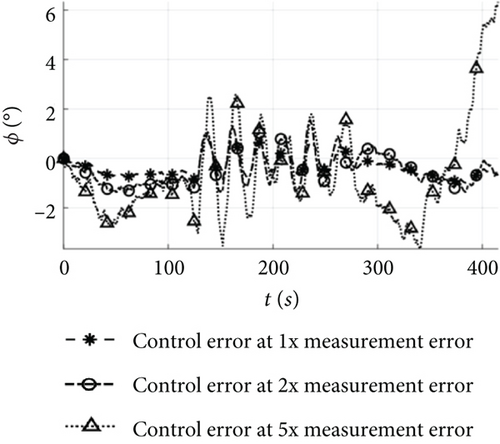
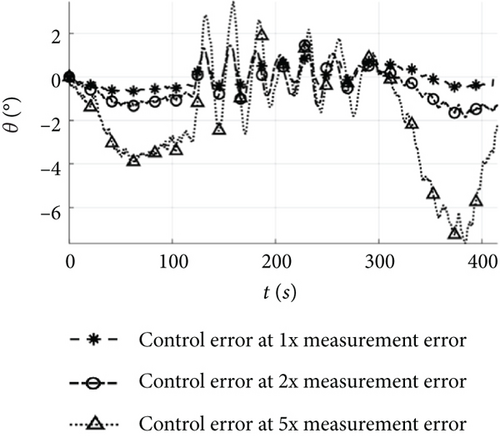
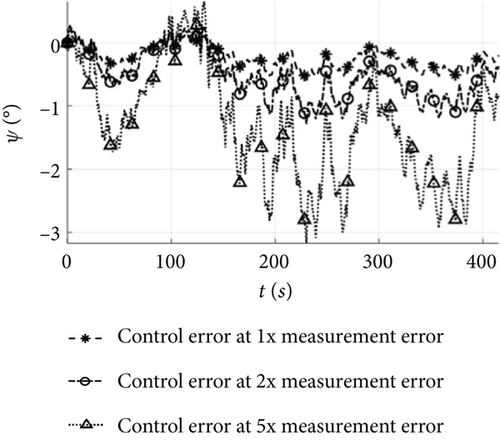
Under the error conditions in Table 1, both the estimated and true flight trajectories depicted in Figure 12a accurately track the target. In the cruising shown in Figure 14, the altitude error is 1.8 m, the horizontal position error 2.3 m, the airspeed error 0.5 m/s, and the attitude angle error 1°. As for the landing in Figure 13a, the altitude error gradually decreases, with the altitude error in Figure 14 being less than 2 m; the horizontal position error remains below 2.3 m; and the errors for the other states remain stable. These results demonstrate that when the estimation error remains stable, the control error after the control mode switching during the mission flight aligns closely with the estimation error, and the UAV equipped with low-cost flight controllers can achieve precise control of the mission.
Under the condition of two times measurement error, both the estimated and true flight trajectories shown in Figure 12b exhibit a similar trend to the target. However, the estimated flight trajectory deviates from the target path once the UAV enters the climbing. In the cruising of Figure 14, the altitude error is 4 m, the horizontal position error 6.3 m, the airspeed error 1.5 m/s, and the attitude angle error 2°, with minor fluctuations. Due to the instability of the estimation error, the trajectory error increases in the landing shown in Figure 13b reaching 15 m after the control mode switching. Therefore, when the measurement error approaches the stability boundary, the UAV is capable of implementing control mode switching during the phases of take-off, climbing, cruising, loitering, and landing, but the increase in position error hinders its ability to accurately track the target path.
As the measurement error increases to five times, both the estimated and true flight trajectories depicted in Figure 12c deviate significantly from the target. In Figure 14, the cruising exhibits an altitude error of 12 m, a horizontal position error of 20 m, an airspeed error of 4.2 m/s, and an attitude angle error of 4°, with significant fluctuations. Following the control mode switching during the mission, the attitude angle error displays oscillations and disperses during the landing, and the wind speed estimation error continues to grow, resulting in the inability of the UAV to complete the accurate switching of the control mode and further amplifying the trajectory error. Finally, the horizontal position error in the landing shown in Figure 13c increases to 40 m, rendering the mission unachievable.
Figure 15 illustrates the changes in state estimation error, control error, and mission error under different measurement error conditions. For the error conditions in Table 1, the initial estimation errors for attitude, airspeed, and position are 0.8°, 0.5 m/s, and 1 m, respectively, and these errors remain relatively unchanged after control law solving and switching. In the case of 2 and 5 times error conditions, the initial estimation errors for attitude, airspeed, and position are 1° and 2.5°, 0.8 and 1.5 m/s, and 2.5 and 3.5 m, respectively. However, the errors after control law solving increase by more than 1 and 3 times compared to the estimation errors, and the errors after mode switching increase by more than 1.3 and 2 times compared to the control solving errors.

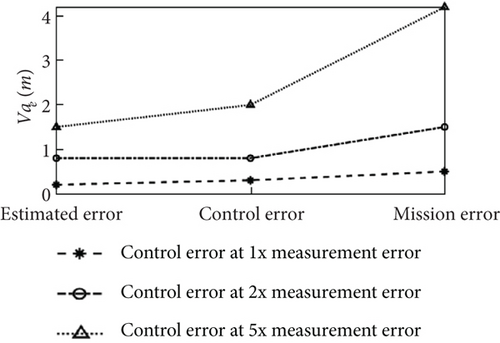
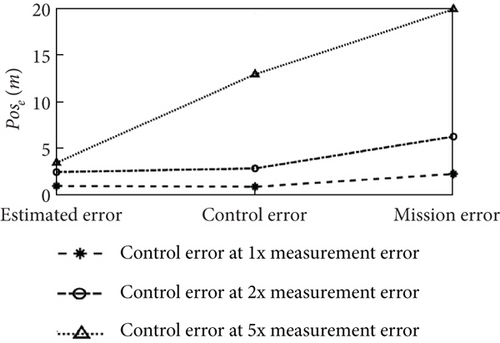
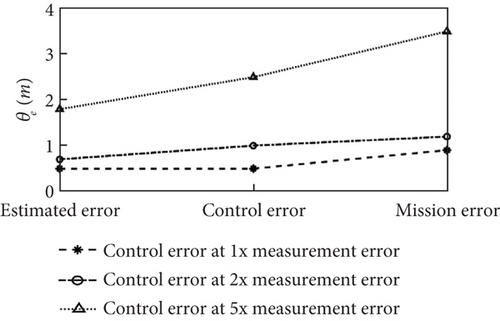
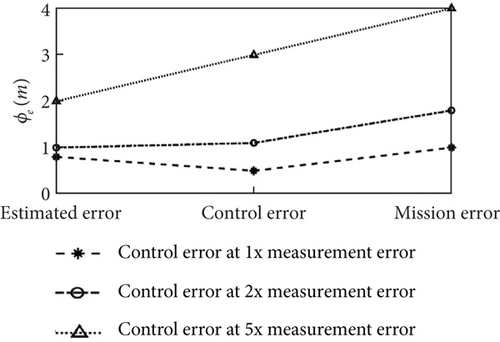
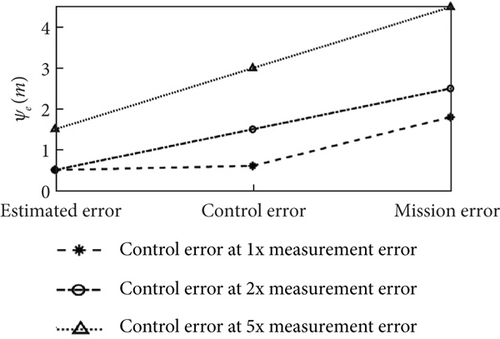
When the measurement error of a low-cost sensor falls below a specified threshold, hierarchical state estimation effectively reduces the impact of sensor measurement bias and noise. The estimated state can then be utilized as a control input, leading to rapid convergence of the error and ensuring that the steady-state control accuracy meets the requirements. Although there is an increase in attitude angle and horizontal position errors during the transition from climb to level flight or level flight to loiter, they converge rapidly. At the error boundary, the error resulting from the attitude control increases gradually. However, after the control mode is switched, the error escalates more significantly, preventing the UAV from accurately tracking the target path. When the sensor measurement error surpasses the threshold, the state estimation error oscillates and disperses, while the errors after control law solving and switching continue to grow. The significant deviation of the flight trajectory from the target leads to persistent failures in attitude control, which hampers the UAV to follow commands and adversely affects the stabilization of the state. To facilitate the application of low-cost flight controllers on solar-powered UAVs, it is necessary to calculate accurate boundaries for measurement errors by relaxing the stability analysis.
7. Discussion
Hierarchical state estimation decouples the high-dimensional state based on the flight characteristics of the UAV. This approach transforms the single estimation of 14-dimensional states into multiple estimations of six-dimensional states, thereby reducing computational costs and aligning with the capabilities of low-cost flight controllers. This process converts the measurement error into an estimation error, serving as the starting point for the propagation analysis. The error threshold can be relaxed within a certain range, allowing the state estimation to reduce the impact of measurement bias and noise. However, as the measurement error approaches or exceeds the threshold, the steady-state estimation error may oscillate or diverge, maintaining a constant amplitude. Therefore, accurately predicting the stabilization boundaries of state estimation errors is essential, as it determines the usability of a low-cost sensor.
The control law is considered to be a holdover of the measurement error within the threshold, and stabilization of the estimation error ensures that the control error not only is stabilized but also converges rapidly. When the estimation error becomes unstable, the attitude angle command generated by the position control fluctuates significantly. These fluctuations are then combined with the existing attitude angle estimation error, ultimately leading to dispersion in the final control error.
The mission control exemplifies how the error changes during control mode switching, such as transitions from climb to level flight or level flight to loiter, introduce fluctuations in the state estimation error, thereby increasing the control error. Estimated error stabilization ensures that the errors generated by control mode switching converge rapidly with the same steady-state amplitude. However, when the estimation error becomes unstable, the error accumulates gradually after each state switch, impeding the UAV from entering the descent or landing phase.
The detailed segmentation of UAV control modes can determine the accuracy requirements of different states at different stages, thereby reducing reliance on navigation systems. Accurately predicting the stability boundaries of state estimation errors allows for the determination of the measurement error range. This enables the selection of flight control and sensor options that balance performance and cost, ultimately minimizing navigation system expenses.
8. Conclusions
In order to achieve the lowest cost of the solar-powered UAVs, this paper proposes a hierarchical state estimation method and determines the relaxed stability boundaries of the sensors, designs and verifies the control law structure and switching method of a full-wing solar-powered UAV, and completes the analysis of the propagation characteristics of the measurement error in the mission control. The main conclusions are as follows.
It is feasible to use low-cost flight controllers to large-scale, low-speed fixed-wing UAVs with small attitude changes. With hierarchical estimation of attitude angle, heading angle, and position, it is possible to reduce the computational cost of the state estimation and obtain reliable estimation results while using low-cost sensors.
The long-endurance, low-speed, and low-attitude change of solar-powered UAVs ensure that the assumption of independence of predicted and measured updates for state estimation holds. Through stability analysis, it is possible to relax the error boundaries of low-cost sensors, the cross-axis error boundaries can be increased by up to 1.9 times, and the root-mean-square noise boundaries can be increased by up to 1.3 times, which broadens the range of applications of low-cost sensors and provides a basis for low-cost navigation and flight development.
When the measurement error approaches or exceeds a threshold, the layered states are coupled to each other and the error is amplified after control laws and control switching, and the total error consists of two components: the estimation error, which increases with the measurement error, and the control error that arises after control law solving and switching and increases more than the estimation error. Therefore, the cost-effective development of a navigation system needs to first identify the control accuracy requirements of UAVs at various stages. Then, appropriate sensors should be selected within the established error boundaries. This approach, which integrates estimation, control, and mode transition, is aimed at comprehensively reducing system costs and contributing to the advancement of low-altitude economies.
Conflicts of Interest
The authors declare no conflicts of interest.
Author Contributions
The first author, An Guo, undertook research acquisition, state estimation method, data analysis, figure and table production, whole process simulation, and completion of the paper; wrote the manuscript; and revised the paper based on relevant comments, as the corresponding author and the head of the funded project to ensure the authenticity of the paper. The second author, Shanshan Mu, undertook the overall idea design, numerical analysis, and simulation case design in the research work of this paper; participated in the writing and review of the paper; and was responsible for all aspects of the paper. The third author, Zhou Zhou, undertook the system modeling and control law design of the UAV in the research work of this paper, made important contributions to the low-cost controller scheme, helped to complete the verification of the simulation results, and was responsible for all aspects of the paper to ensure the authenticity of the paper. The fourth author, Jiwei Tang, undertook the simulation verification, helped to complete the writing and revision of the paper, made important contributions to the work of the paper, and could be responsible for all aspects of the paper to ensure the authenticity of the paper.
Funding
This work was funded by the Natural Science Basic Research Plan in Shaanxi Province of China (2024JC-YBQN-0460) and Scientific Research Program Funded by Shaanxi Provincial Education Department (Program No. 24JK0596).
Acknowledgments
The authors would like to express their sincere gratitude to the editor-in-chief, the guest editors, and the anonymous reviewers whose insightful comments have helped to improve the quality of this paper considerably.
Open Research
Data Availability Statement
All data generated or analyzed during this paper are included in this published manuscript, and all authors of this paper are responsible for the authenticity of the data.


