Computation of Vibration Response of Aircraft Due to the Gap Between the Track and Roller in the Flap Subjected to Unsteady Flow
Abstract
This study explores the impact of flap gaps on aircraft cabin vibrations, focusing on the dynamic responses of flap structures under aerodynamic excitations. Flaps are crucial for aircraft control, especially during takeoff and landing. Common issues in flap systems, such as wear on slide tracks, bearing clearances, and bushing slippage, introduce gaps that amplify vibration amplitudes. A time–domain method, employing a spring–beam model, was used to convert aerodynamic loads into structural loads, providing detailed insights into flap dynamics and their influence on the aircraft. Computational fluid dynamics software was utilized to calculate aerodynamic force distributions, and the effects of varying gap sizes on constraint forces and vibration responses were analyzed. The results indicate that increasing gap width reduces the maximum constraint force at the flap, altering the vibration characteristics. The study also reveals that higher vibration responses occur in the fore section of the fuselage due to modal superposition of frequencies near those of the flap support forces. Enhancing the stiffness of gap elements can mitigate abnormal vibrations, thereby improving aircraft performance and passenger comfort. This paper offers a quantitative analysis of the effects of flap gaps, serving as a technical reference for diagnosing faults based on cabin vibrations. These findings are critical for advancing aircraft design and maintenance practices, contributing to improved safety and reliability under extreme flight conditions.
1. Introduction
Vibrations induced by mechanical failures in components like seals and bearings are critical issues for passenger airplanes, affecting both comfort and safety. The trailing flap, an aerodynamic surface designed to increase lift, often extends from the carriage through a track supported by rollers. However, wear on the track and play in the roller bearings can create gaps between the track and rollers, leading to a reduction in the stiffness of the flap. When the flap is extended, it is subjected to significant turbulence, and the fluctuation of aerodynamic loads can cause movement within the flap, resulting in collisions within the gaps and inducing vibrations in the fuselage. This study conducts a numerical simulation to assess the vibration response of the fuselage to such mechanical issues.
The stability and reliability of the flap mechanism are crucial for ensuring the smooth and safe operation of aircraft during takeoff and landing. The design objective for flap structures is to ensure smooth movement during extension and retraction, free from vibration or jamming. However, flap system failures are common in civil aviation, with various Boeing and Airbus models experiencing such issues. The most vulnerable components are the flap movement mechanisms, where typical failures include wear of the slide tracks, bearing clearance issues, and liner slippage, all contributing to gaps within the mechanism [1]. Nonlinear aeroelastic analyses of airfoils have been extensively studied. Cooper and Jonathan [2] outlined the coupling of structural and aerodynamic computational models. Qiu et al. [3] discussed fatigue damage to the tailplane caused by resonant vibrations from airflow through gaps at specific frequencies. Silaev et al. [4] examined the changes in vibration characteristics due to damage to aircraft bearing surfaces. Yue and Zhao [5] proposed a new approach based on local model interpolation to generate a linear parameter-varying model for a folding wing. Chen [6] introduced a novel predictor–corrector dynamic mesh method to simulate the unsteady aerodynamic forces on tilt–rotor aircraft during conversion. Xu et al. [7] developed an effective method for describing wall mesh motion caused by wing folding and aileron deflection, along with coupled calculation programs based on shared memory technology for cosimulation between structural and aerodynamic solvers. However, research on gap-type dynamic behavior in airfoils has been primarily limited to wing components, with less focus on the entire aircraft structure.
When an aircraft encounters turbulence, the flaps experience external aerodynamic excitation. Due to gaps in the movement mechanism, insufficient constraint stiffness may compromise the mechanism’s normal operation, increasing flap vibrations and leading to abnormal vibrations in the cabin. Studying these abnormal vibrations provides a foundation for improving stability and reliability, as well as insights for diagnosing failure types and locations through cabin vibration analysis.
Analyzing abnormal vibrations in the flaps requires detailed knowledge of the aerodynamic forces acting on the structure. The aerodynamic model of the flaps resembles the actual structure, featuring raised fairings on its surface, while the structural model typically includes only the primary load-bearing components and has a simpler surface. The differing mesh densities between aerodynamic and structural models present challenges in directly applying aerodynamic forces to the structural model, resulting in the need for fluid–structure interaction (FSI) analysis [8].
Some finite element (FE) software offers fluid–structure coupling analysis, which links aerodynamic forces with structural deformation. This method is advantageous when precise calculation of aerodynamic characteristics on surfaces like flaps is needed, but it requires extensive computational time and high mesh compatibility. When aerodynamic deformation has minimal impact on aerodynamic forces, the process can be simplified by directly transferring aerodynamic loads to the structural grid. Current FSI methods include pressure interpolation and force equivalence distribution. Pressure interpolation methods, such as inverse distance weighting (IDW) [9], infinite plate spline (IPS) [10, 11], Kriging [12, 13], constant-volume tetrahedron [14], inverse isoparametric mapping (IIM) [15], and the lattice Boltzmann method for microscale flows [16], require close matching of aerodynamic and structural meshes to avoid large errors. Force equivalence distribution methods, on the other hand, transfer aerodynamic loads to the structural FE model’s grids, ensuring overall force and moment equivalence. This method utilizes the Lagrange multiplier approach to distribute aerodynamic loads according to the minimum deformation energy of hypothetical cantilever beams. However, the method may encounter division by zero when the aerodynamic grid is near the target point. Gao et al. [17] addressed this issue by introducing a hypothetical spring in their force equivalence distribution method based on a spring–beam system.
The gap element, a nonlinear element in FE analysis software [18], effectively models the nonlinear mechanical properties at contact points, with mechanical parameters varying significantly based on the distance between endpoints. Over the years, gap elements have become widely used in interface analysis [19–22] due to their accuracy and simplicity compared to iterative methods for rod elements. Bibel et al. [23] demonstrated the effectiveness of his research on contact algorithms for spiral bevel gears by comparing results obtained using gap element analysis.
In summary, the design and function of flap systems are critical to overall aircraft performance and safety. While existing research covers flap design optimization, aerodynamic load simulations, and structural vibration analyses, there is limited focus on vibration issues specifically caused by flap clearances. Moreover, most studies emphasize theoretical and simulation analyses, with insufficient discussion on experimental validation and practical applications. This study aims to address this gap, particularly in terms of experimental data and real flight tests. By combining computational fluid dynamics (CFD) with structural dynamic models, this research extensively investigates the dynamic response of flaps with clearances. Ground test data ensures the accuracy and reliability of the entire aircraft model. Additionally, the study shows how adjusting the stiffness of gap elements can effectively reduce vibrations caused by clearances, offering new strategies for aircraft design and maintenance. This research focuses on cabin responses induced by aerodynamic loads on the flaps of a specific regional aircraft model with clearances, providing not only new insights for aeronautical engineering but also practical guidance for flap design and aircraft maintenance, particularly in enhancing the aircraft’s vibration environment through structural adjustments. Future research could explore the effects of flap clearances on aircraft performance under various flight conditions and across a broader range of aircraft types and operating environments to develop more effective solutions.
The structure of the paper is organized as follows: Section 2 introduces the time–domain method for converting aerodynamic loads to structural loads based on the spring–beam model. Section 3 describes the flap structure, flap model, and overall aircraft dynamic model. Section 4 presents the aerodynamic calculations for the flaps, the results of flap constraint forces, and the overall aircraft response analysis.
2. Conversion of Aerodynamic Load to Structural Model Load in Time–Domain
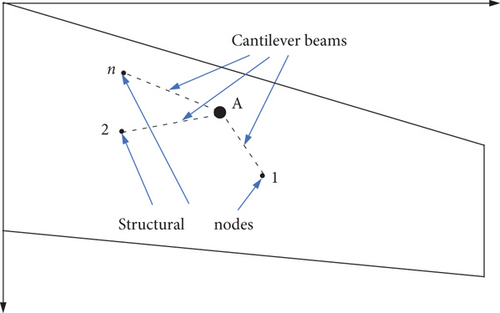
Aerodynamic loads were computed using CFD Fluent software, which provided data on element pressure, element area, and the projected areas of elements in three directions. Given the dense aerodynamic mesh and large volume of data, it is necessary to reliably convert aerodynamic loads into structural loads. Traditionally, a method based on the beam model is used for this conversion process, as outlined below [24], being widely used in aircraft designation. Initially, aerodynamic loads and coordinates are integrated over the aerodynamic mesh to derive concentrated forces on the grid of the CFD model. A set of hypothetical cantilever beams is assumed to connect the FE nodes and Aerodynamic Grid A, transferring the aerodynamic load to the structural nodes, as illustrated in Figure 1.
However, if the aerodynamic grid aligns exactly with a structural node, some denominators may become 0. To address this issue, the model is improved by introducing a spring with stiffness k between the base of the cantilever and its foundation, as shown in Figure 2. This model can also guarantee the overall force transfer.

Solving this system gives the loads distributed to each FE node Pj.
3. Modeling of Flap Structure With Track Gaps
3.1. Configuration of Flap Structure
The configuration of the actual flap structure is shown in Figure 3. The flap is connected to the fuselage by two rock arms at the outer end and a main track at the inner end, supported by four rollers. The gap is assumed to occur between the roller and the main track.
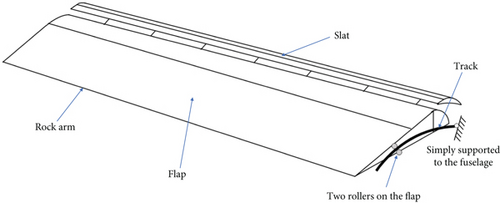
The FE model of this flap was set up, as shown in Figure 4. Constraints are applied based on the connection style between the flap and the wing, with constraints placed at eight points on the lower left side of the flap model and two constraints on the right side. The constraint closest to the wing root on the right side was simulated by gap elements—a special one-dimensional element in NASTRAN used for modeling nonlinear contact between two points.
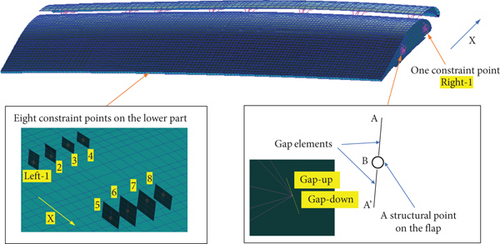
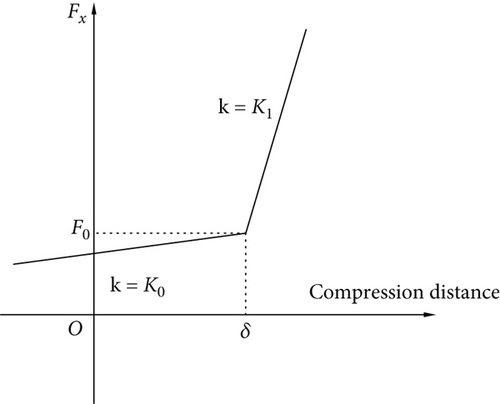
A schematic diagram of gap element is shown in Figure 5. Gap elements require setting two contact points, PA and PB, with an initial gap δ, precontact normal stiffness K0 (which can be set to 0), and postcontact normal stiffness Kl. The gap element endpoints PA and PB are connected on either side of the contact area. Under normal force Fx, PA and PB undergo normal displacements xa and xb, respectively. When the displacement difference (xa − xb) is less than the gap δ, the normal stiffness of the gap element is K0. Once the gap is closed by displacements exceeding δ, the points effectively connect through a spring of stiffness Kl, referred to as the closed stiffness of the gap element.
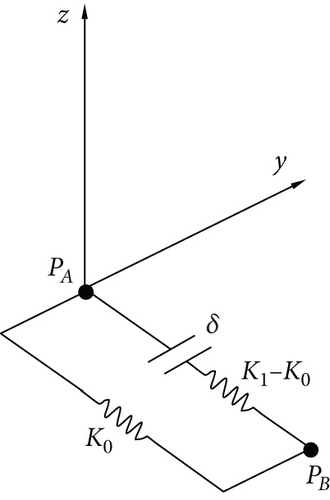
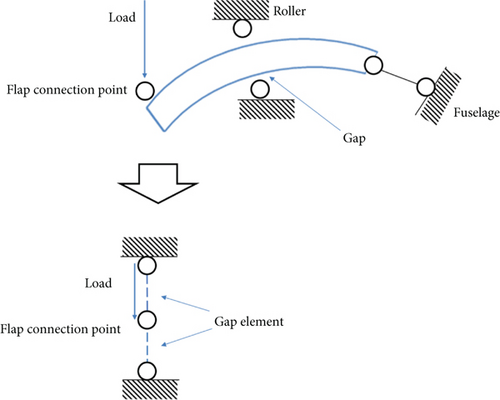
A schematic diagram for calculating gap stiffness is shown in Figure 6. To determine the postcontact spring stiffness Kl, combined with the entire aircraft model, flap constraints and stiffness anomalies are analyzed through FE analysis, which is introduced in the next subsection.
3.2. Modeling of Gap Stiffness
The internal motion mechanism of the flap was simulated with two gap elements. The relative stiffness of the flap connection area and the gap are required. When contact does not occur, the element stiffness is K0; upon contact, the stiffness becomes Kl. The force transmission mechanism of the flap structure suggests that Kl represents the stiffness between the support point and the fuselage, including components such as rollers and tracks. Therefore, these parts are analyzed. The force transmission diagram between the right end of the flap and the fuselage is illustrated in Figure 3. The track base is connected to the fuselage in the extension state, and it contacts the roller, which is also connected to the fuselage. If a gap exists, the load from the flap will cause the connection points to move, with the displacement approximately equaling twice the gap width assigned to the gap element. Once the gap closes, the roller will also transmit load to the fuselage. Since the roller stiffness is significantly higher compared to the stiffness from the track to the fuselage, it is ignored in the overall stiffness calculation, focusing only on the track’s stiffness.
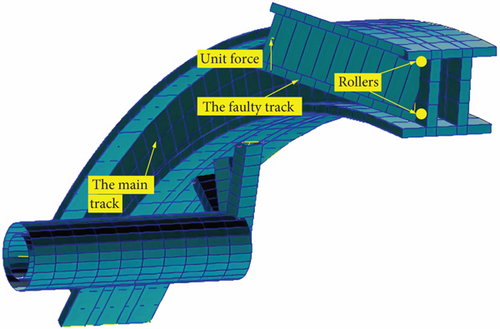
A detailed FE model of the internal mechanisms of the flap, including a main track connecting the flap with the fuselage, a faulty track, and rollers between which gaps occurred, was established as shown in Figure 7. For this modeling, specific material properties were used for the various components, as detailed in Table 1. A unit load was applied at the tip of the faulty track, and the displacement of it was measured, including the deflection of the faulty track and the local deformation of the rollers. The gap element stiffness Kl was finally determined to be 1446 N/mm.
| Mechanism parts | Material |
|---|---|
| Roller | 1Cr17Ni2 |
| Track | Ti-6Al-4 V |
| Connection between track and drive rod | 4140/300 M |
| Connection between track and flap end | 7050-T7451 |
Once the stiffness was established, the time history of constraint force was computed with the external unsteady load. The constraint loads were then applied to the points where the flap connects with the wing in the full aircraft model as external load to calculate the fuselage response.
This approach in modeling closely simulates the structural dynamics and interactions at the critical junctures of the aircraft’s flap mechanism, ensuring that the responses under various load conditions can be effectively analyzed and evaluated for structural integrity issues.
3.3. Aircraft Structural Dynamics Model
A full structural dynamics modal of the aircraft was established for response analysis and modal adjustment. The aircraft adopts a low-wing and high-mounted tailplane configuration. A schematic of the entire aircraft is shown in Figure 8, with the positions of the engines and winglets indicated. In the modeling process, the engine and winglets are represented as concentrated masses.

Except for the first six rigid body motion modes, all modes below 31 Hz matched ground test results, suggesting that the refined model accurately reflects the dynamics up to 31 Hz. Part of the modes are listed in Table 2.
| Mode No. | Mode description | Modal frequency (Hz) |
|---|---|---|
| 9 | Antisymmetric horizontal vibration of wing | 7 |
| 10 | First horizontal bending mode of fuselage | 8 |
| 11 | First vertical bending mode of fuselage | 9 |
| 12 | Symmetric horizontal vibration of wing | 9 |
| 13 | Second symmetric bending mode of wing | 10 |
| 14 | In-plane mode of vertical tail | 12 |
| 15 | Second antisymmetric bending mode of wing | 12 |
| 16 | Pitch of left engine | 17 |
| 17 | First antisymmetric bending mode of winglet | 18 |
| 18 | First symmetric bending mode of winglet | 18 |
| 19 | Pitch of right engine | 18 |
| 20 | First antisymmetric torsional mode of wing | 20 |
| 21 | Second antisymmetric bending mode of horizontal tail | 20 |
| 22 | First symmetric torsional mode of wing | 20 |
| 23 | Torsional mode of fuselage | 20 |
| 24 | Second vertical bending mode of fuselage | 24 |
| 25 | Second symmetric bending mode of horizontal tail | 25 |
| 26 | First antisymmetric torsional mode of horizontal tail | 28 |
4. Aircraft Response Analysis Under Anomalous Flap Stiffness
4.1. Aerodynamic Analysis of the Flap Using CFD
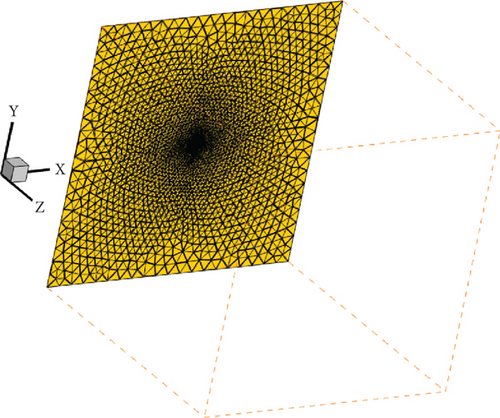
An aerodynamic model of wing with extended flaps was established based on its geometric model, encompassing the entire wing and the air surrounding it. The aerodynamic characteristics of the wing were computed using CFD software, Fluent 17.2. The flap under study, shown within the flow domain, was meshed using a boundary layer and unstructured mesh as illustrated in Figure 9.

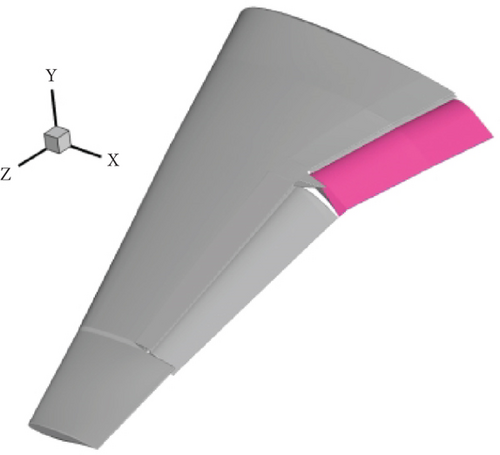
The aerodynamic characteristics of the wing with extended flaps were computed using CFD software, Fluent 17.2. The flap under study, shown within the flow domain, was meshed using a boundary layer and unstructured mesh. The cell number of the mesh was 13310191. The growth rate of boundary layer mesh was 1.15. The number of layers of boundary layer mesh was 15. The boundary of the flow field, which was 50 times of the wingspan, was from −500 to 500 m in the X-direction, from −500 to 500 m in the Y-direction, and from −2.2 to 997.8 m in the Z-direction. The flow field boundary diagram is shown in Figure 10.
For steady-state calculations, the Spalart–Allmaras turbulence model was employed, while unsteady calculations utilized the detached eddy simulation (DES) model. Inflow conditions were set with a velocity of 100 m/s, a density of 1.225 kg/m3, and an angle of attack of 0°. The time step was set as 0.667 ms. The resultant aerodynamic pressure on the wing in different directions is depicted in Figure 11.
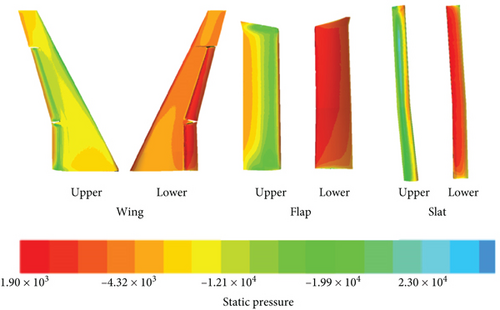
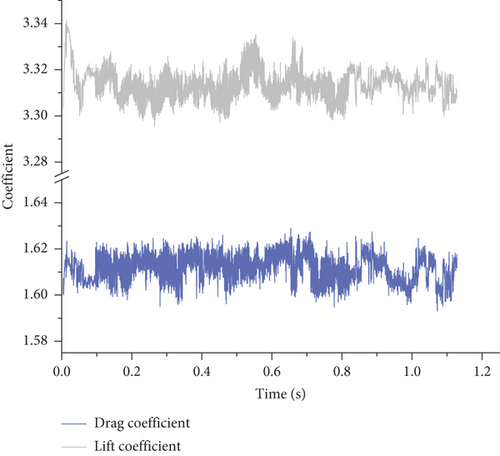
Static pressure contours extracted for the flap and slat illustrate the variations in lift and drag forces experienced by these components, with fluctuations of 2.5% in drag coefficient ranging from 1.59 to 1.63 and 1.2% in lift coefficient ranging from 3.3 to 3.34, as shown in Figure 12.
4.2. Load Transforming Process
For each structural point, Equation (13) is applied to calculate the force contribution Paxj and Pazj from each aerodynamic point to the corresponding structural point in the X-direction. Similarly, the force Paz for each structural point is calculated.
For each aerodynamic force at a certain time step, after repeating the load transformation process, the forces at each structural point obtained from each transformation are summed to determine the total force on the structural points at that time step. After repeating such process for each time step, aerodynamic forces computed across 67,818 points and 1446 time steps over a total duration of 0.6 s were translated to 64 structural nodes on the flap. The comparison of the resultant Z-direction structural loads with those calculated based on lift coefficients showed a maximum discrepancy of 0.62%, validating the effectiveness of the conversion method.
4.3. Constraint Forces and Overall Aircraft Response Analysis
To assess the impact of varying gap sizes on the overall aircraft response, gap sizes were set at 0.001 (simulating the no-gap situation), 1, 3, 5, and 10 mm. The transformation of aerodynamic forces to structural nodes on the flap was conducted using Equations (9) provided in Section 2. The time histories of constraint force at these constrained nodes on the flap are shown in Figure 13.

As the gap width increased, the nature and magnitude of the constraint forces provided by the gap elements envolved, demonstrating a decrease in maximum constraint force and a gradual reduction in peak frequencies to near-zero levels as the gap width reached 10 mm. This transition results in a change from a full-cycle to a half-cycle reaction force form at a gap width of 3 mm, eventually becoming more pulse-like with further increases, as detailed in Figure 14.
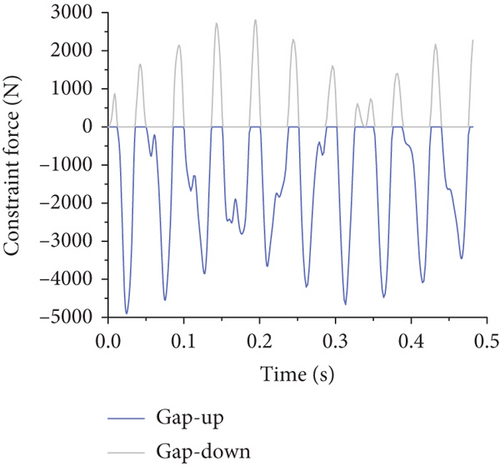
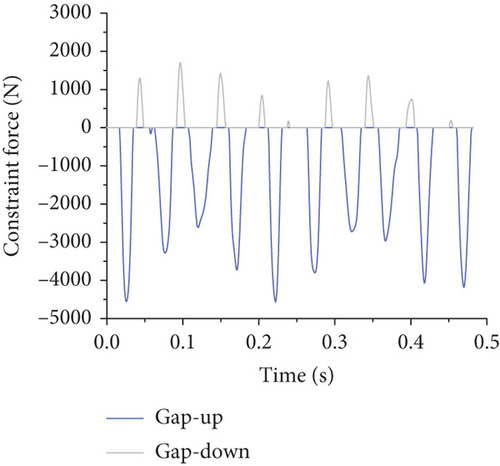
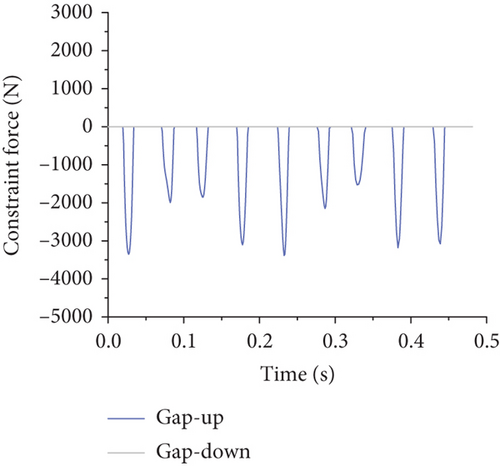
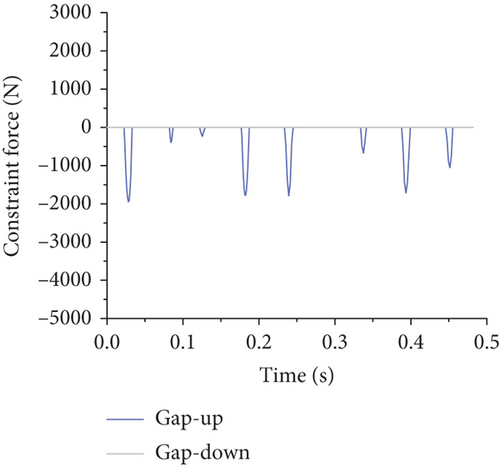
Based on Figure 14, it is evident that when the gap width is 1 mm, both the upper and lower gaps provide restraining forces. With gap widths of 3 and 5 mm, only the upper gap provides a restraining force. At a gap width of 10 mm, neither the upper nor lower gaps provide restraining forces. As the gap width increases, the maximum restraining force decreases, thereby increasing restraining forces at other connection increase. Additionally, as the gap width increases, the frequency of the restraining force caused by the gap element gradually reduces, with some peak values diminishing to near-zero levels. Furthermore, as the flap gap increases, the form of the reaction force at the flap gap changes: When the flap gap reaches 3 mm, the reaction force at the flap gap transitions from a full-cycle form to a half-cycle form, and with further increase in gap, the reaction force becomes sharper, resembling more of an impulse load.
4.4. Aircraft Response Analysis
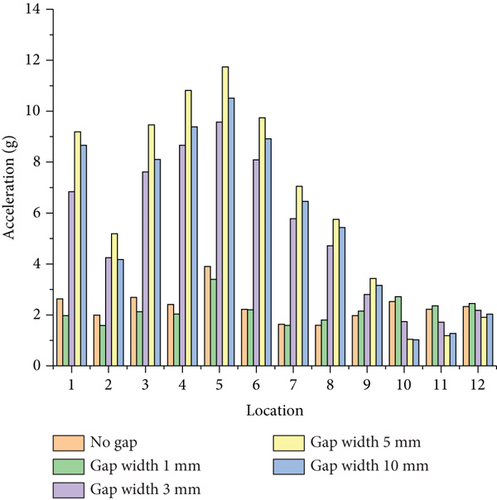
The reaction force at the constraint point on the left side of the flap is transferred to the corresponding connection location in the full aircraft model. In the aircraft model, a right front-side constraint point and upper and lower constraint points on the gap unit are created. These three points are connected to the spars and ribs of the wing structure via rigid elements, and restraining forces are applied to them. Based on the ground test results, damping was set at 0.02 for the full aircraft dynamics analysis. Detection points were placed at 12 locations in the cockpit and seat rails of the cabin floor, as shown in Figure 15. The response in three directions at these locations was measured with the root mean square (RMS) of acceleration, as depicted in Figures 16, 17, and 18.

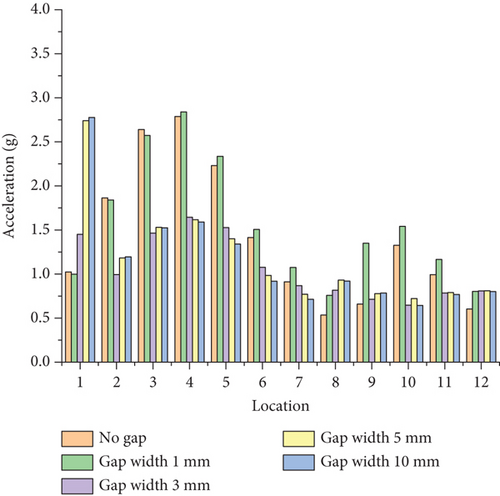
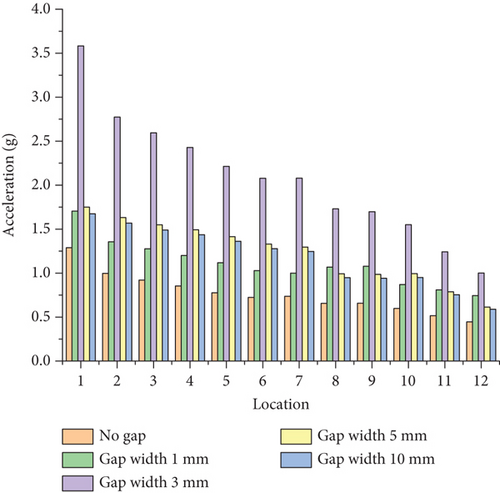
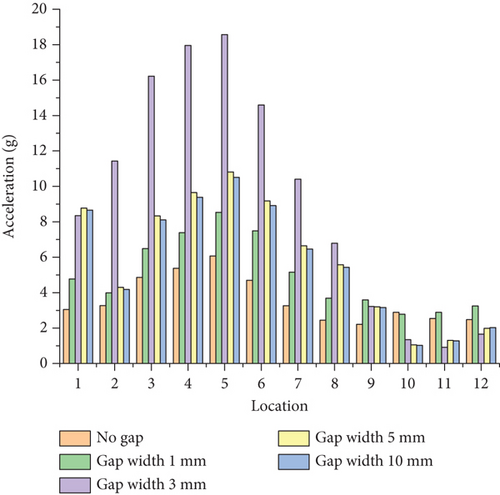
From Figures 16, 17, and 18, it is observed that the RMS of acceleration in the Z-direction is greater than that in the X- and Y-directions. This is due to the aerodynamic forces on the flap being greater in the Z-direction, resulting in larger Z-direction forces being transmitted to the entire aircraft. The RMS acceleration at the detection points in the middle and rear sections of the cabin is greater than in other areas.
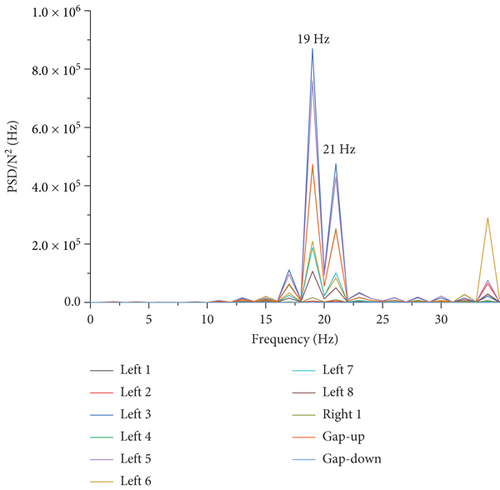
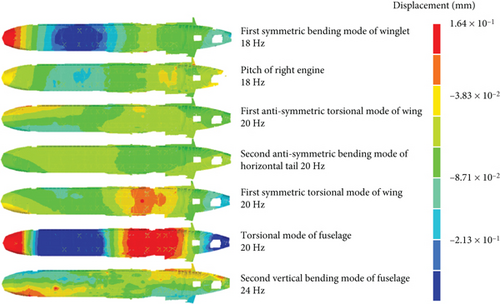
The response in the rear half of the fuselage is smaller than in the fore half. This phenomenon can be explained by modal analysis. Considering that the primary component is around 19 and 21 Hz, as shown in Figure 19, the following modes around 19 and 21 Hz were extracted from the full aircraft model: first symmetric bending mode of winglet (18 Hz), pitch of right engine (18 Hz), first antisymmetric torsional mode of wing (20 Hz), second antisymmetric bending mode of horizontal tail (20 Hz), first symmetric torsional mode of wing (20 Hz), torsional mode of fuselage (20 Hz), and second vertical bending mode of fuselage (24 Hz). The mode shapes and their upper and lower bounds are shown in Figure 20.
To compare the effects of different contact stiffnesses on the cabin response, the cabin response with a gap stiffness Kl of 2892 N/mm was calculated, as shown in Figure 21.The RMS acceleration inside the cabin is less than 1446 N/mm. Increasing the track stiffness reduces the movability of the dynamic system, thereby decreasing the cabin acceleration under the same gap size conditions.
5. Conclusion
- a.
As the gap width increased, the form and magnitude of the constraint forces at the flap gaps changed, showing a transition from full-cycle to half-cycle forms.
- b.
The largest cabin Z-direction RMS accelerations occurred at a 3-mm gap. The location of the largest acceleration for a 3-mm gap differs from the conditions with no gap and a 1-mm gap.
- c.
Higher responses were observed in the fore half of the fuselage due to the modal superposition of frequencies close to those of the flap support forces.
- d.
Increasing the gap stiffness results in a decrease in the maximum response, confirming that using a stiffer track system configuration can help reduce abnormal vibrations inside the cabin.
Conflicts of Interest
The authors declare no conflicts of interest.
Funding
All authors sincerely thank the National Natural Science Foundation of China (No. 12072199) for its support.
Open Research
Data Availability Statement
Data sets generated during the current study are available from the corresponding author upon reasonable request.


