Adaptive Feedforward Vibration Control of Helicopter Cabin Floor Driven by Piezoelectric Stack Actuators: Modeling, Simulation and Experiments
Abstract
Active control of structural response is the most practical and effective approach to mitigate helicopter vibration and enhance ride quality. In this paper, adaptive feedforward vibration control is constructed for the helicopter cabin floor driven by piezoelectric stack actuators (PSAs). A scale helicopter airframe model, preserving the local geometric similarity of the cabin floor structure, is developed and optimized to capture the low-order global dynamic characteristics of a reference airframe. The model of PSA is integrated into the attached beam element based on the conditions of force equilibrium and displacement compatibility, and adaptive feedforward control is implemented by the filtered-x least mean square (Fx-LMS) algorithm. Simulations and experimental studies under diverse excitations have been carried out. Results indicate that the adaptive PSA-driven ride quality improvement system can effectively reduce the cabin floor vibration, and the responses under multidirection excitations can also be reduced by more than 90%. It is also observed that the responses at different control points exhibit inconsistent convergence due to the interference of modes under multidirection excitations.
1. Introduction
Vibration is a key factor for comfort evaluation of an aircraft [1, 2]. Reducing helicopter vibration continues to be an area of intense interest in helicopter dynamics [3]. Owing to its better control effectiveness than passive devices, active vibration control has become the most practical and effective technology to reduce helicopter vibration [4]. Active control of structural response (ACSR), with actuators positioned in the airframe structure, presents a lot of advantages such as better control effectiveness, greater reliability, and lower power consumption [5, 6]. The power consumption of airframe-based ACSR has been estimated at an order of magnitude lower than the rotor-based higher harmonic control (HHC) system [7, 8]. Several studies about the actuator, control law, modeling technology, and model experiment have been carried out to improve the control performance. ACSR, using inertial actuators, has been extensively investigated and extended to the compound helicopter [9, 10].
Piezoelectric stack actuator, thanks to its lightweight, high efficiency, and wide operating frequency range, has become an attractive actuator in active vibration control of aerospace structure [11] and has been comprehensively reviewed in a recent reference [12]. To improve the drive efficiency, a novel concept of piezoelectric actuator, named offset piezoelectric stack actuator (OPSA) is proposed and tested [13, 14]. The optimal offset distance can be determined by the criterions of the stiffness matching [13] or modal damping ratio [15]. This actuation concept has been investigated for vibration control of the aircraft [16] and space structures [15, 17]. The piezoelectric actuator can overcome the weight penalty problem of inertia actuators. It is also suitable for multiharmonic vibration control and the rotational speed change of the rotor. Hanagud and Badu [18] investigated the feasibility of using piezoelectric actuators in active vibration control of a helicopter airframe. A single-input–single-output (SISO) control for a beam model is constructed, and simulation results show that the vibration response at the control point was reduced by 60%. Friedmann and Millott [6, 19, 20] numerically investigated the placement influence and control ability of the PSAs in active helicopter vibration control using a reduced-order elastic linear finite element airframe model. They also conducted experimental studies on a cantilever tail beam model by installing the piezoelectric stack actuators at its clamped end. Results indicate that the PSA could be effectively used for reducing helicopter vibration, and the distributed actuation strategy has a stronger ability of vibration suppression and requires less control power than a centralized actuation configuration around the gearbox. Song and Xia [21] proposed a harmonic synchronous identification-updating method for active control of helicopter structural response, and experiments were conducted on a free–free beam driven by PSAs. Meng et al. [22] modeled the cabin floor structure as a cantilever frame structure. Simulations of the multi-input–multioutput–multiharmonic (MIMOMH) feedforward vibration control were carried out on this model. Singhvi and Vennkatesan [23] conducted a conceptual research in which the PSA was installed between the gearbox and airframe based on a highly simplified two degrees of freedom model, and the control performance was examined by simulation. Further, based on the rigid model assumption of the rotor/gearbox and airframe, Lang and Xia [24] constructed a vibration control model consisting of the rotor/gearbox, airframe, and four active struts driven by PSAs, and the control performance was examined by simulations.
Owing to the available frequency information of the helicopter vibration, the frequency-domain control algorithm and frequency-shaping control have been used for helicopter vibration control. The HHC algorithm, a frequency-domain control method, using discrete Fourier transform (DFT) has been effectively used in active helicopter vibration control [25]. In order to overcome the shortcomings of the DFT-based frequency-domain control method, Song and Xia [21] proposed the harmonic synchronous identification-updating method by harmonic coefficient identification, and then, this method was extended to the adaptive hybrid control of helicopter vibration [24]. Time-domain feedback control methods such as the H∞ control [18], feedback control based on the internal model principle [26], and linear quadratic feedback control [27] have been redesigned by the frequency-shaping methodology for helicopter vibration control studies. The partial pole placement based on the receptance method has been tentatively used for helicopter vibration control [28]. The filtered-x least mean square (LMS), an adaptive time-domain filtering algorithm, is effectively used in active noise and vibration control when the reference signals are easy to obtain [29, 30]. For the helicopter vibration control, the revolution speed transducer of the rotor facilitates the acquirement of the reference signal, so the adaptive feedforward control based on filtered-x LMS is employed to construct the helicopter vibration control system.
In this paper, adaptive feedforward vibration control of helicopter cabin floor driven by piezoelectric stack actuators has been constructed. A scale airframe model is developed based on a reference helicopter. The scale model, preserving the local geometric similarity of the cabin floor structure, is optimized to capture the low-order global dynamic characteristics of the reference airframe, and then, the modal test is conducted to verify its dynamic characteristics. The concept of OPSA is employed, and the PSA is parallelly integrated into the structural beam though through rigid brackets. Adaptive feedforward control is implemented by the filtered-x LMS algorithm, and the simulation and experiment system have been constructed. Simulations and experimental studies under different excitations are carried out to investigate the effectiveness and performance of the constructed active vibration control system.
2. Scaled Airframe Structure
A scale airframe model characterized by dynamic similarity is an effective equipment to assess the vibration control performance. A laboratory dynamic similarity model used to design and evaluate the active control system should not be overly complex nor expensive to produce. However, it should be sophisticated enough to preserve the low-order global dynamic characteristics of the reference structure. It also has a local geometric similarity to the cabin floor, which means the locations of the sensors and actuators on the scale model can match the layout of the active vibration control system for the reference helicopter.
2.1. Scaled Modeling of an Airframe Structure

| Number | Position | Direction | Optimal values (mm, kg) |
|---|---|---|---|
| 1 | Lower cabin floor | y | 6 × 10 |
| 2 | Lower cabin floor | z | 14 × 2 |
| 3 | Lower cabin floor (outside) | x | 10 × 16 |
| 4 | Lower cabin floor (inside) | x | 10 × 2 |
| 5 | Upper cabin floor | y | 12 × 2 |
| 6 | Upper cabin floor | z | 18 × 8 |
| 7 | Upper cabin floor (outside) | x | 12 × 6 |
| 8 | Upper cabin floor (inside) | x | 18 × 20 |
| 9 | Lower cabin floor | y | 4 × 6 |
| 10 | Lower cabin floor | z | 18 × 16 |
| 11 | Connection between upper and lower cabin floor | z | 12 × 10 |
| 12 | Middle airframe | / | 20 × 40 |
| 13 | Intermediate airframe | / | 35 × 45 |
| 14 | Tail beam | x | 40 × 40 |
| 15 | Oblique tail beam | / | 35 × 30 |
| 16~20 | Concentrated masses from the nose of airframe to the back | / | 0, 1.3, 0.5, 0, 1.2 |
Low-order mode is an important factor of the dynamic analysis. Relative to the high-order modes, the low-order modes are required to achieve higher dependability in the design of helicopter airframe structure. On the other hand, a laboratory scale model is difficult to simultaneously capture the low-order and high-order reference modes due to the structural simplification and manufacturing costs. Referring to the literature [32], the first four modes are selected to be optimized for the dynamical similarity. The reference frequencies are extracted from the ground vibration tests of a helicopter, and the mode shapes used for calculating MACi are the modal displacements (excluding the rotational degrees of freedom) at the measure points along the airframe. The optimal parameter values are shown in Table 1. The modal parameters of the optimized model and reference modes are shown in Table 2. The material is steel with elastic modulus E = 2.09 × 10¹¹ Pa, density ρ = 7890 kg/m3, and Poisson’s ratio μ = 0.27. It can be seen that the maximum error of the natural frequency between the optimized scale model and reference airframe is 3.13%, and all the MACi are greater than 0.92.
| Modes | Calculated (Hz) | Reference (Hz) | Error | MAC |
|---|---|---|---|---|
| First (vertical bending) | 10.06 | 9.75 | 3.13% | 0.97 |
| Second (lateral bending) | 10.15 | 10.18 | 0.28% | 0.98 |
| Third (vertical bending) | 16.76 | 16.86 | 0.62% | 0.97 |
| Fourth (lateral bending) | 18.46 | 18.96 | 2.61% | 0.92 |
2.2. Dynamic Test of the Scale Model
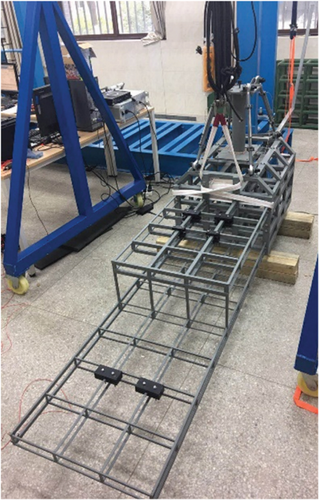
The physical model is fabricated and is shown in Figure 2a. During the test, the model is suspended to simulate a free–free boundary condition. The suspension frequency is 2.93 Hz, and the ratio of the suspension frequency to the first elastic frequency is less than 1/3, which is a practicable criterion in the sense of engineering [33, 34]. The schematic diagram of the test system is shown in Figure 2b, and the distributed dots indicate the layout of the measuring points. The modal test and analysis are performed by the LMS test. The lab system is operating in the mode of the impact hammer test method. The modal parameters of the physical model versus reference are shown in Table 3, and the mode shapes are shown in Figure 3. It can be seen that the dynamic characteristics of the fabricated model are in good agreement with the reference modes except for the third natural frequency. Fortunately, the control frequency of 25.5 Hz is a considerable distance away from the third mode frequency of 19.07 Hz. The steady-state harmonic response at 25.5 Hz is less affected by the low-damping structure. The transient response due to the closer natural frequency has an adverse effect on steady-state harmonic control, especially on the convergence characteristics. Compared with the calculated results, experimental modes have a little greater error. Considering the dynamic similarity characteristic and severe vibration environment of the manufactured scale model, it can be used to evaluate the control performance of the proposed control system in the sense of laboratory tests.

| Modes | Experimental (Hz) | Reference (Hz) | Error | MAC |
|---|---|---|---|---|
| First (vertical bending) | 9.90 | 9.75 | 1.54% | 0.90 |
| Second (lateral bending) | 9.98 | 10.18 | 1.97% | 0.91 |
| Third (vertical bending) | 19.07 | 16.86 | 13.11% | 0.96 |
| Fourth (lateral bending) | 18.05 | 18.96 | 4.8% | 0.95 |


3. Adaptive Feedforward Cabin Floor Vibration Control Driven by Piezoelectric Stack Actuators
Piezoelectric stack actuator is made of multilayer piezoceramic disks mechanically in series and electrically in parallel. It can produce large force and displacement outputs under low voltage input (0~150 V) and has become an effective and practical actuator in active control of aerospace structure.
3.1. PSA–Structure Coupling Model
In this research, the concept of OPSA is employed in that the PSA is installed parallel to the beam through rigid brackets and is connected to a flexible hinge to avoid a large moment exerting on itself. The advantages of OPSA are summarized in Ref. [15]. The schematic diagram and its prototype are shown in Figure 4. δ is the offset distance of the piezoelectric stack actuator to the neutral axis of the attached beam and is optimized by the criterions of the stiffness matching to maximize the control ability [13]. The coupled model of the PSA and beam is constructed based on the conditions of force equilibrium and displacement compatibility at the connected points.
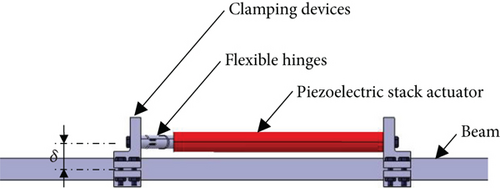

It can be seen from Equation (8) that the resultant control force exerted by PSA depends on not only the control voltage but also the displacement response at the driving point. The power output of PSA is discussed in detail in Reference [35]. The optimal power output of PSA is determined by the stiffness matching principle Kpzt = Kstr(ω). Kstr(ω) is the dynamic stiffness of the actuation point at control frequency ω. This stiffness-matched principle can be achieved by distributed multi-PSAs around the structure.
In engineering application, a practical actuation concept for an actual helicopter structure could be the formulation of an active PSA-driven frame member to replace an existing passive frame member of the airframe. The active frame member would generate a force and displacement distribution around its perimeter. The control forces can be also applied at the intersection of stringers and adjacent frame members by multi-PSAs. Active struts driven by distributed multi-PSAs have been employed to reduce the dynamic loads of the main gearbox for interior noise control, and control performance is demonstrated by the flight tests [36].
3.2. Adaptive Feedforward Control Based on Filtered-x LMS
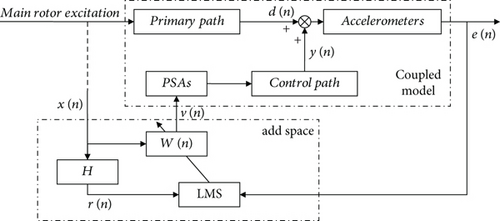
The adaptive control process can be summarized as follows: The weight coefficients of the adaptive controller are initialized firstly (usually W(0) = 0). The gradient of the cost function J is calculated by the filtered-x signal rij(n) and sampled control error signals e(n) at time n, and the next-step weight coefficients wj(n + 1) are updated by recursive Formula (17). And then, the control voltage vj(n + 1) for the jth actuator is calculated by Formula (15). The stability of the filtered-x LMS and the effects of secondary path modeling errors on this algorithm have been investigated extensively [37]. Errors in the magnitude of the secondary path will alter the maximum stable value of step-size μ through an inverse proportional relationship. In other words, there is a step-sizeμthat made this algorithm stable, provided the error in the estimation of the phase of the secondary path does not exceed 90°. Comprehensive summaries can be found in Ref. [38].
4. Simulations of Adaptive Feedforward Cabin Floor Vibration Control
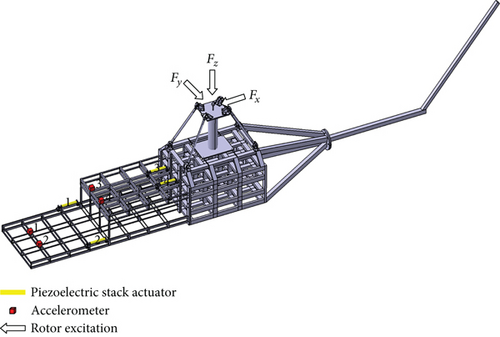
Reducing the vibration level of the cabin floor is the most important to improve ride quality. Four positions on the cabin floor are selected as control points, and the locations of PSAs are determined through optimization. The layout of accelerometers and PSAs is shown in Figure 6. The PSA used in simulation is PSt150/10/160VS15, a mechanical packaged piezoelectric stack actuator. The parameters of the PSt150/10/160VS15 and its offset distance δ are listed in Table 4. Normally, the vibration caused by the main rotor at blade passing frequency NΩ (N =5 is the number of blades, and Ω = 306 rpm is the rotational speed) is the control objective. The forces Fx, Fy, and Fz are applied to the hub to simulate the rotor vibratory loads. The excitation frequency is the blade passing frequency NΩ = 25.5 Hz of the reference helicopter. Simulations with different excitations are carried out. In simulations, the control system turns on 5 s after the excitation is applied. The sampling frequency is 1000 Hz.
| Parameters (units) | Values |
|---|---|
| Free displacement (μm) | 152 |
| Block force (N) | 2300 |
| Stiffness (N/m) | 13 × 106 |
| First natural frequency (Hz) | 6000 |
| Working voltage range (V) | −30~150 |
| Length (mm) | 154 |
| Mass (g) | 130 |
| Offset distance (δ/mm) | 20 |
4.1. Simulation Under Single Vertical Excitation
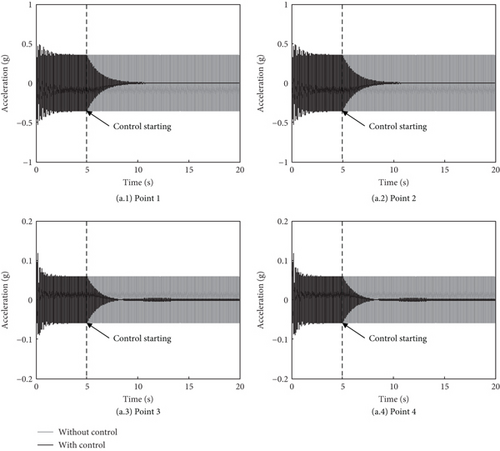
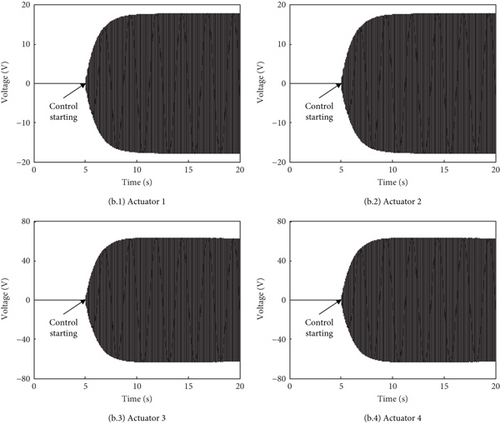
Simulation under a single vertical force Fz = 300 sin (2π·25.5 t N is carried out firstly to investigate the effectiveness of the constructed active control system. The amplitude of Fz is determined by the vibratory environment similarity on the cabin floor between the scale model and reference helicopter. In simulation, the vertical accelerations of the four control points are selected to be controlled. The maximum amplitude at the control points achieves 0.35 g under the excitation Fz. The adaptive feedforward control turns on at 5 s after the excitation is applied. The acceleration responses with and without control are shown in Figure 7a, and the associated control voltages of the PSAs are given in Figure 7b. It can be seen that when the control reaches a steady state, the amplitudes at Points 1, 2, 3, and 4 decrease by 99%, 99%, 96%, and 96%, respectively. All the responses decay more than 80% in 1.5 s. The control voltage amplitudes of the four PSAs are about 18, 18, 63, and 63, respectively.
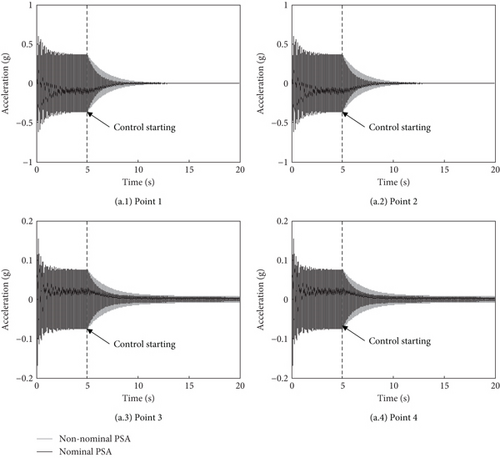
In order to assess the influence of the nonnominal behavior in the actuator, a simulation with half-drive ability is conducted. Figure 8 shows the comparative analysis with nominal and nonnominal PSAs. It can be seen that both simulations are stable and the convergence rate with nominal PSAs faster than nonnominal PSAs. It is worth noting that although the nonnominal behavior used in simulation is only a theoretical possibility and there are more possibilities in engineering applications, robustness is an important characteristic of the filtered-x LMS algorithm [33].
4.2. Simulation Under Three-Directional Excitations
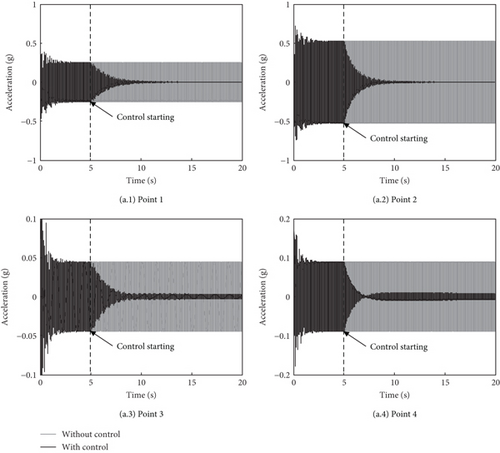
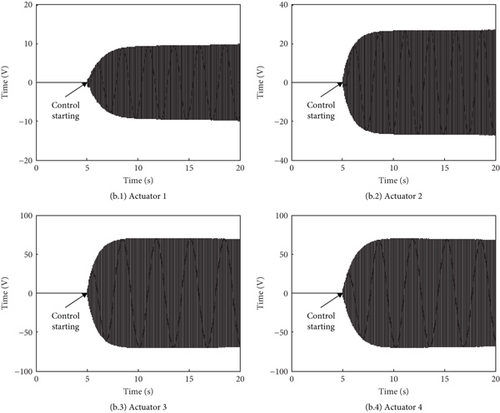
The three-directional forces Fx, Fy, and Fz are Fx = 100 sin (2π·25.5 t N, Fy = 100 sin (2π · 25.5 t + π/2 N), Fz = 300 sin (2π · 25.5 t + π/2 N). These excitations are set based on the ratio of 1/10 of the vertical dynamic load to the thrust (the mass of the model is about 300 kg) as the reference helicopter and then checked by the vibration level of about 0.5 g at the cabin floor. The relative amplitude and phase of the forces Fx and Fy to Fz are determined according to the characteristics of rotor excitations. The amplitudes of the steady-state responses without control at Points 1, 2, 3, and 4 are 0.25, 0.53, 0.045, and 0.09 g, respectively. The adaptive feedforward system turns on at 5 s after the excitations are applied. The acceleration responses with and without control are shown in Figure 9a, and the control voltages of the four PSAs are shown in Figure 9b. It can be seen that after the control reaches a steady state, the amplitudes at Points 1, 2, 3, and 4 decrease by 99%, 99%, 92%, and 94%, respectively, and all the responses decay more than 80% in 2 s. The control voltage amplitudes of the four PSAs are about 10, 27, 70, and 68 V, respectively. Simulation results indicate the excellent performance and convergence speed of the constructed active control system. Compared with the single vertical excitation, it is observed that the convergence rate becomes slightly complex and slower when the responses include more modes. Responses at some points converge faster than others, and responses at some points have an increasing phenomenon in the process of convergence. This inconsistent convergence is caused by the coupling effect of the MIMO control system associated with the condition number of the secondary Path H at the control frequency. And this inconsistent phenomenon becomes more serious as the condition number increases [37]. Due to the symmetrical characteristic, the control system under the vertical excitation essentially runs in a 2-inputs/2-outputs state and the condition number is 14.5. The torsion modes can be excited by the transversal excitation, so the control system under the three-directional excitations runs in a 4-inputs/4-outputs state, and the condition number is 105.6. So the inconsistent convergence is easier to observe with the three-directional excitations.
4.3. Simulation Under Excitation–Changes
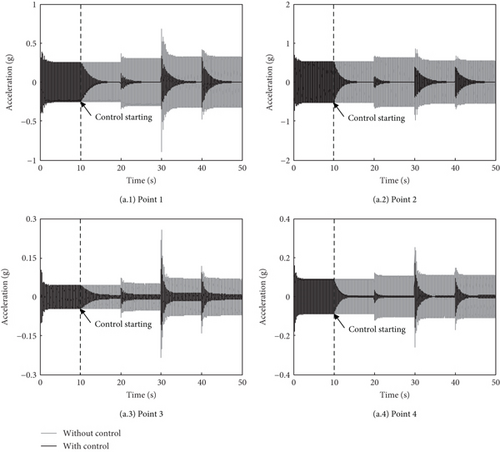
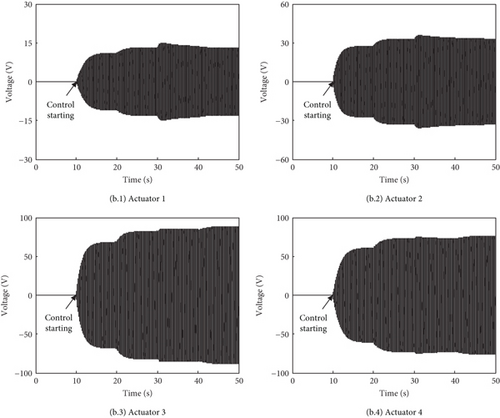
In order to verify the adaptive tracking performance of the constructed active vibration control system, simulations under excitation–change situations are carried out. These changes are implemented by altering the excitation amplitude, frequency, and phase. The initial excitations are the same as those used in Section 4.2; then, the amplitude of excitation increases by 20% at 20 s, the frequency of excitation changes by 5% at 30 s, and the phase of excitation increases by π/6 at 40 s. Figure 10a shows the acceleration responses at measuring Points 1, 2, 3, and 4 under excitation–change situations, and Figure 10b shows the control voltages of the four piezoelectric stack actuators. It can be seen that under the excitations with changes in the amplitude, phase, and frequency, the active control system has an adaptive capability of tracking the changes in excitation. The vibration suppression can achieve more than 80% in 2 s after the excitations change.
5. Experimental Investigations of Adaptive Forward Cabin Floor Vibration Control
Based on the scale airframe model and adaptive feedforward control strategy, an experimental system of active cabin floor vibration control driven by PSAs has been developed. The modal test is carried out to examine the influence on dynamic characteristics of the overall system with PSA installation, and the results are listed in Table 5. The results show that overall modes are scarcely influenced, and the third modal frequency slightly increases due to stiffness contribution. Experiments under different excitations are carried out to investigate the effectiveness and performance of the constructed active vibration control system.
| Modes | With PSAs (Hz) | Without PSAs (Hz) | Error |
|---|---|---|---|
| First (vertical bending) | 9.90 | 9.88 | −0.2% |
| Second (lateral bending) | 9.98 | 10.01 | 0.3% |
| Third (vertical bending) | 19.07 | 19.50 | 2.3% |
| Fourth (lateral bending) | 18.05 | 18.13 | 0.4% |
5.1. Experimental System
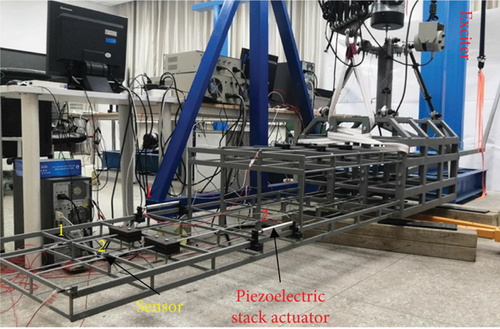
The experimental setup is shown in Figure 11. The control objective is focused on the lower cabin floor where the vibration level is high. The layout of the accelerometers and PSAs is shown in Figure 11. The vibratory loads are applied by electromagnetic exciters. The experimental studies also include two excitation cases: (1) a single vertical force and (2) the combination of the vertical and horizontal forces. The PSA PSt150/10/160VS15 used in the experiment is the same as in the simulation. In the experiments, the control system turns on a few seconds after the excitation is applied, and the sampling frequency is 1000 Hz.
5.2. Experiment Results and Analyses
5.2.1. Experiment Under Single Vertical Excitation
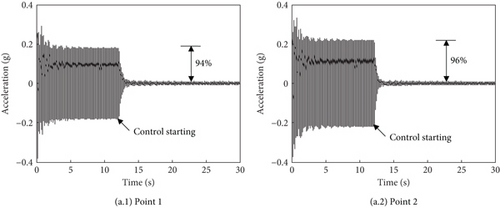
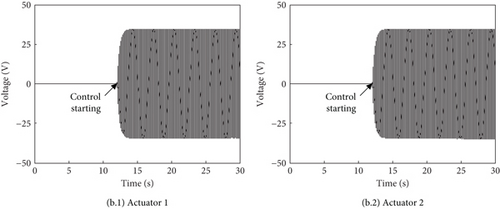
In the experiment, a single vertical force is applied at the hub center, and the excitation frequency is the blade passing frequency NΩ = 25.5 Hz. After the exciting force turns on, the active control system starts at 10 s. Points 1 and 2 on the lower cabin floor are selected to be controlled, and a 2-input–2-output control system is constructed. Figure 12a shows the acceleration responses at the two control points. The responses decrease from about 0.2–0.01 g in less than 1 s and keep stable. The vibration amplitudes at these two points decrease by 94% and 96%, respectively. It can be seen that the constructed active vibration control system driven by PSAs can effectively reduce the cabin floor vibration. When the control objective is focused on the high-vibration region, the responses have a faster convergence rate. The maximum amplitudes of the control voltages are both about 28 V as shown in Figure 12b.
5.2.2. Experiment Under Combined Vertical and Horizontal Excitations
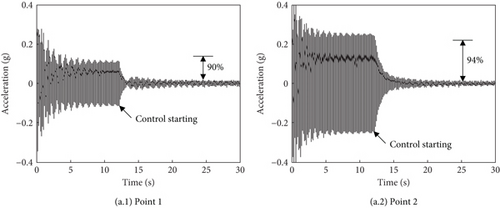
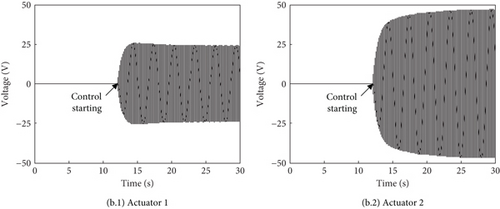
In this experiment, the excitations contain the vertical force and horizontal force. Both forces are applied at the hub center. The horizontal force can excite the torsional and coupled modes of vibration. Figure 13a shows the acceleration responses at the two points, and the vibration of asymmetrical modes is obviously observed. The response at Point 1 decreases by 80% from 0.12 to 0.024 g after 4 s, and the response at Point 2 decreases by 80% from 0.25 to 0.05 g in less than 1 s. Vibrations at these two points decrease by 90% and 94% after converging to a quasisteady state, respectively. It can be seen that the constructed active vibration control system can effectively reduce the cabin floor vibration under the combined vertical and horizontal excitations. Compared with the single vertical excitation, the vibration under the combined excitations has a slightly lower and inconsistent convergence rate. The responses at some points converge faster than others, and responses at some points have an increasing phenomenon in the process of convergence. This phenomenon is also observed in the simulation analysis. The maximum amplitudes of the control voltages are 25 and 47 V, respectively, as shown in Figure 13b.
5.2.3. Experiment Under Excitation–Changes
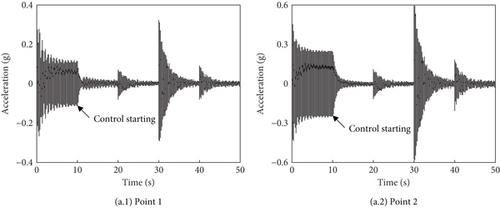
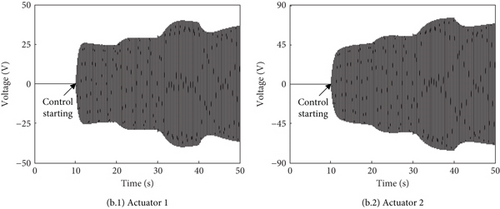
In order to verify the adaptive tracking performance of the constructed active vibration control system experimentally, tests under excitation–change situations are carried out. These changes are implemented similarly by altering the excitation amplitude, frequency, and phase. The initial excitations are the same as those used in the previous Section 5.2, and then, the amplitude of excitation increases by 20% at 20 s, the frequency of excitation changes by 5% at 30s, and the phase of excitation increases by π/6 at 40 s. Figure 14a shows the acceleration responses, and Figure 14b shows the control voltages. It also can be seen that under the excitations with changes in the amplitude, phase, and frequency, the active control system has an adaptive capability of tracking the changes of excitation. The vibration suppression can achieve more than 80% in 3 s after the excitations change, in which the larger transient responses lead to slower convergence than simulation.
6. Conclusions
In this paper, a scale model characterized by the local geometric and low-order global dynamic similarity characteristics is developed; then, the model is fabricated, and modal tests are conducted to verify its similar dynamic characteristics.
Active vibration control of cabin floor structure driven by piezoelectric stack actuators has been constructed for the constructed scale model, and the filtered-x LMS algorithm is employed to construct the simulation and experiment system. Simulations and experimental studies under different excitations have been carried out. The results indicate that the adaptive feedforward vibration control system can effectively reduce the cabin floor vibration and has an adaptive ability of tracking control. Moreover, the responses under multidirectional excitations can also be reduced by more than 90%.
In comparing the single vertical excitation, the responses under multidirectional excitation exciting more modes have a slightly lower and inconsistent convergence rate in both the experiment and simulation results. Responses at some points converge faster than others, and responses at some points have an increasing phenomenon in the process of convergence.
Conflicts of Interest
The authors declare no conflicts of interest.
Funding
This work was supported by the National Natural Science Foundation of China (51505214).
Open Research
Data Availability Statement
The data used to support the findings of this study are available from the corresponding author upon request.


