Experimental and Numerical Analysis of the Aerodynamic Characteristics of the Flexing Wing With Active Camber Design
Abstract
The flexing/morphing concept is a means of improving wings’ aerodynamic performance. Morphing technology such as the fishbone active camber (FishBAC) design has demonstrated drag reduction of over 30% at moderate angles of attack (AoAs) and 40% at higher AoAs and tail deflections compared to plain flap systems. In the current study, a morphing FishBAC wing model was designed and built for experimental measurements. The rear 25% of the wing portion was made of a flexing element with a maximum deflection of 32°. The measurements were conducted in a subsonic wind tunnel instrumented with a two-component force–balance system. The FishBAC model was shown to be effective in all tested configurations. It tended to be more aerodynamically effective and efficient at higher AoA and lower flex deflections. An increase in the lift coefficient of up to 25% and drag reduction of up to 37% were observed. The overall aerodynamic efficiency at higher AoAs in terms of glide ratio was up by 50% compared to a plain flap. The experimental measurements and data were complimented by computational fluid dynamic (CFD) simulations, where the aerodynamic characteristics were compared and validated. Overall, the experimental and CFD data compared well in the given range of AoAs and flex angles. However, the CFD data tends to overestimate the lift and drag coefficients at the high end of the AoA range.
1. Introduction
Aircraft wings and their associated high-lift devices (HLDs) are seen as significant drag-producing elements of an aircraft. Conventional HLDs have been a great option to increase lift; however, they come with a drag penalty. They have been improved to an extent where there is little room to increase their efficiency and hence reduce aircraft drag. HLDs such as trailing edge (TE) flaps have long been used to increase the camber of the wing section and so to improve the lift coefficient in landing and take-off configurations. However, they do come with several drawbacks resulting from the presence of a sharp and discrete change in camber which ultimately increases drag over the wing. Moreover, flap (full) deflection leads to flow separation at the TE. While this effect is even more pronounced at a higher angle of attack (AoA), it can also limit the maximum lift coefficient. In addition to that, the flap with its actuation system and required structural reinforcement comes with weight, complexity, and cost implications [1, 2].
Modern aerodynamic surfaces (wings, HLDs, etc.) are rigid structures with discrete sections that can move relative to each other in order to achieve desired aerodynamic capabilities. Historically, aerodynamic high-lift systems were always subject to improvement and/or optimisation. A multitude of techniques and methodologies have been implemented to improve aerodynamic characteristics in terms of efficiency performance (lift-to-drag ratio). Studies by Ebrahimi et al. [3] and Moghimi Esfand-Abadi, Djavareshkian, and Madani [4] have shown the improvement in aerodynamic efficiency by featuring a wing with a tilt angle and an optimised wing design with an improved wing fence to reduce rolling moment, etc.
Aerodynamic surfaces are optimised in their aerodynamic characteristics, where the maximum lift coefficient and/or lift-to-drag ratio (glide ratio) are achieved with a certain configuration and/or conditions. These conditions change throughout the flight phases, so for most of the flight, the aircraft will inevitably fly in sub-optimal conditions. In the case of HLDs (flap), the efficiency decreases dramatically and could even have an adverse effect on performance [5]. Variations of wing camber by deploying HLDs are conventional means to optimise the glide ratio in flight. It has been a popular solution for decades, and HLDs are nowadays found on nearly every commercial aircraft [6]. It should be noted that any deployment of HLDs will inevitably lead to degradation of wing drag characteristics. Torenbeek [7] pointed out that deflecting the flap effectively increases the wetted area and thus friction on the upper wing surface. It also modifies the wing lift distribution as well as the tail download required for the trimmed flight. In addition, the early flow separation at the TE causes the flap efficiency to drop rapidly at large deflections. This behaviour is a result of the sharp edge at the onset of the flap and the discrete change in camber rather than a smooth transition [8].
The ideal solution to this challenge provides a high maximum lift coefficient while at the same time keeping the drag coefficient to a minimum for the wing to operate at an optimal lift–drag polar, that is, in a drag bucket. This is difficult to achieve even just for a single configuration (AoA), but it becomes an even greater challenge when addressing the entire flight mission. In an experiment, Rivero et al. [9] compared a morphing model known as the fishbone active camber (FishBAC) to a NACA (National Advisory Committee for Aeronautics) 23012 airfoil (baseline and flapped). They have shown that aerodynamic characteristics of the morphing model outperform those of the conventional airfoil model. The FishBAC morphing model achieved 16% more aerodynamic efficiency for the normal operating range of AoAs compared to the flapped airfoil.
Morphing camber methods have been developed by several researchers to achieve various design lift coefficients for different AoAs during the flight mission. Results obtained from preliminary investigations have so far been favourable [5, 10, 11]. Other morphing projects have followed to establish large-scale technology to be implemented on large civil transport aircraft. Examples of such projects are developed within DLR’s (the German Aerospace Centre) internal and collaborative morphing wing programmes as reported by Sinapius et al. [12]. They include, but are not limited to, smart TE and local profile bump, active gap control, active winglet, and smart leading/TEs, etc. The operation of most of the morphing wings is based on the actuation of the flexible structure (surface) by an actuator, string, rod, or tendon. Actuation is provided by a servo motor, or a pulley, or a piezoelectric element. Bartley-Cho et al. [13] studied the development of a smart wing with a morphing TE for high-rate actuation and deformation control using smart materials. The TE structure consists of a central laminate with a flexible honeycomb core covered by a silicone skin (Figure 1(a)). Bending/morphing of the TE was actuated by a piezoelectric motor. The deflection of the TE was used to provide control authority to the vehicle. Similar attempts to apply the morphing concept to gain aerodynamic performance improvement were evident in many other literatures. The use of a morphing TE for the wind turbine blade was investigated by Daynes and Weaver [14]. The design of this morphing TE was to some extent similar to the aforementioned one, with the laminate forming the upper surface and being connected to the lower silicone surface (Figure 1(b)). Actuation is provided by a geared motor via a push-pull rod. Wind tunnel testing of such a design has shown good control authority, with a lift coefficient improvement of ΔCl = ±0.5 for the morphing TE. Other examples of variable/morphing camber concepts were reported by Şugar Gabor et al. [15] and Nguyen et al. [16]. Such morphing designs provided a drag reduction of 22% [15] and a 6% aerodynamic performance improvement [16], respectively.
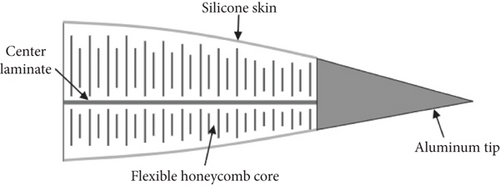
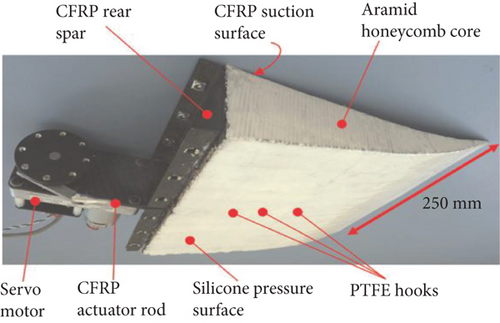
In the current study, the FishBAC morphing concept is investigated for performance evaluation. Such a concept has been studied and reported in a number of literatures in the past [1, 2, 17, 18]. The FishBAC concept primarily addresses the drag penalty of traditional HLDs by creating a smooth curvature without any gaps. A cambered wing section without a gap between the main and TE elements would eliminate the early flow separation from the wing upper surface and modify the flow turbulence signature along with improved boundary layer characteristics.
To confirm if the FishBAC concept is viable to increase aerodynamic efficiency, wind tunnel model design and tests along with numerical simulations are means to prove the concept. As such, aerodynamic characteristics can be established, and provisions for application are considered accordingly. Research studies (including the current one) seek to perform tests on various wing configurations (within an aircraft flight operation) to allow for a comparison of the FishBAC performance to that of a traditional flap, underpinned by a series of computational fluid dynamic (CFD) simulations. A focus that is largely on lift and drag coefficients in conjunction with boundary layer thickness and turbulence signature to understand the origin of potential improvements.
There is a gap in the validation extent regarding the active camber effective performance for a relatively high camber and high thickness airfoil/wing (NACA 4415). Key efficiency indicators such as glide ratio are the means for establishing the minimum criteria for acceptance and feasibility of the concept. However, there are still elements of performance capabilities of the concept that require further rigorous examination with an extended scope of characteristics. The objectives pursued in the current study are to establish a consistent trend in validating experimental and numerical data, attest to the feasibility of the morphing concept by comparing and evaluating aerodynamic characteristics between the FishBAC and plain TE flap design, and finally, quantify the level of aerodynamic improvement offered by the morphing concept to wing design compared to that of a plain flap design.
1.1. Morphing Technology: FishBAC
In general, morphing is a technology that involves radical shape change in rigid surfaces to modify/improve structural and aerodynamic performance characteristics [5]. Figure 2 illustrates the morphing design classifications that are implemented to improve aerodynamic surfaces.
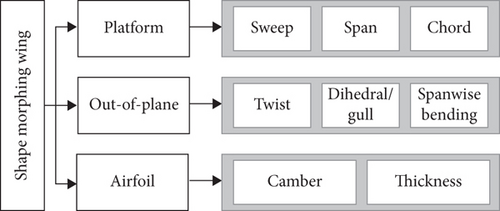
The concept considered for the current study is based on the airfoil adjustment that will focus on camber variations resulting from a morphing airfoil. This is with the aim to replace traditional HLDs such as flaps with a morphing section.
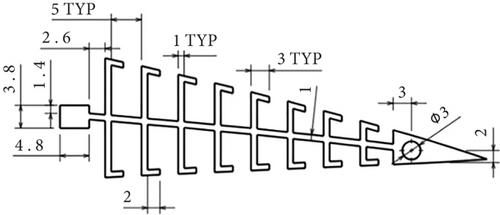
The FishBAC is a compliant morphing camber structure inspired by nature. It creates camber changes like a traditional TE flap but in a smooth and continuous form using a thin chordwise bending beam spine, compliant skin, a rigid front spar, and a solid TE strip [18] (Figure 3). The morphed TE can achieve chordwise and spanwise camber variations with the same structural architecture, providing a smooth contour with no additional gaps. The camber variations occur on the TE since this region has the highest efficiency relevant to aerodynamic structural aspects.

In an experimental setting, the FishBAC design is achieved by placing actuators in the rigid spar that pull an antagonistic pair of tendons, thus creating a bending moment and changing the shape of the airfoil (either positive or negative camber) [18]. The skin covering the surfaces is of a compliant material (e.g., silicone and elastomer-based composite) that can withstand the strain of deformation. The design methodology of the FishBAC is discussed in the following sections in preparation for the wind tunnel testing and CFD simulations.
It is worth noting that most of the morphing technologies are largely at the stage of experimentation and proof of concept. No significant utilisation of the concept has been made in major aerospace applications, that is, large civil transport aircraft. Replacing traditional aircraft wings and/or HLDs with morphing structures at large scale faces several challenges as listed by Sinapius et al. [12]: (a) highly elastic skin capable of withstanding air loads, (b) an appropriate compliant mechanism or kinematics to deform skin, (c) connection of a compliant mechanism or kinematics to elastic skin, and (d) actuator integration, both discrete and distributed. Nevertheless, the concept certainly can serve as a legitimate replacement for traditional HLDs, and in the view of the existing data, there is substantial evidence that the aerodynamic improvement gained may well outweigh the drawbacks.
2. Design of the FishBAC Model
The design of the model is based on the NACA 4415 airfoil with a chord length of 300 mm, a 525 mm span, and a maximum thickness of 15% (45 mm). The morphing section of the model is 25% or 75 mm at the TE. Such a portion of the morphed geometry will be mimicking the flap deflection on the conventional model with a 25% chord flap. The geometry of the FishBAC model in CAD (computer-aided design) and 3D print formats is shown in Figure 4. The model consists of four internal ribs, with a leading edge forming the main front spar, that is, carrying the main bending stresses. In addition to that, a mid-spar was added just ahead of the location of the servo and behind the centre of gravity. This configuration allowed for a minimum part count and sufficient structural strength.
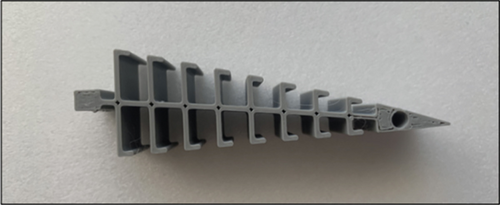
As shown in Figure 5, most components of the model are tight fit without the need for screws and/or glue.
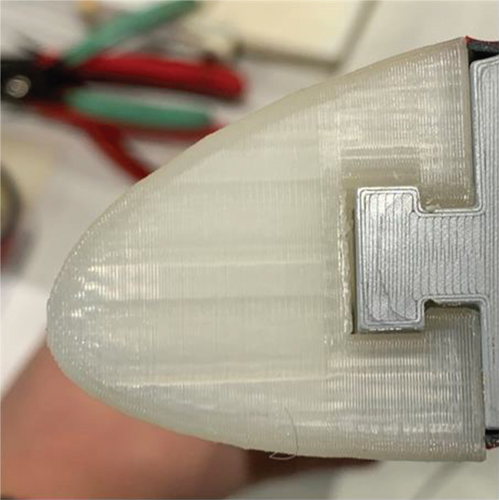
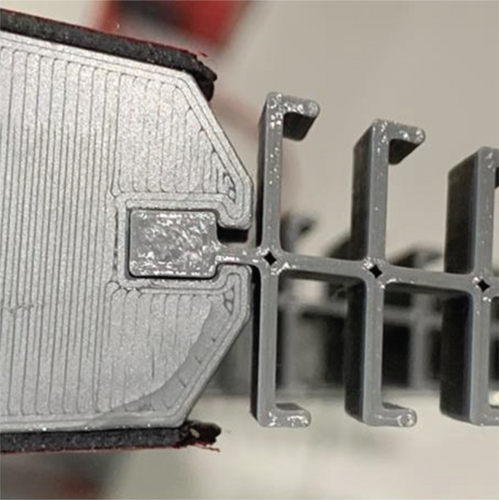
A servo motor used to actuate the morphing section is placed in between the two ribs and is fitted onto a tray running in the spanwise direction. Since the servo is secured onto the tray, chordwise stiffeners were added to the tray on both sides to add rigidity and avoid bending or rotation as the servo is deployed. Such a layout ensured that there was no misalignment between the morphing sections (tail). It was required to have a wide-body tail behind the servo and connect it to the tail on the ribs via a thin metal rod at the TE. The increased stiffness of the central tail would guarantee that sufficient force is transferred to the other tails to keep the deflection consistent across the span. The internal layout of the model is shown in Figure 6.
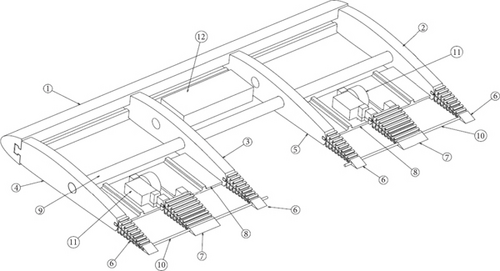
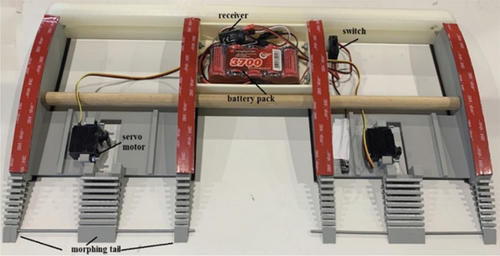
While one single servo would have had sufficient power to deflect the entire TE, the model was split into symmetrical halves consisting of a servo, two ribs, and a central tail each. This approach further ensured consistent deflection across the span. The servos were then connected to a 6 V 3300 mAh battery pack and a receiver to change the deflection remotely, that is, without having to deinstall and disassemble the model each time.
Excluding the cantilever bracket, the skin, cables, and consumables, the FishBAC model consists of 21 components, as detailed in the bill of material in Table 1.
| Component | Qty | Material | Part number/ID | Illustration |
|---|---|---|---|---|
| Leading edge | 1 | Polylactic acid (PLA) | FishBAC-002/1 |  |
| Main rib—Right slot single hole | 1 | PLA | FishBAC-003/2 |  |
| Main rib—Right slot with double hole | 1 | PLA | FishBAC-004/3 |  |
| Main rib—Left slot single hole | 1 | PLA | FishBAC-005/4 |  |
| Main rib—Left slot with double hole | 1 | PLA | FishBAC-006/5 |  |
| Central spine—Standard body | 4 | PLA | FishBAC-007/6 |  |
| Central spine—Wide body | 2 | PLA | FishBAC-008/7 |  |
| Servo tray | 2 | PLA | FishBAC-009/8 |  |
| Mid spar—600 × 15 mm | 1 | Wood | FishBAC-010/9 |  |
| Rear spar—200 × 2.5 mm | 2 | Steel | FishBAC-011/10 |  |
| Hitec HS-225MG Metal Gear Mighty Mini Servo | 2 | n/a | HITHS225MG/11 |  |
| Rechargeable Battery 6 V 3300 mAh SubC NiMH Tamiya Lead | 1 | n/a | 5VP3300SC-S5-T1F2/12 |  |
| Futaba R3004SB 4-Channel 2.4 GHz T-FHSS Receiver | 1 | n/a | P-R3004SB |  |
Except for the electronic parts and mid and rear spars, the components were printed in-house using standard PLA (polylactic acid) with 15% infill. PLA is a high-modulus polymer produced from renewable resources [19]. It offers sufficient strength at a relatively low density of 1240 kg/m3. It was important to make the model lightweight so that the lifting force in the wind tunnel would result in an acceptable upward movement of the wing, even at low speeds. The FishBAC mechanism itself is powered through the 6 V rechargeable battery, which connects directly to the two servos and can be turned off via a switch attached to one of the inner ribs. Using standard guitar strings, the servo arms were then connected to the rear end of the wide-body central spines on each side of the model. In order to get a better understanding of the functionality of the servo and its calibration, a schematic was created in a CAD platform, where the path of deflection for a given rotation of the servo arms was predicted. Figure 7 illustrates how the rotational movement of the servo translates into linear movement of the tendons and ultimately the deflection of the tail.
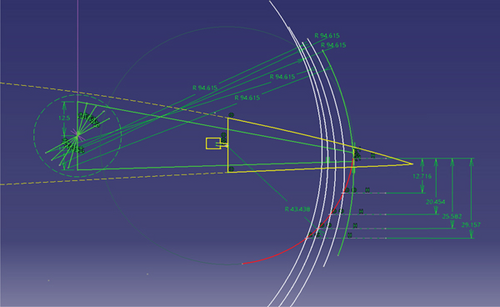
The vertical displacement and angle between the baseline airfoil and predicted deflection are measured accordingly, and the results of which are presented in Table 2.
| Servo arm rotation (°) | Vertical displacement (mm) | Tail deflection angle (°) |
|---|---|---|
| 0 | 0.00 | 0.00 |
| 15 | 12.72 | 7.81 |
| 30 | 20.45 | 13.16 |
| 45 | 25.58 | 17.15 |
| 60 | 29.16 | 20.31 |
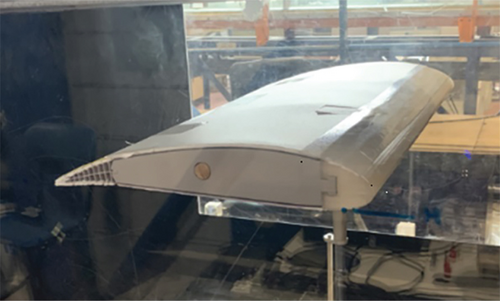
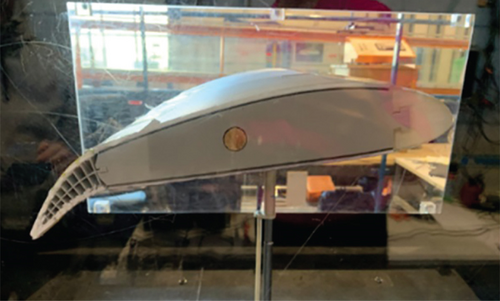
The model was covered by 3 mm thick Depron foam sheets (skin) of density of 40 kg/m3. This kind of skin/material offered the flexibility required for the morphing section. Unlike other more traditional skin materials, foam does not buckle during bending, which is essential for the model to work properly. The fully assembled FishBAC model in its final form, compared to the plain flap model, is shown in Figure 8.
3. Wind Tunnel Experimentation Setup
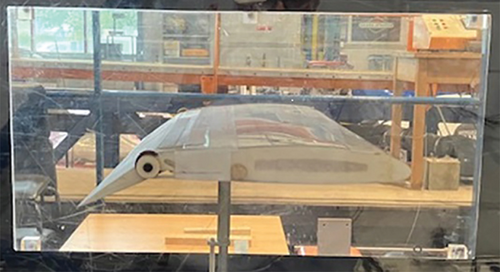
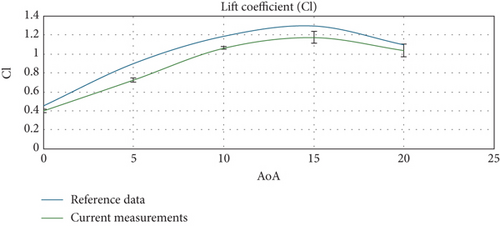
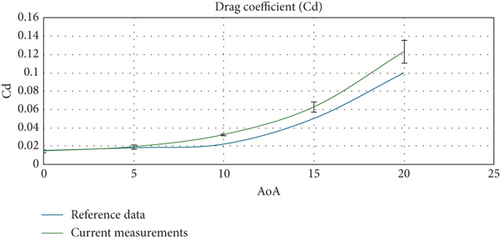
For the experimental measurements, two models were designed and built. One is the FishBAC morphing wing, and the second model was of a conventional/plain flap design (Figure 8). The models are initially designed as infinite wings (2D (two-dimensional)); that is, they are of constant chord length across the span, and also when placed inside the wind tunnel test section, they span over the full width of the test section. The models’ geometry and flow are set to be 2D in nature. But due to the presence of 3D effects within the model and tunnel flow interaction, the testing environment is overall quasi-2D. This is in addition to the existence of small gaps between the main element and the flap and also a gap between the models’ end edges and the tunnel side walls that may have contributed to the nonfully 2D nature of the flow. Nevertheless, the overall performance of the experimental wing as a 2D model was assessed by validating the lift and drag polar of the model without the TE deflection against reference data. As seen in Figures 9(a) and 9(b), these results have scored good agreement. This form of validation has been used to support and justify the validity of other measurements with TE deflections, which are used to compare the performance of the two models in identical conditions and demonstrate the relative improvement of the FishBAC model against the plain flap model accordingly. Moreover, the obtained results are not intended to be compared with other results. The investigation here is to directly compare the two undermatched operating conditions to show a relative improvement in performance. As such, a meaningful conclusion has been drawn on the efficacy of the morphing concept and its implication on the aerodynamic characteristics of the wing with a flexible TE design.
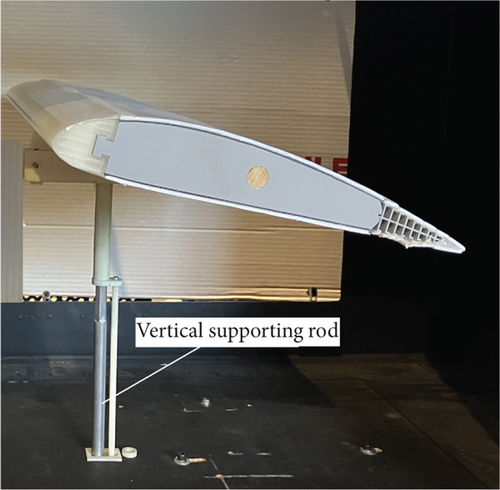
The models are placed in the test section that is supported by a vertical supporting rod with a movement in the normal and horizontal directions (for the lift and drag measurements) (Figure 8). The lower end of the supporting rod is attached to a two-component force–balance system. The forces are measured by bridge sensors (load cells) via a DAQ (data acquisition system) (National Instrument (NI)) (Figure 10).
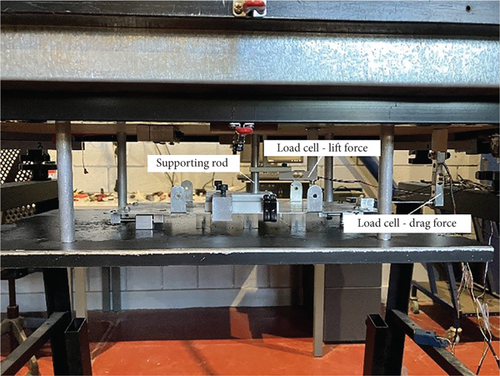
All experimental quantities are configured and measured by the NI data acquisition (DAQ - 9172) system. The NI hardware is connected to a PC with a LabVIEW platform, interfacing the signals from the hardware to the data processor. A total of two channels were used to monitor the measured parameters and process the signal through the bridge analogue input module NI 9237. This is a four-channel isolated 24-bit voltage input. The conditioned output signals are calibrated and set for force reading. The measurements are samples at 300 Hz averaged for 10 s with mean values being recorded. In Table 3, the list of test equipment is provided showing the properties and type of each component of the equipment.
| Item | Property | Unit | Accuracy |
|---|---|---|---|
| Data acquisition DAQ—9172 | 4 slots | n/a | 50 ppm of sample rate |
| NI bridge input module—9237 | 4 channels | n/a | ±100 ppm maximum |
| Microload cell—normal force | Max force, 20 | kg | ±100 μV/V output error |
| Microload cell—axial force | Max force, 6 | kg | ±100 μV/V output error |
| Digital differential manometer series 477 | Pressure range, 0–996 | Pa | ±0.5% |
| LabVIEW (NI) IT platform | Data interface and postprocessing | — |
The tests were run for both models under identical conditions so the measured data can be compared accordingly. The measurements were conducted for AoAs ranging from 0° to a maximum of 10° and 15° of TE deflection. A summary of the testing parameters is provided in Table 4.
| Parameter | Value | Units |
|---|---|---|
| Baseline airfoil | NACA 4415 | n/a |
| Chord, c | 300 | mm |
| Morphing start, xs | 0.75 | n/a |
| Maximum deflection, wte | [0, 5, 10, 15] | ° |
| Angle of attack, α | [0, 5, 10] | ° |
| Reynolds number, Re | ~300,000 | n/a |
| Freestream velocity, V∞ | 15 | m/s |
When performing wind tunnel testing, it is generally advised to assess the requirement for boundary correction factors to account for the effects of the enclosed wind tunnel compared to freestream airflow in unrestricted environments. However, corrections for a blockage factor were not required as the volume of the model takes up less than 5% of the wind tunnel test section volume [21]. The drag of the vertical supporting rod was subtracted from the model’s overall drag values.
3.1. Experimentation Uncertainty and Validation
In Figures 9(a) and 9(b), the measured lift and drag data were validated against reference data from Jacobs and Sherman [23]. In addition, the results of the uncertainty analysis are presented in the form of error bars in Figures 9(a) and 9(b), representing the mean value of the measured quantity with an associated standard deviation (±SD). Due to the volume of measurements, the validation and uncertainty analysis were conducted for the lift and drag coefficients without the tail/flap deflection.
4. CFD Simulations
For the CFD modelling of the two wing models (conventional and FishBAC), it is important to distinguish between the behaviour of the plain flap and that of the FishBAC morphing wing. The plain flap will be deflected by rotational displacement in degrees, while the FishBAC morphing wing is a deformation of the surfaces resulting in an increase in camber at the same time. The deformation is correlated to the size of the angular deflection of the plain flap, so their aerodynamic characteristics can be compared quantitatively.
CFD simulations were performed in a 2D configuration using the Ansys Fluent platform. The boundary conditions used in the CFD simulations are set to those quantities used in the experimental testing. Inlet velocity was set to 15 m/s, and turbulence properties are set to the same level as expected in the wind tunnel test section. Steady-state solutions were selected in the initial setup of the simulations. The standard k-ω turbulence model was chosen for the simulations due to its popularity within the aerospace industry. This two-equation model is known for its superior performance for low Reynolds numbers and complex boundary layer flows. To ensure that this turbulence model could accurately predict the boundary layer and flow separation at the TE, the y+ value had to be about 1. Therefore, during the meshing process, the first layer thickness was set accordingly using an online estimation tool to obtain a refined mesh structure. The refinement near the model’s wall boundary allowed for improved cell distribution within the boundary layer, leading to an accurate solution to boundary layer thickness and growth rate. The size of the mesh in terms of cell number was 500 k, in which the aerodynamic solutions for Cl and Cd were converged independently of the mesh (mesh-independent solution).
The geometry setup for the plain flap is shown in Figure 11, where the deflection intervals are set to 5° increments. To model the deflection/morphing of the FishBAC model in CFD, a more complex approach was needed. In order to capture the smooth deformation and change in camber, the known thickness distribution of the NACA 4415 was overlaid onto a polynomial shape function (a parametrically defined camber line). This approach was initially used by Woods et al. [1, 2] for the NACA 0012. However, due to the parametrisation of the thickness distribution, it can also be applied to any other airfoil from the NACA 4-series family. Figure 12 shows how the mean camber line and thickness distribution are combined to form a unique airfoil shape.


Before any overlaying could take place, various parameters are needed to be defined. These are shown in Figure 13.

Here, the term wte represents the maximum vertical deflection, that is, the downward movement of the TE. This was calculated for the four deflection angles considered in the current study (Table 5).
| Deflection angle (°) | Max deflection (% chord) | Max deflection (mm) |
|---|---|---|
| 0 | 0.00% | 0.00 |
| 5 | 2.19% | 6.56 |
| 10 | 4.41% | 13.22 |
| 15 | 6.70% | 20.10 |
As can be seen from Equation (6), the nonmorphing section of the airfoil xs remains unaffected by the shape function. It was therefore decided to use the standard coordinates for the NACA 4415 for the first 75% of the airfoil and to use Woods et al.’s. [1, 2] approach for the morphing section only.
To define the full shape of the airfoil after deflection of the FishBAC wing, the coordinates for the upper and lower surfaces needed to be determined. These coordinates were found using a set of equations defined by Woods et al. [1, 2] and are presented by Equations (7)–(11):
Here, θ is the local slope of the camber line, which can be determined using Equation (10). Applying these equations to the dimensions of the FishBAC model in this study, a set of coordinates for each deflection could be defined. These were then plotted on the same chart, and the results are presented in Figure 14.
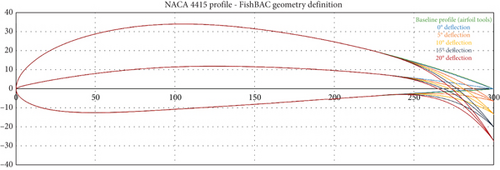
Each set of coordinates was then imported into the CAD platform to model the deflected airfoil shape in CFD. The remainder of the process is identical to the one used for the plain flap. For the 3D simulations, the 2D surfaces were extruded separately to ensure the capture of a small gap between the model and the wind tunnel walls to accurately model 3D effects inside the wind tunnel.
5. Results and Discussions
5.1. Flow Characteristics
The results from the CFD simulations have provided useful insight into the flow physics around the wing, revealing information on the viscous effects such as those relevant to the boundary layer characteristics and flow separation. To ascertain the advantages of the morphing concept within the FishBAC model, three sets of CFD data were postprocessed and presented: flowfield velocity distribution, TE wake vortex, and boundary layer sizing (Figures 15, 16, and 17).
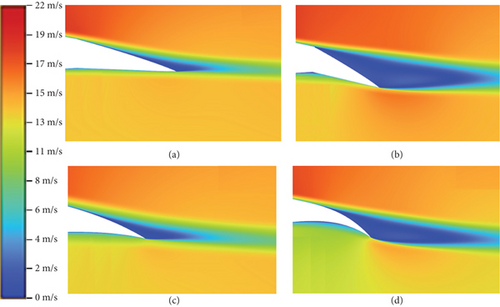
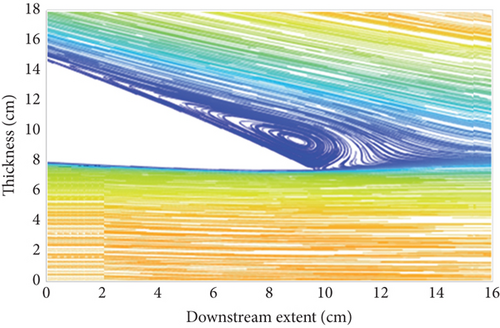
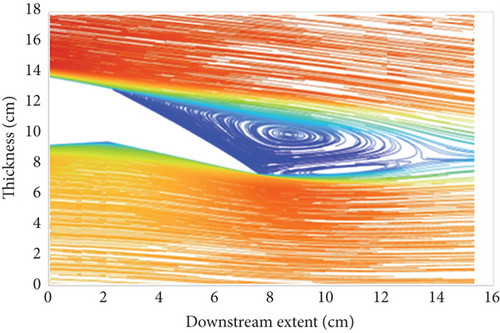
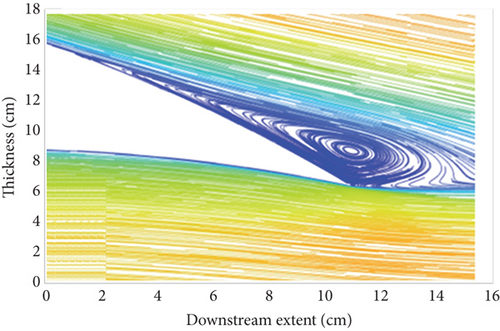
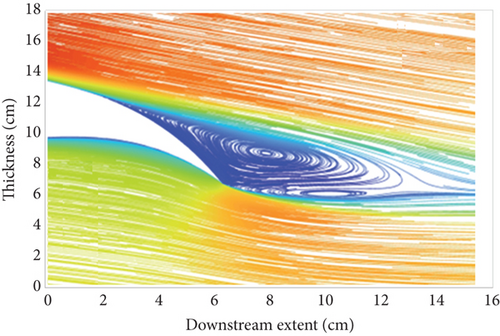
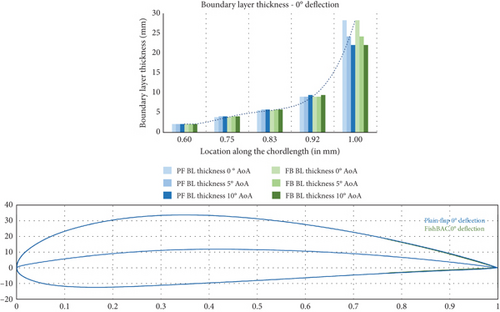
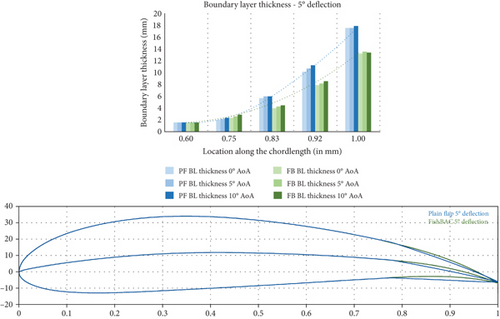
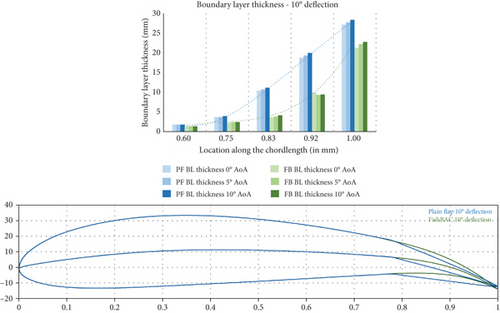
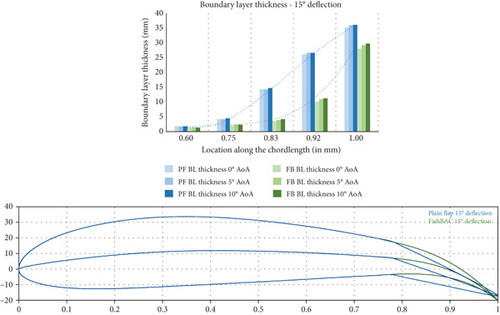
Figure 15 illustrates the flowfield velocity plots for the plain and FishBAC models at the configured AoAs and tail deflections. The velocity contours here depict the location and extent of the separated flow and boundary layer (blue region). By comparing Figures 15(a) and 15(b), it is clear that the FishBAC model experiences a lower severity of flow separation compared to the plain flap model at the given similar flow conditions and configuration. As such, the size of the wake vortex formed at the TE in the case of the FishBAC model is relatively smaller than the plain flap model (Figure 16). In both models, the deflection of the TE leads to a similar pattern and location of separated flow and formation of wake vortex systems. These flowfield characteristics, therefore, provide useful insight into the drag performance of the two models. The lift and drag characteristics of the models are presented in Section 5.2, where the ultimate aerodynamic efficiency of the models is assessed and evaluated in light of the morphing concept’s effective performance.
In terms of lift generation, the flowfield velocity contours in Figure 15 indicate that where the blue regions are thinner or smaller, a greater surface velocity—and hence more suction on the top surface—is observed. This would consequently lead to more lift generation. One of the argued improvements of the morphing concept is that due to the reduced separation and reduced size of the boundary layer and wake vortex, a source of lift increment may become prominent in the FishBAC model performance. Moreover, at some configurations, even where there is minimal and/or no drag reduction, the overall aerodynamic efficiency (glide ratio) would still be higher than that of the plain flap due to the source of increased lift (lift, drag, and efficiency data are presented in Figures 18, 19, and 20).

5.2. Lift and Drag Characteristics
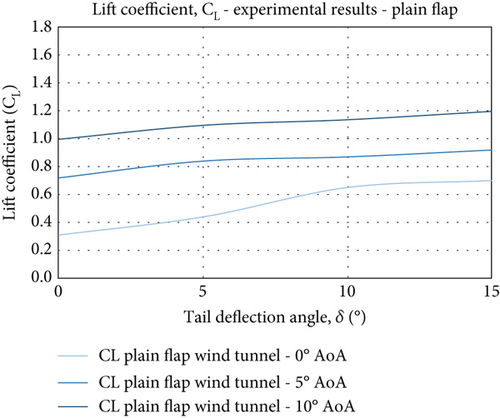
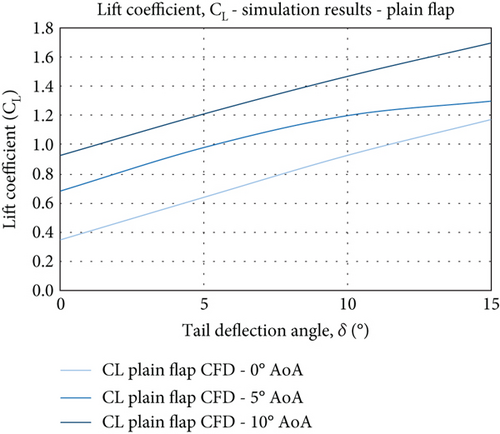
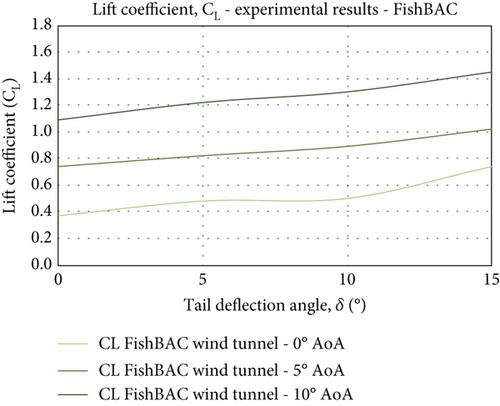
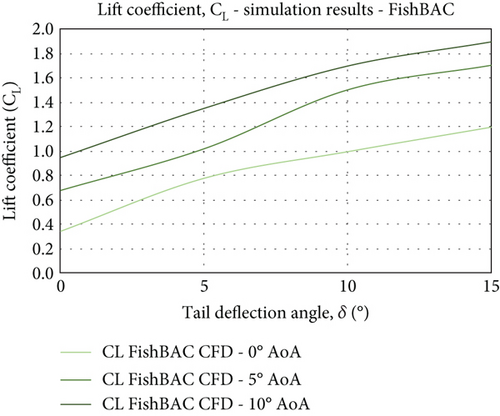
The lift coefficient results from both wind tunnel testing and CFD simulations are presented in Figure 18. For both models, the lift coefficient increases linearly with an increasing deflection angle as well as increasing AoA, which is an expected behaviour of any effective wing profile. The main difference, however, is the gradient, which is steeper in the CFD simulations compared to those of the experimental results. Quantitatively, there is fairly good agreement between the data obtained by experimental measurements and CFD simulations. And ultimately, the expected behaviour of the wing profile is well captured by both methods. However, at the maximum deflection (and maximum AoA), the difference in Cl value is approximately ΔCl = 0.5 (for the plain flap case). For the FishBAC model, the lift control authority is ΔCl = 0.45. Reasons for such (insignificant) disparities are due to the fact that the testing in the wind tunnel is not purely 2D, as opposed to the fully 2D CFD simulations. Although, as mentioned in Section 3, the models are designed to be 2D flow geometries. However, the presence of 3D effects due to the nature of the wind tunnel setup and the gap between the wingtip edges and the test section side walls has affected the 2D nature of the flow to some extent. The gap facilitated pressure leakage between the wing’s upper and lower surfaces, leading to additional drag being generated on the models. On the other hand, the downwash effect may not be effectively predicted in the CFD simulations, adding to the complexity of the results agreement. Nevertheless, the similarity in qualitative trend is evident from the results presented in Figures 18 and 19. Also, the behaviour of the aerodynamic characteristics in response to the varying AoA and TE deflection angle is typical and consistent with the lift and drag profiles of the wing section. As such, the aerodynamic characteristics of the two models are measured, simulated, and compared in identical conditions. Their relative performance has been evaluated considering the relative improvement gained by the morphing concept. For instance, at low AoAs and deflection angles, the plain flap and the FishBAC both produced similar lift in size. As both AoA and tail deflection increase, the FishBAC’s effectiveness in creating sufficient lift rapidly improves. At α = 10° (AoA), it provides between 11% and 25% more lift, with the CFD simulations predicting the highest lift coefficient (1.9) to be 11% higher than the plain flap (1.7) for the same configuration (δ = 15°).
The current data from wind tunnel measurements and CFD simulations will serve to add complementary understanding of the mechanism by which the morphing aerodynamics is operating and to extend the validatory work to prove the concept’s effectivity.
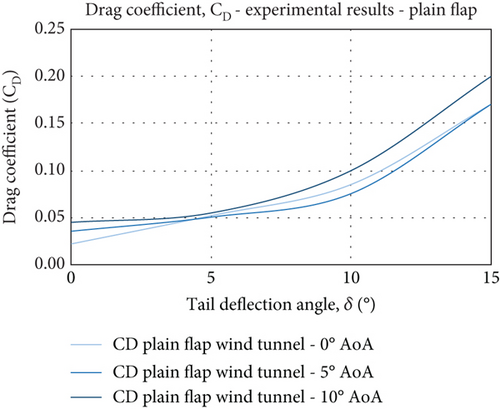
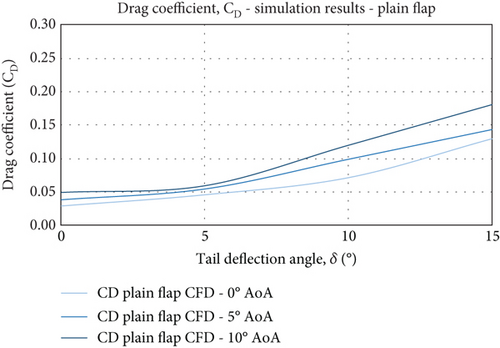
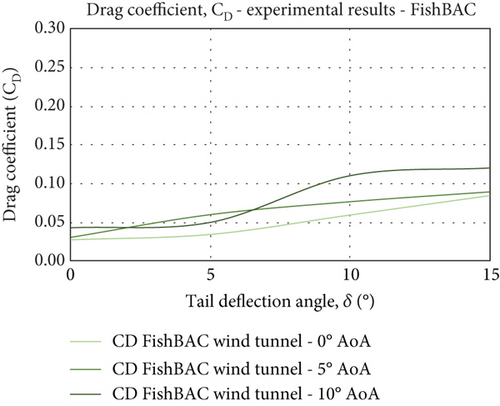
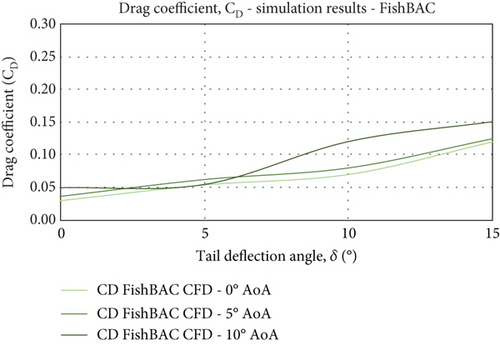
Drag characteristics of the FishBAC showed more of a stable behaviour yet with a minor increment in the high-end spectrum of the AoA range and TE deflections. The plain flap drag, however, increased more sharply with drag coefficients in the case of maximum TE deflection (δ = 15°) of 0.05–0.2 (experimental testing) and 0.05–0.17 (CFD simulations) across the range of AoA (see Figure 19). Consistent drag reductions of up to 20% were recorded for the FishBAC morphing model at the lower end of the AoA range, where the biggest improvement was observed at the highest tail deflection (δ = 15°) with the drag reduced by 37.5%.
In the CFD simulations, the drag is predicted to increase in a similar manner for both models, where the FishBAC would reach a drag level closer to that of the plain flap model (ΔCd = 0.025) at δ = 15° and α = 10°.
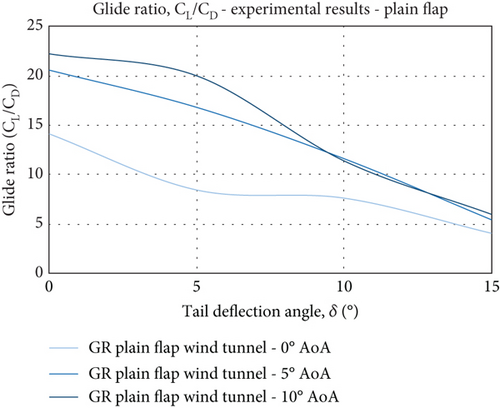
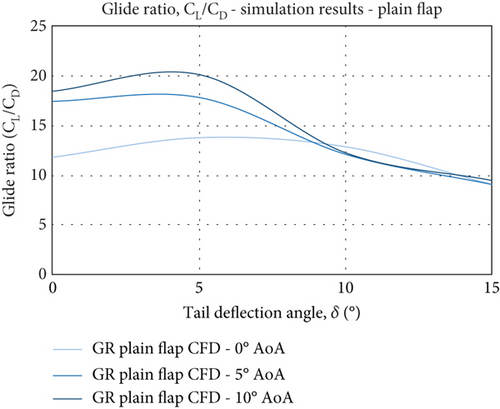
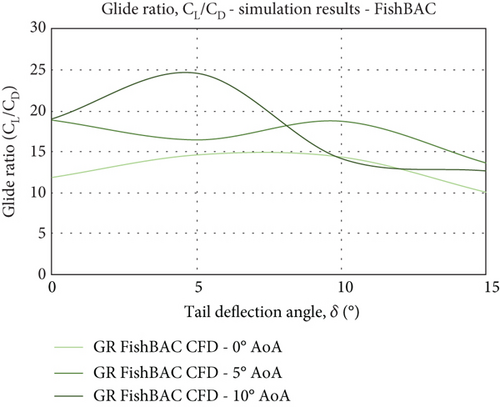
Figure 20 illustrates the results for the glide ratio in all four cases and represents the level of aerodynamic efficiency observed by the FishBAC performance. It is almost evident that both models exhibit high levels of efficiency around δ =5°, in which the FishBAC model shows an improvement of efficiency of up to 25%. In the case of the plain flap model, the decline in efficiency seen beyond 5° TE deflection is much steeper compared to the FishBAC. Moreover, at the maximum TE deflection, the difference in Cl/Cd reaches up to 6 (Δ(Cl/Cd) ≈6). If the tail deflection is increased further, the glide ratio for both models should demonstrate a continuous drop over the AoA spectrum. The higher the deflection of the TE, the more drop in efficiency is expected. To this end, it may well be argued that the improvement in aerodynamic performance achieved by the FishBAC design constitutes a major attribute of the design performance characteristics. And that the airfoil geometrical features, such as the maximum thickness of 15% of the NACA 4415 wing model used in the current study, have been a positive factor in obtaining the effective and efficient performance. The NACA 0012 wing model (12% thickness) used in the experiment of Woods et al. [1, 2] has shown an aerodynamic efficiency of only 10 compared to that of the NACA 4415, which is 25 at the given similar conditions (α = 5° and δ = 25°). Stall characteristics, however, will need further investigations, as for high thickness and high camber wing sections (airfoil), the performance may not supersede wings of lower thickness and camber. Moreover, the FishBAC design may not be deemed a viable option for high AoA performance. Extending the experimentations and simulations to include the prestall configuration would be of important consideration for any future study.
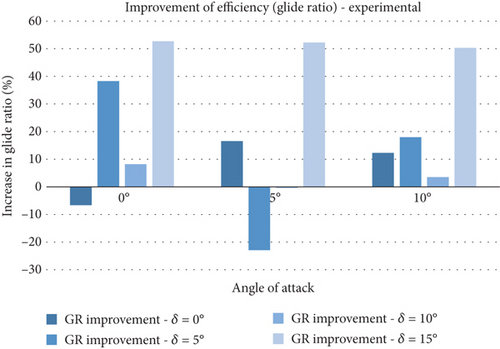
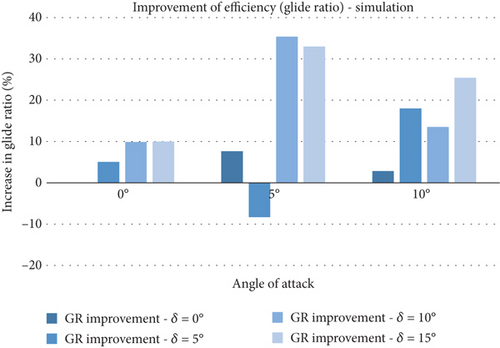
A detailed comparison of the efficiency of both models is shown in Figure 21, where the size of the glide ratio is presented in respect of AoA and TE deflection angles. It is clearly evident that qualitatively the data are in good agreement, indicating the consistency in capturing the expected trend in observed quantity. The aerodynamic improvement (in terms of glide ratio) is well demonstrated across the AoA spectrum and also across all tail deflections. The FishBAC model achieves a 5%–50% increase in glide ratio. The improvement is largely due to better drag characteristics seen within the flow behaviour around the TE (flexing tail). As seen in both Figures 21(a) and 21(b), the highest improvement is achieved at higher tail deflections (δ = 15°). This followed from the results seen in Figures 15 and 16, where the FishBAC model experienced a comparatively smaller wake region than that from the plain-flap model. This alone would suggest that the suction side of the model at the tail region will have a differing flow separation behaviour. It is likely that the severity of the separation drag on the FishBAC model is less than the flapped model, leading to such significant improvement. It is known that the larger drag on the flapped model is due to the sudden and sharp shape and flow discontinuity created by the flap deflection. In contrast, the improvement seen at high AoA (α = 10°) across all tail deflections suggests that the smooth continuous camber change has provided a less severe drag performance at the TE, leading to a better glide ratio (up to 25% at δ = 15°). The deficiency seen at α = 5° and δ = 5° is due to the onset of the drag growth being at a faster pace compared to the growth of the lift. It seems there is no sufficient momentum in the flow over the top surface to create increased suction; hence, the lift would not reach the level for increased efficiency. At the same time, this lack of momentum leads to the onset of flow detachment, increasing the drag to an extent that the wing will lack efficient performance.
5.3. Boundary Layer Characteristics
One of the arguments made to prove the efficiency of the FishBAC morphing concept is that the boundary layer over a morphed surface is modified, affecting the pressure gradient (in terms of growth and thickness) [26]. The flow over a morphed surface is of a continuous profile, resulting in a smoother airflow across the airfoil, creating a relatively thinner boundary layer compared to the plain flap. To this end, the boundary layer thickness for each set of CFD simulations is measured, and a comparison is made between the two models (FishBAC and conventional).
During the postprocessing, five locations along the upper surface of the airfoil were selected using the same coordinates that were used to create the original airfoil profile. This ensured that the appropriate y-coordinates were selected, and the coordinates were placed exactly on the airfoil walls. The selected coordinates as well as the reasoning behind the selection of each point are presented in Table 6.
| Data point | x -coordinate | Location in % of the chord length | Justification |
|---|---|---|---|
| 1 | 179.265 | 60% | Towards the end of main rib |
| 2 | 225.000 | 75% | Start of the morphing section |
| 3 | 248.901 | 83% | Ca. 25 mm along the morphing section |
| 4 | 274.719 | 92% | Ca. 25 mm ahead of trailing edge |
| 5 | 300.000 | 100% | Trailing edge |
The development and growth rate of the boundary layer over the models’ surfaces are presented in Figure 17. As the tail deflection angle increases, the height difference between the blue bars (plain flap) and green bars (FishBAC) grows continuously. A smaller boundary layer is generally associated with less (pressure) drag and hence a better glide ratio that explains the increase in aerodynamic efficiency observed in Figure 20.
To better understand the relationship between boundary layer thickness and drag, it is worth reviewing the underlying aerodynamic principles. One of the fundamentals of aerodynamics is that drag on an aerodynamic body can be divided into pressure and skin-friction components. Blunt bodies experience much more pressure drag than streamlined bodies due to more intense flow separation. According to Anderson [27], this is because for a fully attached flow, the airfoil experiences perfectly balanced forces, which result in no net pressure, that is, zero pressure drag. This is not the case for a partially detached flow, as there will be an imbalance of the forces acting on the airfoil, and the resulting net force will push the airfoil backwards. This force is known as pressure drag.
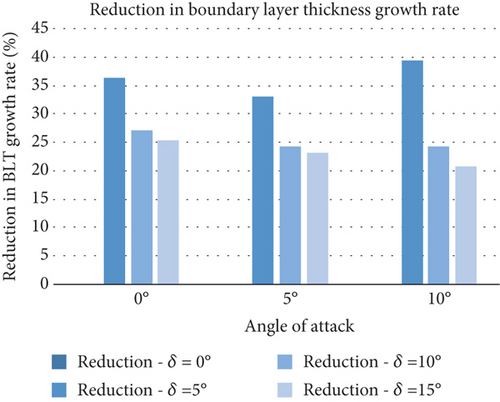
Therefore, to improve performance and reduce drag, a small growth rate of the boundary layer thickness is desired. This was assessed in Figure 22, where the growth rate for the FishBAC is consistently lower than that of the plain flap, leading to a reduction in growth rate of up to 39% (at δ = 5° and α = 10°).

6. Conclusion
The effectiveness of flexing TE devices is becoming the subject of even more research and investigative studies in recent years. Their aerodynamic benefits are evident in a multitude of research outcomes. The FishBAC concept in particular has seen significant attention within the aerodynamic community.
In the current study, the aerodynamic characteristics of the FishBAC morphing concept have been compared and evaluated against a conventional wing model with a plain flap system. The level of aerodynamically effective performance of the FishBAC was quantified in terms of glide ratio and boundary layer growth. The CFD analysis of the boundary layer growth rate and wake has given a better understanding and consistent correlation of the efficacy of the morphing camber. The boundary layer characteristics within the trailing morphing have been reflected in the corresponding lift and drag forces and ultimately on the glide ratio. A smaller boundary layer growth rate has generally led to better efficiency characteristics of the morphing wing. The smaller boundary layer thickness was consistently related to the lower drag of the morphing wing (at high AoA). In contrast, the plain flap model experienced higher drag that is related to a higher boundary layer thickness. As such, the overall efficiency characteristics of the plain model are inferior to those of a morphing concept.
- •
The FishBAC design has shown an increase in the lift coefficient of up to 25% as well as drag reductions of up to 37%. This has resulted in a maximum improvement of the aerodynamic efficiency (i.e., glide ratio) of up to 50% at higher tail deflections.
- •
At high AoAs and flap deflection angles, a 20%–25% reduction in boundary layer growth rate resulted in an approximately 40% drag reduction. This improvement is also scalable and could therefore be used to improve the design with the aim of achieving specific performance characteristics.
- •
The airfoil geometrical features, such as the maximum thickness of 15% of the NACA 4415 wing model used in the current study, have been a positive factor in obtaining improved efficiency in the performance.
- •
The stall characteristics of high thickness and high camber FishBAC wing design need further investigation, as for high-thickness and high-camber wing sections (airfoil), the performance may not supersede wings of lower thickness and camber.
Nomenclature
-
- FishBAC
-
- Fishbone active camber
-
- AoA
-
- angle of attack
-
- HLD
-
- high-lift devices
-
- DAQ
-
- data acquisition system
-
- NI
-
- National Instrument
-
- DLR
-
- the German Aerospace Centre
-
- EMC
-
- elastomeric matrix composite
-
- TE
-
- trailing edge
-
- PF
-
- plain flap
-
- FB
-
- FishBAC
Symbols
-
- yt
-
- airfoil thickness distribution
-
- t
-
- airfoil thickness
-
- x
-
- nondimensional chord length
-
- yc
-
- airfoil camber line deflection coordinate
-
- wte
-
- maximum vertical deflection of airfoil camber line
-
- θ
-
- local slope of the airfoil camber line
-
- xu
-
- airfoil’s upper surface x-coordinate
-
- xl
-
- airfoil’s lower surface x-coordinate
-
- α
-
- angle of attack
-
- δ
-
- tail/flap deflection
Conflicts of Interest
The authors declare no conflicts of interest.
Funding
This research work was supported and funded by the School of Computing, Engineering, and Physical Sciences (CEPS), University of the West of Scotland (UWS).
Acknowledgments
This research work was supported and funded by the School of Computing, Engineering, and Physical Sciences (CEPS), University of the West of Scotland (UWS).
Open Research
Data Availability Statement
The data used to support the findings of this study are available from the corresponding author upon request.


