Optimal Integration of Renewable Energy–Based Distributed Generation Units in Radial Distribution System
Abstract
Determining the optimal integration of renewable energy–based distributed generation units (DGUs) in electric distribution systems brings many positive technical and economic impacts and contributes significantly for improving the performance of the distribution system. The suitable installation of DGUs is always a challenging problem because the output behaviors of DGUs, specifically photovoltaic units (PVUs) and wind turbine units (WTUs) are strongly affected by stochastic natural conditions. In this study, the main purpose is to address optimal nonlinear constrained problems with three targets in the multiobjective function (MOF) for minimizing (1) total power loss, (2) voltage deviation, and (3) the cost of purchasing energy from the main grid considering the uncertainties of solar irradiance and wind speed in the actual region in Binh Thuan Province, Vietnam. This paper solves three problems related to optimal connection of DGUs in the distribution system considering constant power generation and consumption with unity power factor (PF) (Problem 1), constant power generation and consumption with optimal PF (Problem 2), and time-varying power generation and consumption with optimal PF (Problem 3). Besides, this research also proposes a novel meta-heuristic optimization algorithm called revised coyote optimization algorithm (RCOA) for addressing the optimization problems of the simultaneous integration of DGUs in IEEE 69-bus radial distribution system. The obtained results in above three problems are compared with the original and published methods to demonstrate the superior economic and technical benefits of the proposed method.
1. Introduction
The rapid increase of demand has posed many challenges for ensuring electricity supply to domestic and productive activities, and the penetration of distributed generation sources is seen as an excellent solution for solving this problem. Realistically, main power plants often use fossil energy with high operating cost due to the scarcity of fuel sources and also cause negative impacts on the environment through emissions [1]. In addition, large-scale generation sources are primarily located far from the consuming loads, so transmission and distribution processes have expensive investment cost, high power losses, voltage sag, and unguaranteed system reliability [2]. Therefore, connecting distributed generation units (DGUs) in the distribution systems is a great solution for these problems [3, 4]. Based on the unique characteristics of DGUs, they can be divided into asynchronous generators, synchronous generators, and induction generators. While asynchronous generators require electronic interfaces to process the electric power which supplies to the grid, induction generators require reactive power support from the grid and/or connected capacitors, and synchronous generators are capable of generating or absorbing reactive power [5]. Nowadays, many countries around the world have always had policies to encourage the integration of DGUs, especially renewable energy DGUs into the nation’s power grid. These units are energies that derived from natural sources such as solar energy, wind energy, hydropower, geothermal energy, and bioenergy. Integration of DGUs can bring great benefits, but unplanned penetration will cause unwanted impacts on the system such as increased operating costs, large total power loss, overvoltage, and increased harmonics [6]. Thus, determining the connection of DGUs into the electric distribution system to maximize benefits without negative effects is extremely important in evaluating the economic, technical, and environmental efficiencies of the power distribution system. The huge potential benefits from integrating DGUs into the system have been carefully studied in the literature. Researchers [5, 7, 8] have proposed the most popular approaches such as genetic algorithm (GA), particle swarm optimization (PSO), and simulated annealing (SA) for determining the optimal location and sizing of photovoltaic units (PVUs) to minimize power losses on distribution branches as the main target. GA, PSO, and SA are outdated algorithms, but they are widely used for solving many different optimization problems due to their simple structure. However, the main disadvantage of these methods is easily fall into local optima due to its poor exploration. Hence, the performance and stability of the algorithms are not guaranteed [9]. Other authors have also applied swarm-based meta-heuristic algorithms such as ant colony optimization (ACO) algorithm [10] and artificial bee colony (ABC) algorithm [11] for finding effective solutions to the problem of integrating PVUs for minimizing losses and improving voltage profile simultaneously. The computational process of these algorithms is simple but time-consuming, specifically during the phase of pheromone spreading on trails by ants in ACO and the sequential execution of all three bee groups: forager bees, observer bees, and scouts in ABC. With the same goals as the above studies and an expansion in considering the influence of harmonic distortions in the system, authors in [12, 13] introduced a powerful method called biogeography-based optimization (BBO) for determining the suitable connection of three DGUs in various distribution systems. This study also demonstrates the effectiveness of integrating DGUs to minimize branch losses, enhance bus voltages, and mitigate harmonic distortions from nonlinear loads in the electric distribution system. BBO is an evolutionary optimization algorithm based on biogeography science with the operating principle inspired by the migration and immigration of species in nature. BBO has many advantages in avoiding local traps and finding feasible solutions, but its biggest drawback is that it depends mainly on initial setting parameters and has the relatively slow data processing speed. Besides, another interesting study for finding possible solutions of installing wind turbine units (WTUs) and superconducting magnetic energy storages (SMESs) is also shown in the study by authors in [14]. The research has proven technical benefits in reducing power loss, mitigating voltage deviation, and improving voltage stability through using equilibrium optimizer (EO) as a main approach. Compared with other traditional meta-heuristic methods, EO with a better equilibrium mode has outstanding advantages such as flexibility and adaptability in solving optimization problems [15]. However, this method needs further improvements to enhance performance and stability as compared to modern methods for handling complex problems with a large research area. Moreover, the research [16] also presented a multiobjective artificial electric field algorithm (MOAEFA) for proposing the optimal solutions of wind turbine allocation in the distribution system with the same target as in the study by authors in [15]. The best solution in the multiobjective function (MOF) in this study are based on the fuzzy decision-making method and performed on various types of distribution systems to demonstrate the effectiveness of the proposed method compared to others. Besides technical aspects, economics have also taken attention; researchers in [17] considered the simultaneous integration of WTUs and energy storage systems (ESS) in smoothing the output power of WTUs to maximize the achieved benefits. Total operating cost and power losses of the network are considered as the main objectives of this paper. Similarly, the study by authors in [18] also considered additional costs of investment and maintenance for the system when connecting DGUs and capacitors. However, these studies have not yet fully considered technical-economic aspects. In addition, to enhance the quality of potential solutions, the authors in [19] also suggested an active algorithm called jaya algorithm (JA) for addressing the problem of determining optimal capacity of renewable energy sources such as PVUs, WTUs, and fuel cell units (FCUs) in the electric distribution systems considering the economic aspect. JA is a good method, but its effectiveness depends heavily on setting parameters, so it is not favored to select for tackling many optimization problems. The main target of the paper is to minimize the total annual cost including two different costs of the annual capital cost and the annual maintenance cost. However, this study did not pay much attention to other important factors as harmonic distortions and operating power factor (PF) of inverter-based DGUs. Another interesting study on DGU integration has been published in recent years, which has also made a significant contribution [20]. In that paper, the authors have succeeded in determining the solution for the optimal connection of PVUs with the minimum number of voltage regulator tap changes in IEEE 123-bus test feeder. Coyote optimization algorithm (COA) has also been applied as an active tool for solving the optimization problem of that study. The collected results have showed the superiority of COA over four other compared methods including GA, PSO, BBO, and gray wolf optimizer (GWO). Although COA has great potential in addressing various optimization problems efficiently, for large-scale systems with many control variables, the algorithm efficiency should be improved. Besides, the power quality of the system is also important and should be considered, but it was ignored in that paper.
In general, most previous works have focused on strengthening the technical indices after connecting DGUs for the main purpose of minimizing power loss and improving voltage profile, and only a few papers in recent years have studied economic indices. Comprehensive consideration of the economic and technical factors of power distribution systems with integrating DGUs has not yet really attracted many researchers around the world. However, this is important because it makes a significant contribution to determine the suitable strategies for integrating DGUs with maximum benefits. On the other hand, the past studies often only simulated the peak load level and very few studies considered the time-varying models for load demand and the output power of connected generation units due to its complex characteristics. Considering one load level seriously affects the quality of the found solution because it may not achieve optimality at different load levels. Therefore, considering these variations is important in addressing the optimization problem of installation of DGUs. Furthermore, in addition to determine the appropriate location and capacity of DGUs, the operating PF of DGUs is also necessary for identifying the best value to maximize the benefits, but it has hardly received much attention in the past. Finally, most of the studies often only used old optimization algorithms with low efficiency, leading to poor quality of the found optimal solutions. Thus, a novel optimization algorithm with good efficiency, stability, and convergence characteristic is highly appreciated.
- •
This research proposes a novel method called revised COA (RCOA) which is considered as an improved version of COA. In the original algorithm, new solutions are generated according to the group’s best solution and the group’s central solution [20]. This has many advantages in determining optimal solutions that lie around the zero point. However, in many practical problems, the optimal solution may be nonzero, so the central solution will not be a positive choice in all cases. Besides, determining the central solution of the group is also time-consuming due to calculating the average value of the control variables in the group solutions. Therefore, the modification is implemented to improve the efficiency and the convergence speed of the algorithm.
- •
Moreover, this research considers the MOF related to total power loss, voltage deviation, and grid electricity purchase cost. The weighted sum method (WSM) is used to determine the best compromise solution [12]. However, in WSM, the values of weighing coefficients are important and should be determined appropriately. Therefore, the weighting coefficients of the three single objectives in MOF are investigated with four different scenarios for selecting the best values. The best results from these investigated scenarios are evaluated through the fitness function of each scenario for finding the appropriate value for each weighting coefficient. This is also considered as one of the main contributions of this study in determining the suitable weighting coefficients in MOF that previous studies have ignored.
- •
In this study, the proposed algorithm is applied to solve three different optimization problems. Specifically, the first problem is to determine the optimal location and sizing of three DGUs for minimizing the total power loss of the system with constant generation and load demand considering unity PF. The optimal solution from the proposed method has also been compared with 11 previously published methods and original COA to evaluate the effectiveness of the algorithms fairly and objectively. This research has also considered the stability of the proposed algorithm by collecting the results of fitness values in 50 random runs of implemented methods. The simulation results have indicated that RCOA not only has better performance but also has excellent stability compared to others. This is also considered as a complete analysis compared to works in the past.
- •
In order to increase the economic and technical benefits obtained through the penetration of DGUs in the distribution network, the second problem is implemented to identify the best value for the operating PF. The simulated results have also proven the great benefits in minimizing power losses and improving the voltage profile of the system by determining the optimal values of placement, sizing, and PF of each DGU. The determination of the optimal parameter for the operating PF of DGUs is still limited in previous studies, so, this is also considered a highlight compared to the previous studies.
- •
Furthermore, in order to enhance the quality of the found optimal solution, the third problem is simulated for determining the optimal installation of DGUs including the operating PF with considering the time-varying generation and consumption. In this problem, Beta and Weibull distribution functions are applied for probabilistic simulation of solar radiation and wind speed to predict the output power of photovoltaic modules and wind turbines, respectively. Data on solar radiation and wind speed are also collected in the actual area in Tuy Phong District, Binh Thuan Province, Vietnam, in three years (2019, 2020, and 2021). This problem is also an important contribution in improving the effectiveness of the found solution in practical application.
The remaining contents of this paper can be structured as follows: Section 2 shows the stochastic properties of PVU and WTU, and the hybrid renewable energy system structure. Section 3 mentions the objective function and technical constraints in this study. Section 4 introduces the proposed method. Then, Section 5 presents and analyzes the simulation results. Finally, Section 6 is the conclusion for the whole paper.
2. Simulating Uncertainties and the Hybrid Renewable Energy System Structure
The study implements the simultaneous integration of solar and wind power sources in the distribution system considering the uncertainties of solar irradiance and wind speed. To improve the accuracy of the solution, the Beta and Weibull probability distribution functions (pdfs) [21] are appropriately applied for simulating the stochastic characteristics of solar irradiance and wind speed to serve the predicting output power for photovoltaic modules and wind turbines, respectively. For this work, the simulation data are taken in the southern region of Vietnam (Tuy Phong District, Binh Thuan Province, Vietnam). The hourly values are collected over the three years 2019, 2020, and 2021 from NASA datasets [22].
2.1. Modeling the Output Power of Photovoltaic Module
2.2. Modeling Output Power of Wind Turbine
2.3. The Structure of the Hybrid Renewable Energy System
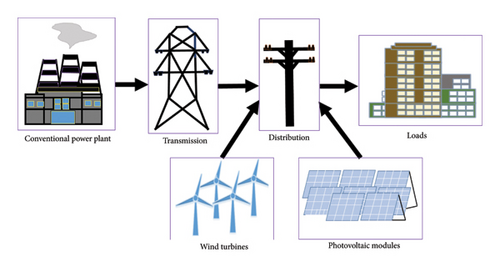
In this study, DGUs are connected in the distribution grid for supplying electric power to the loads. If the generated power from DGUs is not enough, the deficiency will be compensated by the main grid. The general structure of the hybrid system can be described in Figure 1.
3. Problem Formulation
Integrating DGUs into the distribution systems can bring great benefits if the suitable connection is determined. For maximizing benefits, technical and economic aspects should be considered as objective functions considering technical constraints. As mentioned, this study considers three different optimization problems, and they can be briefly described in Figure 2.

3.1. Objective Function
3.2. Constraints
- •
To maintain a stable energy supply in the grid, power generation should be equal consumption. Thus, the reactive and active power balance constraints are described mathematically as follows [27]:
()() - •
The voltage at each bus should not violate the minimum and maximum allowable voltage limits of 0.95 (pu) and 1.05 (pu), respectively [21].
() - •
The apparent power on each branch must not be greater than its maximum thermal limit [25].
() - •
The PF of inverter-based DGUs is kept within the operating range from 0.8 to unity (lagging or leading) [1].
() - •
The penetration limit of DGUs in the distribution system is represented in the following equation [14]:
() - •
The capacity and location limits for installing DGU are also shown in the following equations [12]:
()()
4. Proposed Method
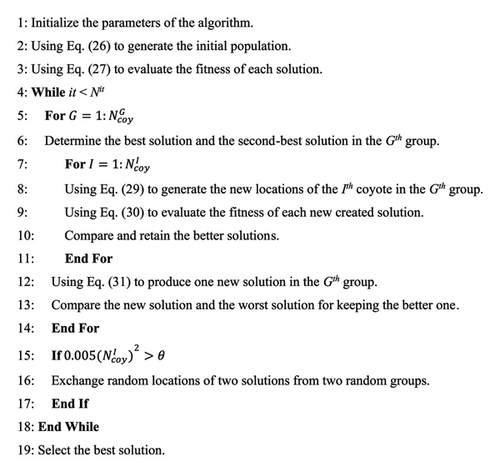
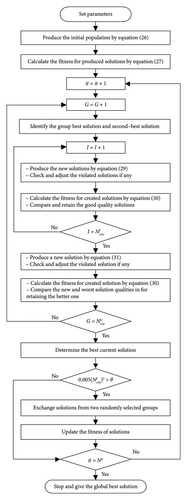
Solving real-world optimization problems using meta-heuristic algorithms is becoming increasingly popular, and the quality of found possible solutions depends mainly on the efficiency of the applied algorithms. Therefore, developing novel algorithms or modifying old algorithms to enhance performance and stability is always encouraged. In 2018, a powerful population-based algorithm was first introduced by Pierezan et al., and it was called COA [20]. This algorithm is inspired from the behavior of coyote community that lives mainly in North America with intelligent family structure and environmental adaptability. COA has many great advantages in balancing exploration and exploitation, so it greatly contributes to search feasible solutions with higher quality than others. In nature, coyotes have very good hunting ability thanks to their sharp sense of smell. This species often separates into groups to facilitate hunting and support each other to protect their operating zone from outside threats, and they can move suddenly from their current place to another to suit changing circumstances. Thus, its population will be the product of the groups () and the individuals in each group () [28]. Although COA is an effective algorithm in addressing many optimization problems, it should still be modified to solve complex problems with large search spaces. Modification in the main equation that generate the new solutions in the original algorithm is called RCOA. RCOA not only inherits the outstanding advantages of COA but also promotes more positive points to improve the performance of the algorithm.
If the above condition is satisfied, the positions of two random solutions in two randomly selected groups will be swapping positions. This exchange rate primarily depends on the number of individuals in each group. The larger the member number, the higher the exchange rate and vice versa.
The pseudocode and the flowchart of the proposed method for addressing the optimization problem are briefly presented in Figures 3 and 4, respectively [20]:
5. Simulation Results and Discussion
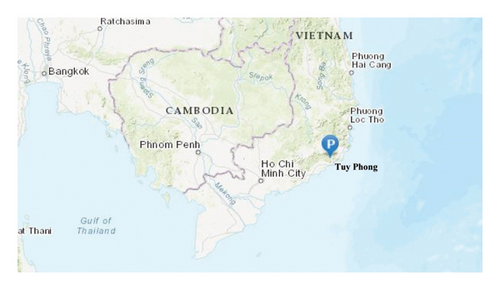
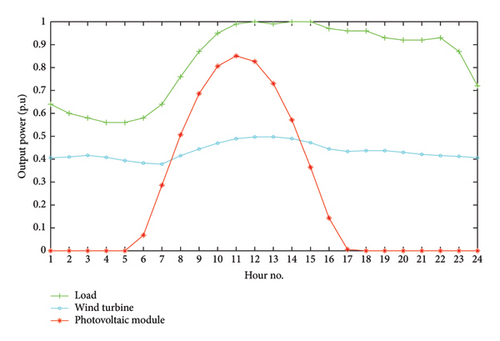
This paper proposes a novel efficient method, called revised RCOA, for determining the location and capacity of DGUs to maximize benefits. The main target of the research is to minimize total power loss, improve voltage profile, and reduce the cost of purchasing electricity from the grid. The study region is chosen as Tuy Phong District, Binh Thuan Province, Vietnam, where there is great potential for exploiting renewable energies, as shown Figure 5. Data on solar irradiance and wind speed are collected in 2019, 2020, and 2021. Besides, for simulating time-varying load, the load data are referenced from the study by authors in [29]. The output curves for wind turbine, photovoltaic, and load are shown in Figure 6.
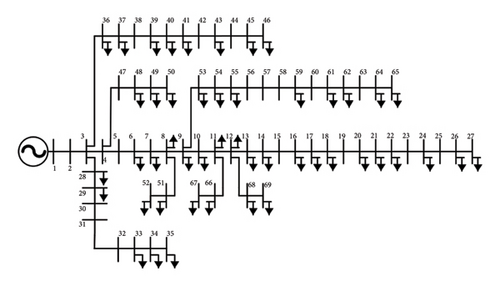
For this work, three different optimization problems are performed. In the first problem, three DGUs are operated at unity PF, and their power generation is at rated power. Hence, these DGUs only generate active power to the grid. In the second problem, three DGUs are operated at the optimal PF, and their power generation is at rated power. In this case, DGUs generate both active and reactive power. In the first and second problems, DGUs can be considered as PVUs with the maximum penetration level of up to 2.0 MW per unit and the location-related variable for each unit is from Bus No. 02 to Bus No. Nbs. For the third problem, time-varying power generation is considered for connecting one PVU and one WTU. In this case, the power generation search region for each PVU is [2000, 40,000] modules with the rated power of 100 W/module and for each WTU is [01, 30] turbines with the rated power of 200 kW/turbine. In this study, the test system is selected as IEEE 69-bus distribution system, and the system structure is presented in Figure 7 with total power loss of 0.2245 MW, and total load of 3.8019 MW and 2.6941 MVar [12]. Besides, Backward/Forward Sweep Method (BW/FWSM) is also used to solve the load flow problem in the radial distribution system [30]. BW/FWSM has many superior advantages about accuracy and calculation speed in the load flow analysis compared to conventional methods such as Gauss–Seidel method and Newton–Raphson method [31].
To objectively evaluate the performance of the proposed method, the obtained result from RCOA is also compared with many published methods and original method. For the simulation in this paper, implemented methods (RCOA and COA), , are chosen to be 4 and 5, respectively. Due to the stochastic nature of the population-based algorithms, 50 independent trial runs with randomly generated initial population are performed to determine the best solution. The number of iterations (Nit) is chosen as 100, 110, and 130 through a survey for Problem 1, Problem 2, and Problem 3, respectively. In the first two problems, the optimal sizing of DGUs is searched in the range from 0.0 MW to 2.0 MW. For the remaining problem, the technical parameters are selected as for computing output power of each photovoltaic module, and for calculating output power of each wind turbine.
5.1. Problem 1: Constant Generation and Load Demand Considering Unity Power Factor
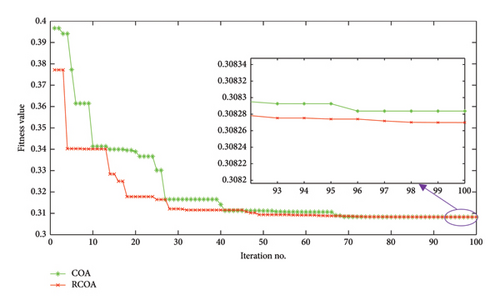
In this problem, the first objective of minimizing total power loss in MOF is implemented with the integration of three DGUs that have constant generation and load demand considering the unity PF to determine the global solution. The worst, best, and average fitness values in 50 independent test runs are determined and presented in Table 1. Obviously, for the problem of finding the best solution for six variables (three DGU location variables and three DGU capacity variables), the best fitness value of RCOA (0.30827) is only slightly better than the original algorithm COA (0.30828), but the average fitness value from random runs of RCOA (0.30934) is much better than COA (0.30966), as shown in Table 1. The average fitness value in this case is used to evaluate the stability of each algorithm. The more stable the algorithm is, the closer this average fitness value is to the best fitness value. In other words, although RCOA does not have much outstanding performance, it is more stable than the original algorithm (COA) in this first problem. In addition, all fitness values in the test runs of the proposed and original methods are also rearranged in ascending order, as shown in Figure 8. In detail, the plotted curve by found fitness values from RCOA lies below the curve of COA, i.e., RCOA gets better values in trial runs. This strongly contributes to affirming the stability of RCOA compared to COA. Not only that, convergence characteristics of two implemented methods are also compared, as shown in Figure 9. In this case, RCOA converged at the 48th iteration, COA converged at the 69th iteration, and during the iteration process from 01 to 100, the fitness values through each iteration of RCOA are also lower than COA. Thereby, it indicates that an improvement in RCOA has been effective, and RCOA not only improves performance and stability but also enhances convergence speed compared to the original algorithm.
| Algorithm | The best fitness | The average fitness | The worst fitness |
|---|---|---|---|
| COA | 0.30828 | 0.30966 | 0.31719 |
| RCOA | 0.30827 | 0.30934 | 0.31352 |

The obtained solution for the optimal integration of three DGUs from the proposed method is also compared with 12 different methods, and the numerical results are presented clearly in Table 2. The optimal solution from RCOA can cut total power loss from 224.5 to 69.207 kW, and this value is not only lower than COA of 69.210 kW but also lower than 11 published methods of EA [32], EA-OPF [32], EOPF [32], AM-PSO [33], TLBO [34], QOTLBO [34], SFS [35], CMSFS3 [35], IA [36], CF-PSO [37], and DE [1] with variable total power loss from 69.423 to 82.172 kW. Besides, the loss reduction is also calculated and mentioned in Table 2. Obviously, the loss reduction from RCOA is 69.173%, and it is the highest compared to the other methods, 69.171% to 63.48%. This proves that the solution from the proposed method is the best as compared to the previously published and original methods in determining the optimal location and sizing of DGUs in the distribution system.
| Algorithm | Optimal location and sizing of DGUs | Total power loss (kW) | Loss reduction (%) | ||
|---|---|---|---|---|---|
| DGU No. 1 (kW) | DGU No. 2 (kW) | DGU No. 3 (kW) | |||
| EA [32] | Bus: 61–1795 | Bus: 18–380 | Bus: 11–467 | 69.62 | 69.06 |
| EA-OPF [32] | Bus: 61–1719 | Bus: 18–380 | Bus: 11–527 | 69.43 | 69.14 |
| EOPF [32] | Bus: 61–1719 | Bus: 18–380 | Bus: 11–527 | 69.43 | 69.14 |
| AM-PSO [33] | Bus: 11–510 | Bus: 17–380 | Bus: 61–1670 | 69.54 | 69.09 |
| TLBO [34] | Bus: 62–1160.1 | Bus: 61–990.1 | Bus: 13–1013.4 | 82.172 | 63.48 |
| QOTLBO [34] | Bus: 63–1002 | Bus: 61–1147 | Bus: 15–8114 | 80.585 | 64.18 |
| SFS [35] | Bus: 61–1719 | Bus: 11–527 | Bus: 18–380 | 69.428 | 69.14 |
| CMSFS3 [35] | Bus: 11–527 | Bus: 61–1719 | Bus:18–380 | 69.428 | 69.14 |
| IA [36] | Bus: 61–1700.0 | Bus: 17–510.0 | Bus: 11–340.0 | 69.962 | 68.91 |
| CF-PSO [37] | Bus: 61–1806.2 | Bus: 17–511.0 | Bus: 50–719.0 | 70.188 | 68.81 |
| DE [1] | Bus: 61–1718.7 | Bus: 18–381.1 | Bus: 11–525.2 | 69.423 | 69.15 |
| COA | Bus: 11–554.8 | Bus: 18–363.2 kW | Bus: 61–1716.6 | 69.210 | 69.171 |
| RCOA | Bus: 11–536.6 | Bus: 18–370.7 kW | Bus: 61–1720.1 | 69.207 | 69.173 |
5.2. Problem 2: Constant Generation and Load Demand Considering Optimal Power Factor
To check the effectiveness of the proposed method in the case of large number of variables, this second problem is performed. In this case, in addition to the location and capacity of the three DGUs being searched, the optimal PF of the three DGUs is also determined with constant generation and load demand to minimize total power loss and improve voltage profile. The obtained results from the proposed method are compared with the original method and three published powerful methods.
As shown in Table 3, the optimal solutions including location, capacity, and PF from the methods are presented clearly. Thanks to the suitable installation of DGUs, the total power loss has been reduced significantly from 224.5 to 4.159, 4.164, 4.268, 5.168, and 5.071 kW for RCOA, COA, DE [1], CF-PSO [37], and IA [36], respectively. Besides, the reduction in total power loss is also calculated. It is 98.152% for ROCA, and this value is the highest compared to the remaining methods, from 97.70% to 98.149%. This indicates that the proposed method is still a powerful method in addressing the problem of optimizing integration for DGUs in the distribution system considering the optimal PF.
| Algorithm | Optimal location and sizing of DGUs/optimal power factor | Total power loss (kW) | Loss reduction (%) | ||
|---|---|---|---|---|---|
| DGU No. 1 | DGU No. 2 | DGU No. 3 | |||
| IA [36] | Bus: 61–2073.0 kW/OPF: 0.820 (lagging) | Bus: 17–622.0 kW/OPF: 0.820 (lagging) | Bus: 50–829.0 kW/OPF: 0.820 (lagging) | 5.071 | 97.75 |
| CF-PSO [37] | Bus: 61–2086.0 kW/OPF: 0.8318 (lagging) | Bus: 18–613.4 kW/OPF: 0.8279 (lagging) | Bus: 50–845.4 kW/OPF: 0.8276 (lagging) | 5.168 | 97.70 |
| DE [1] | Bus: 61–2057.8 kW/OPF: 0.8140 (lagging) | Bus: 18–454.9 kW/OPF: 0.8340 (lagging) | Bus: 11–608.8 kW/OPF: 0.8130 (lagging) | 4.268 | 98.10 |
| COA | Bus: 61–1665.3 kW/OPF: 0.8118 (lagging) | Bus: 21–323.7 kW/OPF: 0.8171 (lagging) | Bus: 11–582.4 kW/OPF: 0.8442 (lagging) | 4.164 | 98.149 |
| RCOA | Bus: 61–1675.0 kW/OPF: 0.8140 (lagging) | Bus: 21–336.9 kW/OPF: 0.8112 (lagging) | Bus: 11–552.5 kW/OPF: 0.8315 (lagging) | 4.159 | 98.152 |
Besides power loss reduction, voltage profile is also greatly improved, thanks to the appropriate integration of DGUs in the distribution system as plotted in Figure 10. In the base system, the lowest bus voltage is 0.9092 (p.u), and many bus voltages violated the constraint of [0.95, 1.05] (p.u); however, the profile voltage of the system has enhanced significantly with a minimum voltage value of 0.9943 (p.u) after applying the optimal solution of the best method (RCOA).
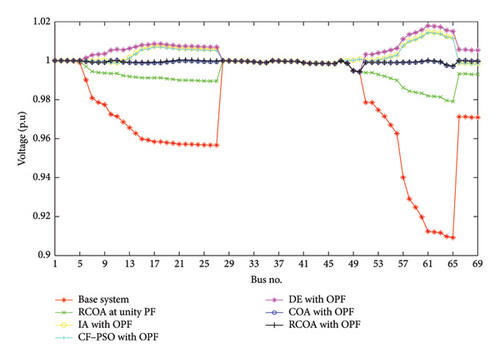
As mentioned, this study considers DGUs at unity PF and DGUs at optimal PF. These two types of DGUs have significant effects on the obtained benefits at Problem 1 and Problem 2. Specifically, the voltage at the bus profile is dramatically enhanced from [0.9092, 1.0] (p.u) to [0.9790, 1.0] (p.u) and [0.9943, 1.0001] (p.u) after connecting DGUs at unity PF case and optimal PF case, respectively. The obtained results on voltage improvement showed that the case of DGUs at optimal PF will have a better voltage profile than the case of unity PF. Besides, the total power loss is also significantly decreased with integrating DGUs in the distribution system. The total loss from the proposed method’s solution in the case of DGUs at unity PF is up to 69.207 kW, while the total power loss in the case of optimal PF is only 4.159 kW, saving to 65.048 kW (corresponding to 71.025% in loss reduction). This result also indicated that considering the optimal PF not only improves the voltage profile but also contributes significantly in reducing the loss and thereby cutting costs in the operating system.
5.3. Problem 3: Time-Varying Generation and Load Demand Considering Optimal Power Factor
In order to demonstrate the effectiveness of the proposed method in more complex optimization problems, the third problem is also implemented. In this case, COA and RCOA are applied to determine the optimal solution of location and capacity for DGUs (including PVU and WTU), considering time-varying generation and load demand with optimal PF. Data on generation and demand changes over time are presented in Figure 6. The MOF of this problem is to focus on both economic and technical factors for minimizing total power loss, reducing the voltage deviation, and cutting the cost of purchasing electricity from the grid for load demand.
To have an appropriate output compromise value for maximizing the achieved welfare, the WSM is applied in MOF, as mentioned in formula (13). The weighing coefficients (σ1, σ2, and σ3) should be determined according to the importance of each component in MOF, and these coefficients are defined by the user [12]. In this study, the component related to the cost of purchasing electricity from the main grid (OF3) is considered to be more important than the two components related to total power loss (OF1) and voltage deviation (OF2), and OF1 is more important than OF2 as assumed. In WSM, the more important a component is, the larger the weighting coefficient of that component will be and vice versa. Therefore, each objective function component of OF1, OF2, and OF3 should be predetermined in the potential set of values such as (0.3, 0.4), (0.1, 0.2), and (0.4, 0.5, 0.6), respectively. Moreover, to identify the appropriate combination from weighing coefficients of the components for minimizing the objective function’s value, four different scenarios are also investigated, including (σ1 = 0.4, σ2 = 0.2 and σ3 = 0.4), (σ1 = 0.3, σ2 = 0.2 and σ3 = 0.5), (σ1 = 0.4, σ2 = 0.1 and σ3 = 0.5), and (σ1 = 0.3, σ2 = 0.1 and σ3 = 0.6). The best result from the survey with 50 trial runs by using the proposed method is presented in Table 4. Obviously, the fitness function value (ObjectFF) which decides the solution’s quality from (σ1 = 0.4, σ2 = 0.2 and σ3 = 0.4) is 0.2138, (σ1 = 0.3, σ2 = 0.2 and σ3 = 0.5) is 0.2208, (σ1 = 0.4, σ2 = 0.1 and σ3 = 0.5) is 0.2109, and (σ1 = 0.3, σ2 = 0.1 and σ3 = 0.6) is 0.2094, as shown in Table 4. In which, the set of (σ1 = 0.3, σ2 = 0.1 and σ3 = 0.6) has found the smallest value for ObjectFF compared to other scenarios, so this set is chosen to be the suitable weighing coefficients for this study.
| Different cases of weighing coefficients | σ1 = 0.4 σ2 = 0.2 σ3 = 0.4 |
σ1 = 0.3 σ2 = 0.2 σ3 = 0.5 |
σ1 = 0.4 σ2 = 0.1 σ3 = 0.5 |
σ1 = 0.3 σ2 = 0.1 σ3 = 0.6 |
|---|---|---|---|---|
| ObjectFF | 0.2138 | 0.2208 | 0.2109 | 0.2094 |
Furthermore, this work also considers the influence from PFs of inverter-based PVU and inverter-based WTU in maximizing economic and technical benefits. Previously published studies [38–40] have also suggested that the PF should be 0.85 or 0.9. However, with different PFs, the received benefits will be different, so the study in this case is considered to determine the best PF for each PVU and WTU.
Like the shown numerical results in Table 5, the MOF’s value and its components from applying the optimal solution considering the time-varying generation and consumption with different PFs have been presented. The objective function values (ObjectFF) for evaluating the solution quality with PF cases of 0.80, 0.85, 0.90, and 0.95 and OPF which found by RCOA are 0.2347, 0.2190, 0.2097, 0.2153, and 0.2094, respectively. Obviously, ObjectFF value of the OPF case is the lowest, meaning it is the best in compared cases. Specifically, for objective related to loss reduction (OF1), OF1 index of the OPF case (0.2215) is also better than the two cases of PF = 0.80 (0.2233) and PF = 0.95 (0.2459), but it is worse than the remaining cases of PF = 0.85 (0.2150) and PF = 0.90 (0.2210). This shows that it is more beneficial in terms of loss reduction compared to PF of 0.8 and 0.95. With considering the second objective (OF2), the received OF2 index of OPF case is 0.3087, and it is more beneficial than the compared cases from 0.3142 to 0.3486, except the case of PF = 0.95 with 0.2902. In other words, the OPF case has a better voltage deviation reduction or better voltage profile than the cases of PF = 0.8, 0.85, and 0.90. For remaining objective (OF3), OF3 index of the OPF case is the best with 0.1868, and this proves that applying the optimal solution with OPF saves more operating cost than four compared cases such as PF of 0.8, 0.85, 0.9, and 0.95. In other words, the optimal solution with OPF (0.923 (lagging) for inverter based-PVU and 0.909 (lagging) for inverter based-WTU can bring more benefits on economic and technical aspects. Besides, the obtained results of the best found solution between RCOA and COA are also compared in Table 5. By using the optimal solution of RCOA, ObjectFF value is determined to be 0.2094, and this value is smaller than COA of 0.2098. This means that the found solution by RCOA is greater in maximizing economic and technical benefits. For considering the component objectives, the values (OF1, OF2, and OF3) are (0.2213, 0.3118, and 0.1871) and (0.2215, 0.2215, and 0.1868) for COA and RCOA, respectively. Clearly, the objective values related to voltage profile improvement and electric purchase cost reduction of RCOA are better than COA, and the value associated with loss reduction is slightly worse than COA. In general, the decision value (ObjectFF) for the quality of the found solutions of RCOA is better than COA, so it can be affirmed that the modification in RCOA has brought efficiency compared to COA in this problem. In addition, the benefits for economic and technical aspects from the optimal integration of distributed generation resources are also presented visually in the below figures.
| Case | Optimal solution (PVU and WTU)/power factor | OF1 | OF2 | OF3 | ObjectFF |
|---|---|---|---|---|---|
| RCOA with PF = 0.80 (lagging) |
|
0.2233 | 0.3486 | 0.2215 | 0.2347 |
| RCOA with PF = 0.85 (lagging) |
|
0.2150 | 0.3235 | 0.2036 | 0.2190 |
| RCOA with PF = 0.90 (lagging) |
|
0.2210 | 0.3142 | 0.1868 | 0.2097 |
| RCOA with PF = 0.95 (lagging) |
|
0.2459 | 0.2902 | 0.1876 | 0.2153 |
| COA with OPF |
|
0.2213 | 0.3118 | 0.1871 | 0.2098 |
| RCOA with OPF |
|
0.2215 | 0.3087 | 0.1868 | 0.2094 |
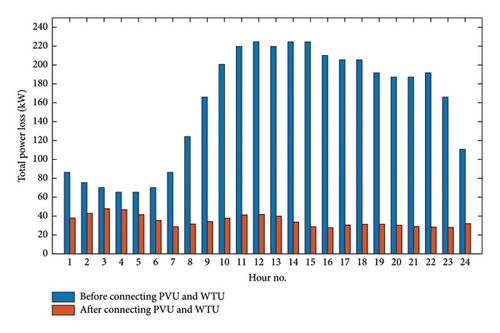
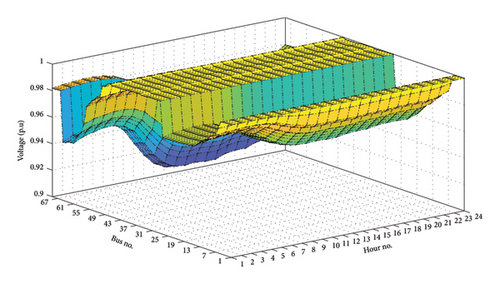
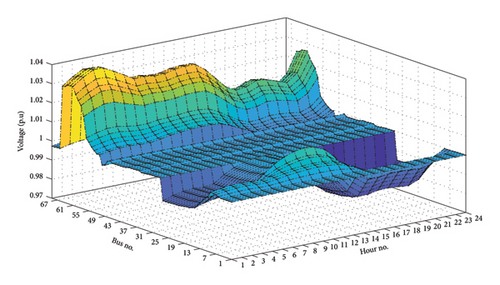
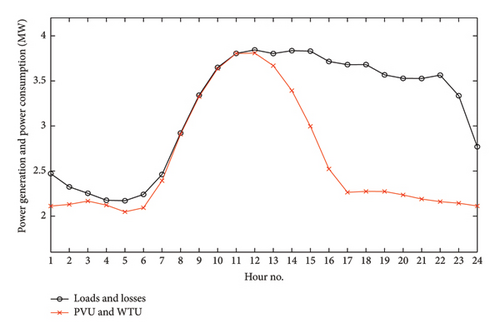
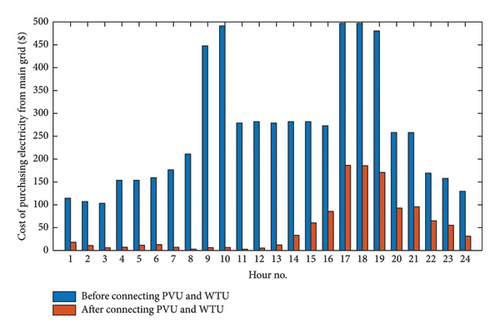
Thanks to the suitable integration of both PVU and WTU with OPF which is proposed by RCOA, significant technical and economic benefits have been achieved well. Specifically, total power loss has decreased strongly from 3.7776 to 0.8366 MW/day, corresponding to a loss reduction of 77.85%, as shown in Figure 11. Besides, the voltage profile has also been dynamically improved. Before connecting distributed generation sources, many bus voltages in the base system violated the voltage limit of [0.95, 1.05] (p.u), especially during heavy load hours with the lowest bus voltage being 0.9092 (p.u), as plotted in Figure 12. However, the appropriate PVU and WTU connection, the voltage profile is strongly enhanced and all bus voltage values only fluctuate in the range of [0.9762, 1.0389] (p.u), as shown in Figure 13. Obviously, this voltage range completely satisfies the stated voltage constraints. These are excellent benefits from the optimal installation of distributed generation sources in the distribution system. In addition, another great benefit that is mainly related to the economic factor is the reduction in the cost of purchasing electricity from the grid for consumption. As shown in Figure 14, the total generation capacity of PVU and WTU is 62.7776 MW/day, while the consumption demand is 79.4354 MW/day. That is, a certain amount of 16.6578 MW will be provided by the main grid through the transformer station. Therefore, the amount of energy deficiency that is compensated from the main grid will be charged by the power company with variable hourly electricity price in Vietnam. During peak hours from 9:00 to 11:00 and 17:00 to 20:00, the is 128.9 $/MWh, at off-peak hours from 22:00 to 4:00, the is 45.4 $/MWh, and at remaining hours, the is 70.0 $/MWh [41]. In this particular case, before connecting PVU and WTU, the entire loads and losses are provided by the main grid so the electricity cost is up to 6240.1719 $/day, but thanks to the penetration of PVU and WTU that cost has been reduced strongly to 1171.4893 $/day, corresponding to 81.23% in cost reduction. The hourly electricity bill reduction is shown in detail in Figure 15. As illustrated in the figure, at daylight peak hours with heavy loads and high electricity price, the cost of purchasing electricity from the grid is quite low, thanks to the simultaneous penetration of PVU and WTU. However, at peak hours of night, the PVU’s output capacity is no longer available, so the amount of power is now supplied to the loads from coordination between the main grid and WTU. This is the main reason for the cost of buying electricity at the night time is higher than the day time in this specific case. In general, power generation from PVU and WTU contributes significantly to reduce the cost in operating the system.
6. Conclusion
This paper has succeeded in introducing an effective meta-heuristic optimization algorithm, called the RCOA, for solving three different optimization problems related to DGUs integration. The first problem was to find the appropriate plan for connecting three DGUs with the unity PF to the distribution system to minimize the total power loss considering fixed consumption and generation. In this case, the optimal solution from the proposed method is compared with the original algorithm (COA) and 11 published algorithms (EA, EA-OPT, EOPF, AM-PSO, TLBO, QOTLBO, SFS, CMSFS3, IA, CF-PSO, and DE). The calculated result for power loss reduction is up to 69.173% for RCOA, and it is higher than all compared algorithms, 63.48% to 69.171%. In addition, the second problem has also been successfully addressed for determining the optimal location, capacity, and PF of DGUs with constant consumption and generation. In this case, the loss reduction from the proposed method can reach 98.152%, and it is not only better than four compared methods as IA (97.75%), CF-PSO (97.70%), DE (98.10), and COA (98.149%) but also greater than the best result of the first problem (69.173%). Moreover, in order to comprehensively consider the economic and technical aspects, the third problem was also performed for finding the optimal solution including location, capacity, and PF of renewable energy generation units (PVU and WTU) considering time-varying consumption and generation. For this case, the study applied the WSM to determine the best compromise solution for MOF related to total power loss, voltage deviation, and grid power purchase cost. The weighting factors were also surveyed and selected appropriately for the optimization problem. The obtained results demonstrated the superiority of the proposed method compared to five different scenarios such as RCOA with PF of 0.80 (lagging), RCOA with PF of 0.85 (lagging), RCOA with PF of 0.90 (lagging), RCOA with PF of 0.95 (lagging), and COA with OPF. Not only that, thanks to RCOA’s solution for simultaneous penetration of PVU and WTU, the loss reduction achieved 77.85%, the operating voltage range was also increased from [0.9092, 1.00] (p.u) to [0.9762, 1.0389] (p.u), and the electricity bill reduction was up to 81.23%.
In summary, the modification in the updated equation of RCOA is already effective, and this new version has become a powerful method in tackling the various problems of optimal installation for DGUs in the distribution system. In the future, further improvements will be implemented to enhance the performance and stability of the proposed algorithm. Besides, the study will also consider the penetration of electric vehicle charging stations in the distribution grid and the harmonic distortions from their power converters. The smart inverters and battery ESS (BESS) will also be connected to maximize the penetration of renewable energy sources while still ensuring that the technical criteria are met. Finally, the large-scale unbalanced and balanced distribution systems will be tested to objectively evaluate the performance of the novel algorithm in solving complex problems with the larger search space.
Nomenclature
-
- i and s
-
- Solar irradiance (W/m2) and wind speed (m/s)
-
-
- Total power loss after and before connecting DGUs
-
-
- Power loss at the jth branch of the kth hour after and before connecting DGUs
-
- Nbr, Nhr, Nbu, and NVar
-
- Branch, hour, bus, and control variable numbers
-
-
- Voltage deviation index of the system after and before connecting DGUs
-
-
- Voltage at the ith bus of the kth hour after and before connecting DGUs
-
- Vnom
-
- Nominal voltage of the system (Vnom is assigned as 1.0 p.u)
-
-
- Cost of purchasing electricity from the grid after and before connecting DGUs
-
-
- Power which is supplied by the grid at the kth hour after and before connecting DGUs
-
-
- The electric price at the kth hour which is stated by the electric power
-
- PSlack and QSlack
-
- Active power and reactive power at the slack bus
-
- PDG,g and QDG,g
-
- Active power and reactive power of the gth DGU
-
- PLd,s and QLd,s
-
- Active power and reactive power of the sth load
-
- PLs,j and QLs,j
-
- Active power and reactive power loss at the jth branch
-
- VMax, VMin, and Vi
-
- Maximum bus voltage, minimum bus voltage, and the ith bus voltage
-
- and Sj
-
- Maximum apparent power and apparent power at the jth branch
-
-
- Maximum and minimum power factors of DGUs
-
- PFDG,g
-
- Power factor of the gth DGU
-
-
- Maximum allowable power, minimum allowable power, and rated power of the gth DGU
-
- χG,I,c
-
- The Ith current solution at the Gth group contains the cth control variable
-
-
- The Ith new solution at the Gth group contains the cth control variable
-
- χG,c,rd1, χG,c,rd2, and χG,c,rd3
-
- The random solutions at the Gth group which are combined from control variables
-
- r, r1, r2, r3, and θ
-
- Numbers are generated randomly from 0 to 1
-
- it and Nit
-
- The current and maximum numbers
-
-
- The electric price at the kth hour
Conflicts of Interest
The authors declare no conflicts of interest.
Funding
This research was supported by Ho Chi Minh City University of Technology and Education, Ho Chi Minh City, Vietnam under grant number T2024-151.
Acknowledgments
This work belongs to the project grant number T2024-151 funded by Ho Chi Minh City University of Technology and Education, Vietnam.
Open Research
Data Availability Statement
The used data are mentioned in the paper.


