Analyzing the Impact of Electric Vehicles on the Power Network of the United Arab Emirates
Abstract
This study investigates the impact of increasing electric vehicle (EV) adoption on the power grid in the United Arab Emirates (UAE), focusing on grid performance, stability, and efficiency under different EV penetration scenarios. A mathematical model is developed to evaluate EV charging load profiles based on energy consumption, charging schedules, and station distribution. The results reveal that level 1 (120 V) charging stations generate a peak load of 93.6 kW, whereas level 2 (240 V) stations impose a significantly higher peak load of 187.2 kW. The study finds that while the existing power grid can support up to 40% EV penetration with level 1 charging, it risks exceeding capacity with level 2 infrastructure. By 2030, a 40% EV penetration with level 2 charging is projected to surpass the system’s margin capacity, increasing the likelihood of voltage instability and transformer overloads. This research is novel in its UAE-specific modeling of EV charging impacts, offering detailed insights into grid constraints under future EV growth. To mitigate these challenges, the study recommends dynamic pricing strategies and vehicle-to-grid (V2G) technology to optimize load distribution and enhance grid resilience. The findings provide essential guidance for policymakers, utilities, and industry stakeholders in developing a sustainable and efficient EV charging infrastructure.
1. Introduction
In today’s world, researchers and engineers are increasingly focused on reducing greenhouse gas emissions and enhancing environmental cleanliness and safety. Conventional vehicles are among the most significant contributors to atmospheric pollution. As of 2019, approximately 1.4 billion motor vehicles were in use globally [1]. These vehicles are well-known for emitting pollutants such as carbon dioxide (CO2), carbon monoxide (CO), nitrogen oxides (NOx), sulfur dioxide (SO2), hydrocarbons, and benzene [2]. Remarkably, in 2020, passenger cars account for 41% of carbon dioxide emissions, making them the primary source of CO2 emissions within the transportation sector [3].
According to [4], Anyos Jedlik is credited with creating one of the earliest electric motor-powered vehicles, a small-scale model car, in 1828. American blacksmith Thomas Davenport followed in 1834 by building a practical electric vehicle (EV) powered by a DC electric motor. Around 1832–1839, Scottish inventor Robert Anderson created a rudimentary electric-powered carriage using nonrechargeable batteries [5]. The creation of the primer effective rechargeable lead-acid battery by Gaston Planté in 1859 significantly improved EV usability [6]. Key contributions to efficient DC electric motors came from Werner Siemens, Antonio Pacinotti, and Zénobe Gramme between 1860–1870 [7]. In the early 1910s, electric car sales peaked in the United States, with over 300 manufacturers producing electric cars by 1942 [8]. General Motors leased the EV1, one of the first modern electric cars, in the mid-1990s [9]. Toyota introduced the Prius, the first commercial hybrid EV, in 1997 [4]. Tesla’s 2008 Roadster, the first highway-legal EV using lithium-ion batteries, revolutionized perceptions of electric cars. The Nissan Leaf became the best-selling all-electric vehicle by 2011 [10]. The Tesla Model S, introduced in 2012, marked a pivotal moment in the EV industry. By the end of 2012, there were over 180,000 rechargeable electric cars globally, representing 0.02% of all passenger cars [11]. Global plug-in EV (PEV) sales exceeded 1 million units in 2015 and reached 3 million units by 2017. In 2018, Europe sold its 1 millionth plug-in electric car, reflecting growing interest and adoption [6].
In 2017, carbon dioxide emissions from road transport in UAE amounted to approximately 40.7 million tons [12] so, in the Middle East, United Arab Emirates (UAE) has set an ambitious target to achieve carbon neutrality by 2050. Dubai has set a target to have 10% of its vehicles be electric or hybrid by 2030 [13]. UAE has successfully transitioned around 20% of its government agency vehicles to EVs [14]. In 2016, EVs accounted for 0.1% of all vehicle sales, equating to 311 EVs sold [15]. In UAE, EV sales are mainly concentrated in Dubai, due to its well-developed charging infrastructure. By the end of 2018, this had resulted in a total of 4000 EVs in Dubai. In 2017, carbon dioxide emissions from road transport in UAE amounted to approximately 40.7 million tons [12]. With the increasing global popularity of EVs from 2010 to 2021, there is an anticipated 4% growth in power demand by 2030 [16].
There are two primary charging strategies for EVs: uncontrolled and controlled. The uncontrolled charging strategy allows residents to charge their EVs at any time, often leading to significant pressure on the local power system during peak evening period. A stochastic model for uncontrolled EV charging, using survey data and trial data-derived conditional probabilities, was introduced to examine these impacts. The study focused on peak EV charging, household consumption correlations, and grid under-voltages, suggesting a fuzzy management system for better coordination [17]. Conversely, controlled strategies of charging, like scheduling, clustering, and forecasting, aim to mitigate the impact of high EV charging demand on the grid. Centralized control systems and real-time schedulers are proposed to optimize charging times and distribute loads effectively, enhancing grid stability and encouraging efficient vehicle-to-grid (V2G) services [18, 19]. Clustering algorithms categorize EV charging behaviors to improve load management, while accurate daily demand forecasting ensures grid reliability [20, 21]. Additionally, advanced charging strategies, such as the load-balancing EV allocation algorithm and coordinated fast charging station planning, are being developed to address the growing EV demand in UAE, ensuring minimal grid impact and efficient resource use [22].
Charging stations are divided into three categories: private, semipublic, and public, with private and semipublic stations typically found in residential or workplace settings, while public chargers are commonly installed in places like airports, train stations, shopping malls, and parking lots [23]. In Dubai, the Dubai Electricity and Water Authority (DEWA) offers three main types of electric car charging stations: public charger, fast charger, and wall box charger. These stations vary in charging duration (CD), kilowatt capacity, and associated costs. The public charger features double Type 2 sockets capable of delivering a 2 × 22 kW AC charge, providing a recharge time of two to 4 h. The wall box charger is an AC station with a single Type 2 socket, also delivering up to 22 kW of power within a similar CD. Fast chargers, commonly situated at petrol stations, have the ability to recharge a battery up to 80% capacity in 20 to 45 min, offering a total charging capacity of 43 kW AC. Additionally, ultrafast chargers with a 150 kW DC capacity can fully recharge an EV in just 15 min, found at select locations like Emirates National Oil Company (ENOC) stations. Home chargers, ranging from 3.6 to 22 kW, are available for residential use, following installation procedures outlined by local utilities [24]. Similarly, Sharjah Electricity and Water Authority (SEWA) provides fast chargers that can recharge 80% of an EV battery within 20 to 45 min, often located at petrol stations for convenience. The expansion of EV charging infrastructure in countries like UAE and Saudi Arabia is expected to include facilities in both residential and commercial buildings, necessitating upgrades to accommodate the growing demand [24].
Uncoordinated EV charging, where users charge their vehicles without centralized scheduling, has been shown to increase peak demand, voltage instability, and transformer overloading, leading to degradation of power quality and potential infrastructure failures. For instance, a 2023 study analyzed the impacts of uncoordinated EV charging and highlighted the severe strain on distribution networks caused by such practices.
Conversely, coordinated charging strategies, which involve optimizing charging schedules and rates, have demonstrated the potential to alleviate these issues. A recent analysis from 2023 emphasized that coordinated charging significantly enhances grid stability by reducing peak loads and preventing overloading. Additionally, innovative distributed coordination approaches, such as those explored in unbalanced distribution grids, further highlight the role of robust communication systems in ensuring reliable and efficient EV integration.
These studies underscore the importance of coordinated charging frameworks to balance the increasing penetration of EVs while maintaining the stability and efficiency of power distribution networks. Incorporating these recent findings strengthens the foundation of this research by providing an up-to-date understanding of charging impacts and solutions in the context of modern power systems.
- •
Developing a comprehensive mathematical model capable of processing multiple variables and producing profiles for EV charging loads. This stage entails practically applying the model to handle the dynamic aspects of EV charging, filling a gap in UAE-specific load profile estimation.
- •
Implementing and analyzing uncontrolled charging strategies for the current penetration of light vehicles and the anticipated EV penetrations in 2030, 2040, and 2050, providing valuable insights for policy and infrastructure planning.
- •
Investigating policies and recommendations to promote the extensive adoption of EVs while safeguarding the steadiness and performance of the current power grid system. This includes suggestions for dynamic tariffs, renewable energy (RE) integration, and V2G technology to address challenges related to grid reliability and efficiency.
- •
Offering insights into the integration of EV load profiles with UAE’s unique climatic and socioeconomic conditions, ensuring a tailored approach to EV infrastructure planning.
2. Methodology
EV market has seen substantial growth in recent years, with expectations that this trend will not only continue but also accelerate over the next decade. Due to the rapid evolution of government policies and the automotive sector, predictions about the rate of EV adoption throughout the next decade vary significantly. The expansion of the EV industry is driven by several factors, including increasing consumer interest, favorable government policies, and greater participation from the automotive industry. Various governments, including that of UAE, have initiated plans to enhance the presence of EVs on the roads. However, a major challenge is that the current power distribution systems may not be sufficiently equipped to manage the anticipated increase in load demand resulting from the influx of EVs into the electrical grid. If the electrical grids are unprepared for this additional requirement, it could lead to overloads within the distribution system, causing severe economic impacts and potential blackouts in some regions. To prevent such issues in UAE, it is essential to accurately predict and define the load demand from EVs, ensuring that the electrical infrastructure can support the increasing demand.
2.1. Survey Findings: Collection and Analyzing Data
This section discusses a survey carried out in UAE, detailing both the questionnaire’s structure and the insights derived from the questionnaire results. The survey included 15 questions, addressing demographic information such as age and area of residence, as well as factors like the number of vehicles in the household, inclination to switch to EVs over the next five years, daily travel distance, arrival and departure times, daily trip destinations, and preferred charging locations. Participants reported a total of 112 trips across 7 different regions in UAE. The survey targeted university students, their family members, and friends and was distributed via university email channels. Privacy and confidentiality of participants were maintained through clear privacy and conditional statements.
2.1.1. Survey Questions
The questions presented to participants in the standard questionnaire are detailed as follows.
2.1.1.1. Age Distribution Among Participants
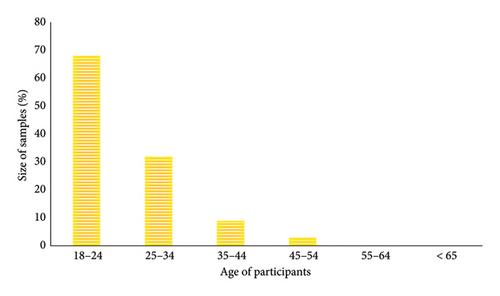
Respondents were given six distinct age categories to choose from, as shown in Figure 1. Notably, over 89% of contributors were under 35 years old, with only a small fraction being older than 35 years. Additionally, in UAE, the immigrant population aged 25–54 years is the largest demographic group, totaling 6.52 million people, significantly outnumbering other age groups.
2.1.1.2. Participants’ Residential Areas
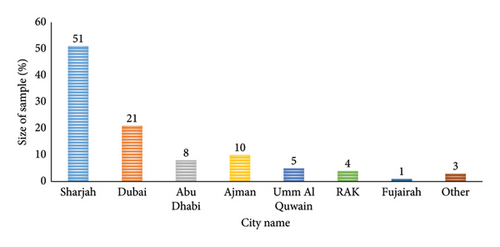
The sample included individuals from seven regions in UAE, depicted in Figure 2. The majority of participants were from Sharjah and Dubai. Dubai has the largest population among the seven emirates, exceeding 3,601,273, due to its global appeal as a prime destination for expatriates. Sharjah follows as the second-largest city, with a population of 1,831,000 [27].
2.1.1.3. Participants’ Gender
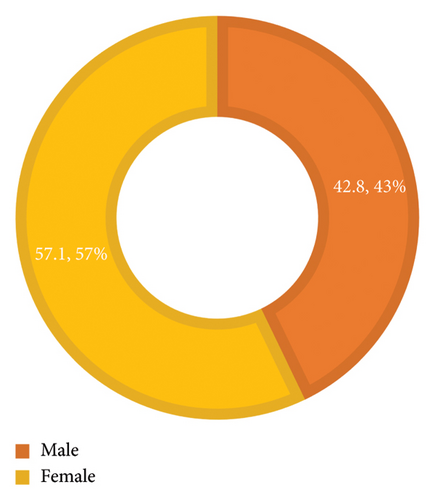
The questionnaire includes respondents of both genders, with females making up nearly 15% more of the questionnaire size than males, as shown in Figure 3.
2.1.1.4. Intent to Purchase an EV in Upcoming Future
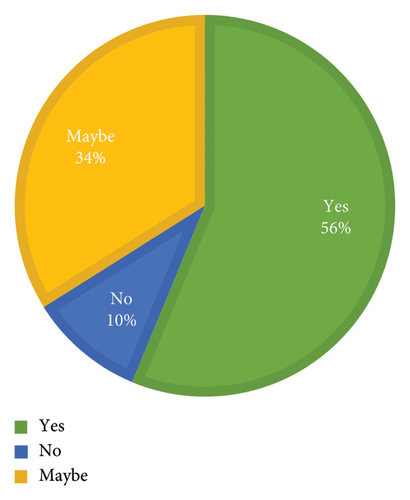
Contributors were provided with alternatives for this question. Figure 4 shows that over 90% of participants either definitely plan or are considering purchasing an EV in the next 5 years, while about 10% do not intend to replace their conventional vehicles with electric ones. This result is consistent with other statistics [28], which indicate that 82% of Italians’ desire to combat climate change influences their decision to own an electric car.
2.1.1.5. Preference for EV Charging Location
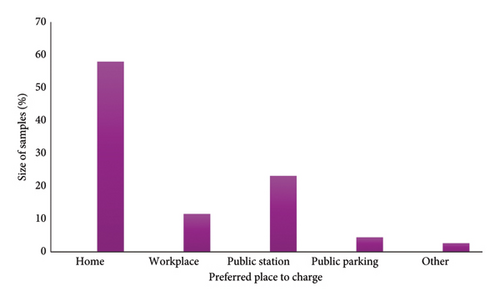
Participants were given four options for their preferred EV charging locations: home, workplace, public station, and public parking. According to Figure 5, nearly 58% of respondents chose home as the optimal place for recharging, followed by public charging stations with 23.2% of the votes. Charging at the workplace ranked third with 11.6%, and public parking was the preferred location for 4.4% of participants. These preferences align with various studies and findings on EV charging behavior. For instance, the U.S. Department of Energy reports that 80% of EV charging occurs at residence, which is consistent with these research results [29].
2.1.1.6. Number of Vehicles per Household
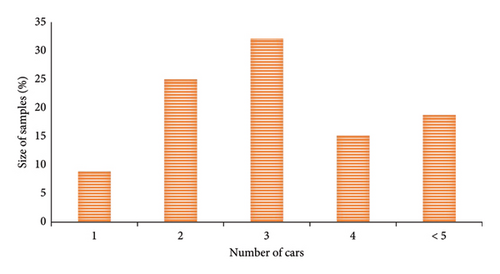
Contributors had five different options to choose from for this question, with the median response being three vehicles. More than 50% of respondents indicated they have 2 to 3 vehicles per household, as shown in Figure 6.
2.2. Mathematical Model Proposed to Estimate the Charging Load Profile
This research aims to strengthen the understanding of EV charging load profiles based on survey data. Due to the diversity of commercially available EVs, grouping vehicles with similar characteristics is crucial for practical analysis. Daily energy consumption is greatly affected by EV battery sizes and ranges. Table 1 presents data on four popular passenger EV models, detailing their battery capacities, driving ranges, and energy usage per kilometer. Given the wide array of over a hundred EV models, it is impractical to include all in this study. Instead, the analysis uses a database of the most popular EVs in UAE market [30, 31]. According to source [32], the Nissan Leaf (NL), Chevrolet Bolt (CB), Tesla S (TS), and Toyota Prius (TP) are the most prevalent EV models on UAE roads.
| EV type | Useable battery (kWh) | Real range (km) | Specific energy (kWh/km) | Maximum power (kW) |
|---|---|---|---|---|
| Nissan Leaf | 39 | 235 | 0.166 | 110 |
| Chevrolet Bolt | 66 | 520 | 0.127 | 150 |
| Tesla S | 87 | 525 | 0.165 | 580 |
| Toyota Prius | 6.6 | 48 | 0.137 | 68 |
Several previous studies [33, 34] have employed a common mathematical framework of uncontrolled EV charging load to evaluate the charging load profiles of EVs. However, there is a significant lack of research using this specific mathematical model to estimate charging load profiles within UAE context. The equations used in this mathematical model are detailed as follows.
Alternatively, the charging process continues until the time of departure, as outlined in (6).
The current number of light vehicles in UAE is 2.7 million cars; thus, 10% is 270,000, 20% is 540,000, 30% is 810,000, and 40% is 1,080,000. The year 2030 is expected to be 2.93 million cars so 10% is 293,000, 20% is 586,000, 30% is 879,000, and 40% is 1,172,000.
In this study, to ensure compliance with the established SAE J1772 standards for residential applications [35], two charging levels were utilized, as detailed in Table 2.
| Type | Voltage (V) | Current (A) | Power (kW) |
|---|---|---|---|
| Level 1 | 120 | 12 | 1.44 |
| Level 2 | 240 | 30 | 7.2 |
3. Results and Discussion
The daily power usage pattern in UAE follows a typical 24 h cycle. Starting from midnight at 0:00 a.m., consumption begins low, gradually increasing throughout the day. By early morning, around 6:00 a.m., there is a sharper rise as businesses and residential areas become active. The peak consumption occurs in the midday to early afternoon, between 12:00 p.m. to 3:00 p.m., likely due to heightened demand for cooling in the hot climate. After this peak, consumption gradually declines into the evening, between 6:00 p.m. to 9:00 p.m., as commercial activities wind down and people return home.
However, there is a secondary peak noticeable in the early evening, possibly due to increased domestic electricity usage for cooking and leisure activities. Subsequently, consumption decreases steadily into the late evening and early morning hours before starting the cycle anew. This load profile underscores the dynamic nature of energy demand in UAE, influenced by factors like climate, economic activities, and societal habits [36].
3.1. The Power Load Consumed by Different Types of EV
The load profile for level 1 charging stations, as depicted in Figure 7, shows an extended CD that extends into the early morning hours. This prolonged charging period is in line with the lower power ratings of level 1 stations. In contrast, Figure 8 illustrates the power load consumed by four types of EVs under the characteristics of level 2 charging infrastructures. Notably, the maximum load in level 1 charging stations, at 93.6 kW, is significantly lower than the maximum load in level 2 charging stations, which stands at 187.2 kW. This difference can be ascribed to the increased power rating of level 2 charging infrastructures.
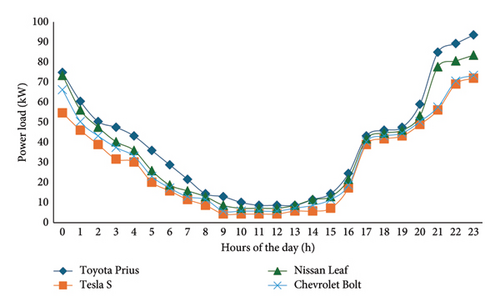
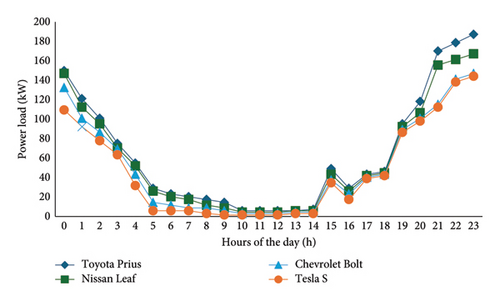
It is interesting to remark that despite the TP having a smaller battery size, its vehicle load surpasses that of the CB and Tesla Model S, while being comparable to the Nissan Leaf. This difference is explained by the TP vehicles covering less distance, thus utilizing more energy to travel the same distance compared to other EV types.
By analyzing Figure 7, it is clear that EV load increases from 4:00 p.m. onwards, indicating vehicle operators come back to home in the afternoon period. In level 1 charging, the extended charging period into the early morning is due to the lower power rating. Peak charging hours are documented at 12:00 a.m. and 11:00 p.m., with load peaks ranging from 73 to 94 kW. The load profiles decline consistently after 3:00 a.m., either due to EVs reaching full charge or people leaving their residences. Between 8:00 a.m. and 3:00 p.m., EV loads hit their minimum values as many individuals leave home for various activities.
In contrast, Figure 8 illustrates a substantial power demand increase during afternoon and nighttime hours for level 2 charging infrastructures, corresponding to EV owners returning home. Unlike level 1 charging, level 2 charging is intensified in the late evening period, with minimal load in the early morning. The faster replenishment rate with level 2 results in a lower cumulative charge compared to level 1.
The deviations in load demand observed in Figures 7 and 8 result from variations in EV charging behavior, commuting patterns, and differences in battery capacities across vehicle types. These fluctuations are influenced by user charging habits, with demand peaking in the evening (18:00–22:00) when most EV users return home and initiate charging. Differences in battery sizes and charging power also contribute, as larger battery capacities, such as those in TS and CB, require more power than smaller models like the Nissan Leaf or TP. Additionally, midday dips in demand (10:00–15:00) align with typical work and travel schedules, during which fewer vehicles are plugged in for charging. Furthermore, charging infrastructure plays a role, with level 2 charging stations causing sharper variations in demand due to their higher power output and shorter CDs compared to level 1 stations.
3.2. The Power Load Consumed by Current Penetration of EV
The anticipated rise in the per capita count of passenger cars in UAE, particularly due to recent changes in driving regulations, is anticipated. As reported by [37], the count of passenger cars in the UAE was around 2.71 million units by the end of 2023 and is projected to surpass 2.93 million units by 2030. Estimates for energy consumption under four potential levels of EV penetration are being made, utilizing previously detailed EV models. The distribution of these EV types is assumed to align with respective percentages of the sample size (1%, 4%, 60%, and 35%): 1% of TB, 4% of CB, 60% of TS, and 35% of NL.
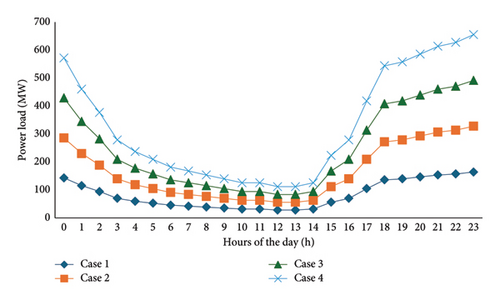
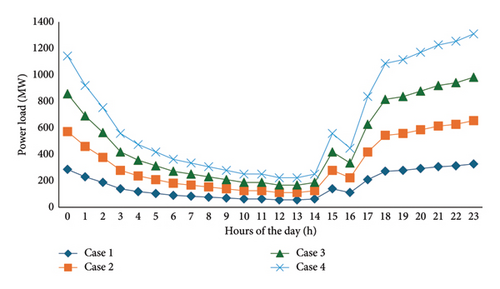
Figure 9 shows the EV fleet load at different levels of EV penetration with level 1 charging infrastructure assessments, while Figure 10 illustrates the load for level 2 charging infrastructure assessments. The maximum power utilization using level 1 charging stations reached 655.04 MW under case 4, with the lowest power consumption rate recorded at 31.35 MW under case 1, as indicated in Figure 9. For level 2 charging stations, the power load caused by charging 40% of EV penetration was 1310.09 MW, while the minimum power load recorded for 10% EV penetration was 55.74 MW, as mentioned in Figure 10.
In Figure 10, the power demand forecast integrates a hybrid approach, incorporating an equal assortment of level 1 and level 2 charging infrastructures, each accounting for 50% of the total charging infrastructure. This strategic blend aims to achieve a more balanced distribution of the load on the electrical grid throughout the day. By offering both level 1 and level 2 charging options, these mixed charging stations play a crucial role in optimizing grid usage. Level 1 charging, predominantly conducted overnight or during off-peak hours, effectively utilizes available capacity during periods of reduced demand. This practice not only spreads out the load profile but also maximizes the utilization of existing infrastructure during idle hours, contributing to grid stability. On the other hand, level 2 charging, often preferred during daytime hours when EV owners require faster charging, adds flexibility to the system. This aspect becomes particularly significant during peak demand periods, as level 2 stations can swiftly respond to the increased need for charging, thereby helping to balance the load profile and mitigate strain on the grid.
The scenarios outlined in Cases 1, 2, 3, and 4 represent varying levels of EV penetration, with percentages varying from 10% to 40%. These scenarios offer insights into how the combined deployment of level 1 and level 2 charging infrastructure can accommodate different adoption rates of EVs and their corresponding charging demands. Overall, Figure 11 provides a comprehensive visualization of how the integration of mixed charging stations can effectively manage and distribute power demand, ensuring grid reliability and sustainability in the face of increasing EV adoption.
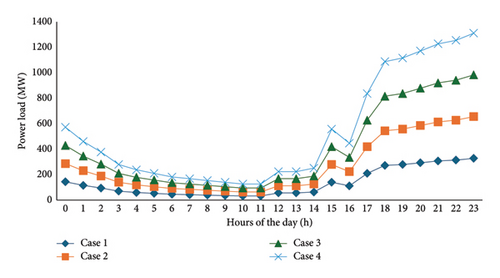
Under level 1 charging characteristics, the existing power infrastructure that provides a margin power of 823 MW [38, 39] can accommodate up to a 40% penetration of EVs. Figure 11 illustrates that during the morning period, from 3:00 a.m. to 10:00 a.m., the system can cover the power demand ranging between approximately 31.35 MW and 69.68 MW, assuming all consumers utilize level 1 charging infrastructures.
However, when level 2 charging points are utilized, scenarios with 30% and 40% EV penetrations exceed the current margin capacity of 823 MW, potentially leading to overloads. The power grid can sustain the power consumption rate in the case of a 10% EV penetration during the period from 9:00 a.m. to 2:00 p.m., where the consumption ranges from 62.71 MW to 69.68 MW, as depicted in Figure 10.
In scenarios involving hybrid charging stations, accommodating a 40% EV penetration from 5:00 p.m. to 11:00 p.m. is unfeasible for the current system. This challenge is exacerbated by the alignment of peak EV load in the housing area, and peak load times for the power system generally occur around midday and in the evening. While level 2 charging is the preferred option for future EV charging facilities, its adoption creates obstacles to the existing power grid due to a reduced capacity margin. This margin is mainly intended to maintain uninterrupted service during system contingencies and is typically underused during normal operations.
Jain & Jain [40] conducted a study analyzing the charging load profile of EVs with an assumed penetration of approximately 170,000 EV units. They examined charging power rates ranging from 3.3 to 6.6 kW and found that at this level of penetration, peak power consumption by EVs measured 204.3 MW for the 3.3 kW charging power rate and 223.90 MW for the 6.6 kW charging power rate.
Kühnbach et al. [41] investigated the uncontrolled charging process in Germany and observed that electricity demand for charging EVs is mainly spread between 6:00 a.m. and 10:00 p.m. This distribution significantly influences the overall structure of the system load, with power consumption attributed to the charging of a high penetration of EVs projected to reach 60,000 MW by 2030.
When combining EV power consumption with general daily usage data, a detailed understanding of energy consumption patterns emerges. Peak hours, like midday and early evening, show the highest power usage, especially with a 40% EV adoption rate. The comparison highlights synchronized EV charging behaviors alongside traditional energy consumption trends, with off-peak hours also witnessing increased power usage. The fluctuations in power consumption percentages across various EV penetration levels, emphasize the effect of EV adoption on overall energy demand.
3.3. The Power Load Consumed by EV Penetration in Year 2030
The projection of EV charging power load profiles for 2030 involved examining four penetration levels: 10% for case 1, 20% for case 2, 30% for case 3, and 40% for case 4. The assessment considered power rates for level 1 charging points, level 2 charging points, and a combination of both. As shown in Figure 12, it is clear that the current system margin can accommodate a 40% EV penetration by 2030 with level 1 charging facilities. The peak load is estimated to be 707.01 MW.
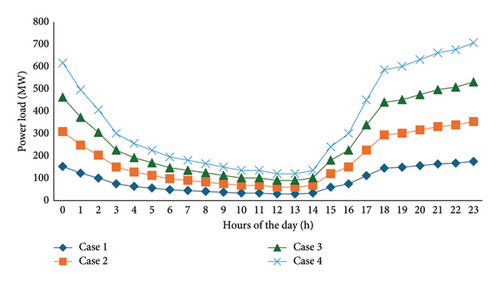
In Figure 13, it is shown that with level 2 charging points, the maximum load for EVs reaches around 350.48 MW with just a 10% EV penetration projected by 2030. Finally, Figure 14 demonstrates that in the scenario combining the two of level 1 and level 2 charging stations, the peak EV load is approximately 350.4 MW for a 10% EV penetration and 708.2 MW for a 20% EV penetration.
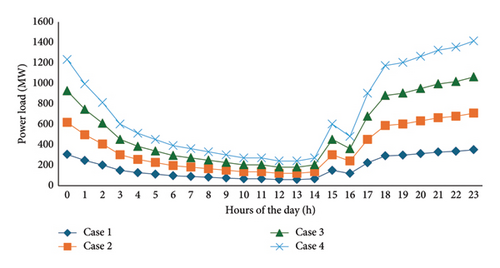
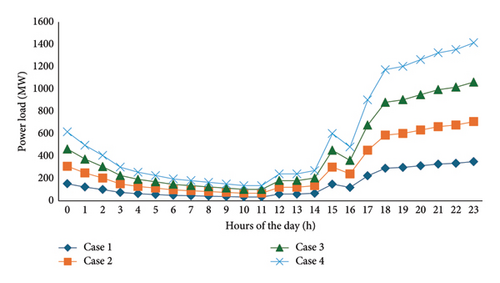
If the existing capacity margin remains unchanged, the most unfavorable scenario would occur, particularly with the establishment of more powerful charging facilities in residential areas. It is anticipated that DC charging stations will become increasingly prevalent in residential sectors in the coming years. Under these circumstances, the current power system in UAE can accommodate a 40% penetration of EVs with level 1 charging infrastructure and up to 20% of EV penetration with level 2 charging infrastructure. Additionally, the margin power of the power system is not primarily intended for regular operational hours but rather serves as a backup to address potential outages or system contingencies that may arise during abnormal circumstances.
3.4. The Power Load Consumed by EV Penetration in Year 2040
The charging load profile for EVs is expected to double by 2040 compared to the levels in 2030. Figure 15 illustrates the charging load profile of EVs in 2040, based on level 1 charging stations and the previously mentioned scenarios. In case 4, the peak power value recorded at 10:00 p.m. was 1353.8 MW, while in case 1, the minimum power consumption reached 335.57 MW.
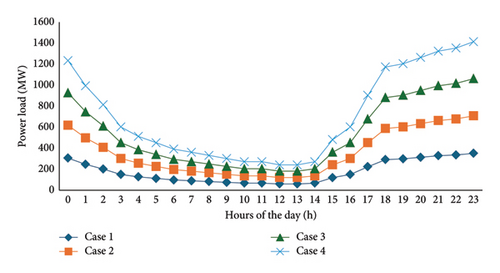
Figure 16 projects the power load profile in 2040 for EV charging using level 2 charging stations. It indicates an increase in power load, with the maximum load reaching 2828.05 MW in case 4 and the minimum load being 119.3 MW in case 1.
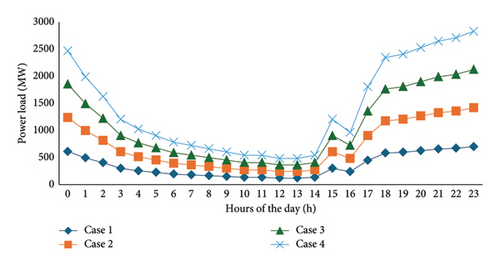
Figure 17 depicts the projected power load for EV penetration in 2040, considering the pair of level 1 and level 2 charging stations. The results indicate an increase in power load in 2040 compared to 2030 for both types of charging stations.

3.5. The Power Load Consumed by EV Penetrations in Year 2050
The charging load profile for EVs is expected to triple by 2050 compared to the levels in 2030. Figure 18 illustrates the charging load profile for EVs in 2050, assuming the presence of level 1 charging stations and using the same scenarios as previously mentioned. In case 4, the peak power value reached 2121.04 MW, while in case 1, the lowest power consumption was 89.48 MW. Comparing the overall hourly load profile in UAE with the power load profile for EVs reveals a significant difference in power utilization in 2050, which is three times higher than in 2030.
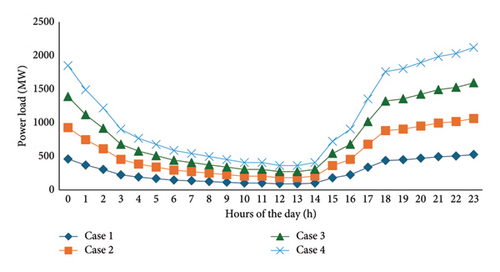
Figure 19 reveals the projected power load profile for charging EVs in 2050, assuming the availability of level 2 charging stations. It indicates a significant increase in power load, with a peak of 4242.08 MW in case 4, and the lowest load value being 178.9 MW in case 1.
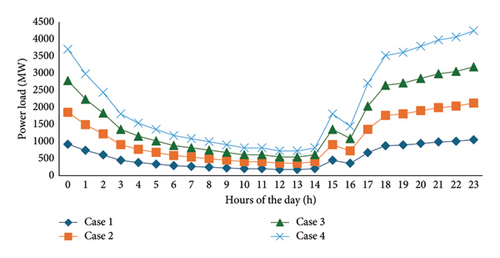
Figure 20 illustrates the projected power load for EV penetration in 2050, taking into account the pair of level 1 and level 2 charging stations. The analysis shows a power load increase in 2050 compared to 2030.
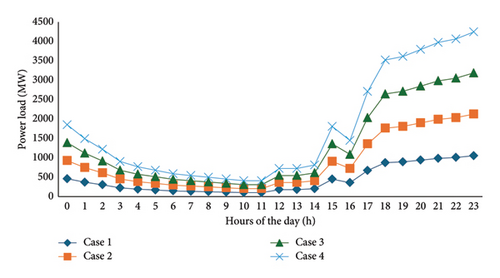
In UAE, EVs will significantly impact the power grid over time. By 2030, with 40% EV penetration, the grid may face overloads during peak charging, requiring urgent infrastructure upgrades. By 2040, increased EV adoption will exacerbate demand, risking grid instability and necessitating comprehensive grid modernization, including infrastructure upgrades and advanced technology integration. By 2050, high EV penetration levels will further increase the risk of grid instability and disruptions.
4. The Negative Impact on the Power Grid System and Recommended Policies
As EVs become more widespread, the increased need for high power presents further obstacles for the electrical grid. The sudden rise in power demands can result in problems like voltage instability, transformer inefficiencies, and the generation of harmonics, all of which contribute to a reduction in power reliability [42].
4.1. Voltage Fluctuations and Phase Imbalance
The incorporation of EVs has the probability to introduce voltage variations into the power system. Uneven distribution of charging loads from EVs across the three phases of the power system can exacerbate load disparities among each phase, leading to varying voltage drops and unbalanced voltages among load buses [43]. When a network exceeds its designed load capacity, it becomes susceptible to voltages dropping below specified values, accompanied by increased losses. Increased load on one or two phases, along with asymmetrical conductor arrangements, can introduce voltage imbalances, posing a risk of damaging connected loads [44].
EVs require higher power consumption for rapid charging to replenish batteries quickly, and the use of single-phase EV chargers can increase phase imbalances within the distribution network, potentially affecting network operation and connected loads. Maintaining acceptable limits for phase imbalances becomes crucial, especially with the expectation that most EVs will be charged by single-phase private chargers. While low EV penetrations may cause minor phase imbalances, high levels coupled with uneven distribution of chargers across phases could lead to voltage unbalance factor exceeding acceptable limits [45].
4.2. Harmonic Disturbances
Harmonics produced by EV chargers can negatively impact elements of the electric power system configured to handle clean sinusoidal waveforms, thereby increasing operational wastage [46]. EV chargers function as sources of harmonic loads, introducing harmonic currents into the power system during the AC-DC conversion process, thereby affecting power quality. These harmonics can lead to excessive heat generation in motors, resulting in premature failures, as well as affecting wire insulation, and leading to breakdowns and failures. Elevated temperatures from harmonics can also impact other equipment, causing malfunctions and early failures. Moreover, harmonics on the power line may trigger system restarts and adversely affect other sensitive analog circuits.
The presence of harmonics significantly reduces the operational lifespan of distribution transformers, subjecting them to electrical and thermal overload. The expanded penetration of EVs in the system is identified as a primary contributor to transformer degradation. Harmonics generated by EVs contribute to increase load losses in transformers, leading to temperature rises and subsequently reducing the overall lifespan of the transformer [47].
4.3. Rise in Peak Demand
The research employed an uncoordinated charging strategy to simulate the power load profile of EVs across the pair of level 1 and level 2 charging points. The findings indicated that the power load required for charging EVs using level 2 stations was greater compared to level 1 infrastructures. Projections for power load associated with EV penetration in 2030, considering both level 1 and level 2 charging stations, revealed an increase in power consumption in UAE with a 40% EV penetration rate.
Some recommendations and policies that aim to strike a balance between promoting the use of high penetration of EVs and maintaining the consistency of the current power infrastructure are suggested.
4.4. Dynamic Tariff
A dynamic tariff, also referred to as time-of-use (TOU) pricing or variable pricing, is a pricing model utilized for goods or services, particularly within utility sectors such as electricity. Dynamic tariffs are closely associated with smart grid technologies, where the cost of electricity fluctuates based on factors like hourly and weekly patterns, or specified timeframes. The primary objective is to reveal the actual expense of producing and delivering electricity at different times. Typically, electricity demand experiences peaks and troughs throughout the day, leading to corresponding variations in supply costs.
Dynamic tariffs reward customers to adjust their energy usage to spans of lower request, thereby assisting in more efficiently balancing the load on the electricity grid. This approach fosters a more distributed and adaptable energy consumption pattern, reducing reliance on rigid peak periods and allowing for greater flexibility in demand fluctuations throughout the day. These dynamics can significantly impact energy planning, grid management, and overall energy system efficiency [48].
4.5. V2G Technology
EVs offer a unique advantage by leveraging V2G technology, enabling them to directly connect to the distribution network for various purposes. However, current adoption of EVs for V2G applications is limited, requiring specific power electronics devices and integrated programming within the EV design to enable this direct grid connection [49].
V2G technology empowers EVs to function not only as transportation vehicles but also as dynamic resources for the electrical grid. These vehicles provide capabilities such as load balancing, active power regulation, and suppression of harmonics, which contribute to grid stability. V2G-enabled EVs can offer support for reactive power, mitigate peak loads during high-demand periods, and optimize grid resources to reduce utility operating costs.
Moreover, they improve load factors, leading to more efficient electricity usage. Owners of V2G-enabled vehicles can generate revenue by participating in grid services, while the technology also assists in lowering carbon emissions by integrating clean energy sources and monitoring RE systems. Ultimately, V2G applications contribute significantly in establishing a more resilient, efficient, and sustainable electrical grid by harnessing the potential of EVs [50].
4.6. Integration of RE Sources
As EV load increases, there is a necessity to enhance the generation margin within the power system. This margin signifies the additional capacity in the system beyond current demand, acting as a buffer for emergencies. To accommodate the rising demand from EVs, additional generation sources like power plants or RE facilities must be installed. This expansion in generation margin ensures the consistency of the power system by providing a safety net for unexpected events or fluctuations in demand, thereby preserving the steadiness and resilience of the electrical grid [51].
The network charging strategy focuses on lowering CO2 releases while promoting vital technologies such as demand response and energy storage. Its main goals are to avoid charging throughout the summit times, align EV charging with RE production, and elevate consumer gratification by keeping rates affordable and fostering customer independence. To meet these objectives, utilities can use various methods, including incentives, behavior changes, and curtailment programs that leverage automated thermostats or integrated EV communication systems [16].
5. Conclusion and Scope of Future Work
The global transition toward EVs represents a significant shift in the transportation and energy sectors, with considerable implications for power systems. This study provided an in-depth analysis of the charging load profiles of EVs in the UAE and their projected impacts on the electrical grid up to 2050. The findings revealed that while the existing grid infrastructure can support up to 40% EV penetration with level 1 charging, challenges such as voltage instability, peak load increases, and harmonic disturbances arise with higher penetration levels and level 2 charging facilities. Broader implications of these findings highlight that uncoordinated EV charging poses risks to grid stability, particularly in regions experiencing rapid EV adoption. If unmanaged, these issues could lead to transformer overloads, higher operational costs, and reliability concerns. Conversely, the adoption of dynamic tariffs, V2G technology, and mixed charging strategies offers pathways to mitigate these challenges by distributing the charging load, enhancing grid flexibility, and utilizing EVs as auxiliary energy resources.
From a broader perspective, the results suggest that in power systems with limited EV penetration, the current infrastructure may suffice without significant modifications. However, as EV adoption increases, particularly with level 2 and fast-charging facilities, proactive investments in infrastructure upgrades and advanced energy management systems will be essential. This includes expanding RE integration, implementing robust demand-side management strategies, and optimizing grid capacity through innovative solutions. Future research should explore the economic feasibility of these strategies, the environmental impacts of integrating RE with EV systems, and the potential of level 3 charging technologies. Policymakers and utilities must leverage these insights to ensure that power systems evolve in alignment with the growing demand for sustainable transportation solutions.
Nomenclature
-
- AC
-
- Alternative current
-
- AT
-
- Arrival time
-
- BEV
-
- Battery electric vehicle
-
- CO
-
- Carbon oxide
-
- CO2
-
- Carbon dioxide
-
- CD
-
- Charging duration
-
- CE CD
-
- Charging energy charge duration
-
- CB
-
- Chevrolet Bolt
-
- DTD
-
- Daily traveled distance
-
- DT
-
- Departure time
-
- DC
-
- Direct current
-
- DEWA
-
- Dubai electricity and water authority
-
- ERM
-
- Electric range mile
-
- EV
-
- Electric vehicle
-
- ENOC
-
- Emirates national oil company
-
- NL P(t)
-
- Nissan leaf power consumed by EVs charging
-
- PHEV SD
-
- Plug-in hybrid electric vehicle stay home duration
-
- SEWA
-
- Sharjah Electricity and Water Authority
-
- SOC
-
- State of charge
-
- TS
-
- Tesla S
-
- TOU
-
- Time of use
-
- TP
-
- Toyota Prius
-
- V2G
-
- Vehicle-to-grid
Disclosure
This research is extension of the preliminary research work published in the conferences in ref. [25, 26].
Conflicts of Interest
The authors declare no conflicts of interest.
Author Contributions
All authors planned the study and contributed to the idea and field of information; introduction: Suma Al-Arab; methodology: Suma Al-Arab and Ahmed G. Abo-Khalil; formal analysis: Suma Al-Arab and Ramesh C. Bansal; writing – original draft preparation: Suma Al-Arab; writing – review and editing: Ramesh C. Bansal and Ahmed G. Abo-Khalil; supervision: Ramesh C. Bansal; review and editing: corresponding author. All authors have read and approved the manuscript.
Funding
No funding was received for this manuscript.
Acknowledgments
The authors would like their universities for the support provided.
Open Research
Data Availability Statement
The data that support the findings of this study are available on request from the corresponding author. The data are not publicly available due to privacy or ethical restrictions.


