Optimization Strategy for Demand Response Participation of Heterogeneous Flexible Load Aggregators Based on Inner Approximation Method
Abstract
Flexible load resources on the demand side are characterized by diverse types, small capacity, and wide distribution. Since these load resources cannot be individually invoked at the system level, it is becoming increasingly important to consider how to establish heterogeneous flexible load aggregates and utilize their adjustable characteristics. In response to the above problems, this paper establishes mechanistic models for three specific heterogeneous load resources, uses the basic homothetic polytope to approximate the original feasible region of loads, and aggregates the feasible region of heterogeneous load resources using the Minkowski sum, while ensuring the aggregation speed and accuracy. Finally, for scenarios of system load shedding and high wind and solar penetration, a demand response strategy on the load side is introduced, and the role of this method in system power supply guarantee and new energy consumption is illustrated through a numerical example.
1. Introduction
Accompanied by the continuous increase in the proportion of new energy generation, traditional generation-side resources have difficulty in dealing with the problem that the output of wind and solar power fluctuates strongly due to environmental factors [1, 2], posing challenges to the security and stability of the power system. The electricity consumption of flexible demand-side resources such as air conditioners (ACs), electric vehicles (EVs), and data centers (DCs) continues to rise. For instance, in some regions of China, ACs already account for over 50% of total electricity demand during summer. According to the Energy and AI Report released by the International Energy Agency (IEA), in 2024, DCs consumed approximately 1.5% of global electricity demand. By 2030, their electricity consumption is projected to more than double, reaching around 945 TWh [3]. The IEA estimates that by 2030, DCs will contribute to about one-tenth of the global growth in electricity demand, though their share remains lower than that of industrial motors, ACs, or EVs. The flexibility potential of these demand-side resources is determined by their inherent mechanisms, reflected in dimensions such as adjustable capacity ranges [4, 5], response characteristics [6], and reliability boundaries [7]. Notably, flexible loads like EVs and DCs exhibit bidirectional regulation capabilities. They can increase consumption during off-peak hours to absorb renewable energy and reduce consumption during peak hours to alleviate grid stress, thereby enhancing the power system’s flexibility. Price or incentive signals can guide flexible load resources to change their power consumption behaviors through demand response, thereby compensating for the system’s inability to effectively balance power and energy due to the stochastic fluctuations of new energy sources [8, 9]. This has become a new challenge for the power system. Therefore, how to accurately characterize the adjustable capabilities of heterogeneous load resources [10] and how to effectively guide flexible load resources to participate in demand response [11, 12] have become focal issues in academic research.
Existing studies often focus on a single flexible load, combining their flexibility in electricity consumption for applications such as virtual power plant (VPP) economic dispatch, new energy consumption, and demand response markets. The adjustable power range of aggregated cluster loads is typically obtained by summing the power ranges of similar loads within a region using the boundary Minkowski sum. However, this method effectively enlarges the feasible region. For a more precise description of the feasible region of cluster loads, most existing methods adopt a bottom-up approach. Specifically, individual load mechanistic models are first established, and the feasible region of flexible loads is represented using a vertex expression [13] or a polytope [14]; the Minkowski sum [15] is then performed in Euclidean space. However, as the time scale and the number of aggregated loads increase, the summation process faces nondeterministic polynomial (NP-hard) problems [16], significantly increasing the computational complexity. To address these challenges, researchers have proposed approximate methods for the feasible region, sacrificing part of the feasible region to ensure efficient computation of the aggregated model. For instance, Reference [17] introduces the volume box approximation method, which uses square boxes in Euclidean space to approximate the original feasible region of loads. This method is simple in principle and efficient in computation but suffers from significant flexibility loss. Reference [18] employs an inner approximation Minkowski sum aggregation method based on affine transformations of a convex polytope to quantify the adjustable capabilities of diverse flexible loads. However, this method has a complex solution model and high computational complexity. Reference [19] adopts the Zonotope method, which uses symmetric polyhedrons in space to approximate the feasible region. However, as the time scale increases, the selection of limited directional vectors restricts its extension to only a limited number of directions, resulting in a loss of load flexibility. Reference [20] adopts the basic homothetic polytope method, which like affine transformations of convex polytope, uses basic homothetic polytope to approximate the original feasible region. Compared to fully symmetric polyhedrons, it has better adaptability, theoretically higher approximation accuracy, a simpler solution model, and faster computation. Therefore, this paper selects the basic homothetic polytope to approximate the load feasible region. Reference [21] takes hydrogen hybrid EVs as the research object and studies the low-carbon environmental-economic dispatch issue of their participation in demand response. Reference [22] models the inverter air conditioner (IAC) in VPP and proposes a strategy to coordinate a vast number of IACs with heterogeneous parameters and states to participate in demand response, providing regulation services for VPP. The above references only consider the homogeneous flexible loads participating in demand response. However, VPP contains a large number of heterogeneous flexible loads with huge adjustable capabilities. Aggregation of a single type cannot tap the greater regulation potential on the demand side. Therefore, comprehensively considering multiple heterogeneous loads is of great significance for dispatching operation control in the power system.
Reference [23] models the flexible loads in the industrial park as transferable loads and proposes a coordinated optimization scheduling strategy involving power generation, loads, and energy storage resources to achieve the economy and low-carbon characteristics of the industrial park. Reference [24] takes into account three types of loads in the park, namely, shiftable loads, transferable loads, and curtailable loads, establishes flexible load models, and reduces the cost during the operation of the power system by flexibly scheduling these loads. The abovementioned research failed to take into account the inherent regulatory characteristics of the load and predetermined the adjustable capacity range of all three load categories (shiftable, transferable, and curtailable), indicating that there is a lot of room for improvement in the method. However, they only classify the loads into three categories (shiftable, transferable, and curtailable) and lack credibility by predefining the adjustable capacity ranges of the three types of loads. Reference [25] considers ACs and EVs as aggregates and proposes an effective demand response strategy for residential areas according to time-of-use electricity prices to reduce the electricity burden of households and greenhouse gas emissions into the atmosphere. Reference [26] explores the adjustable capabilities of ACs and EVs in microgrids and reduces the operation costs of microgrids by dispatching the adjustable capabilities of flexible loads through distribution network operators. Most of the existing researches focus on using EVs and ACs as flexible load, lacking consideration of other loads such as DCs. Meanwhile, when modeling, the coupling of the time series power and energy constraints of loads is not specifically considered, which expands the original feasible region of loads and indirectly affects the effect and accuracy of loads aggregation.
To address the above issues, this paper selects EVs, ACs, and DCs as the research objects of heterogeneous flexible loads. This study develops a universal mechanistic model for flexible loads by holistically integrating the operational principles of the demand-side resources and their inherent power–energy coupling characteristics across temporal consumption profiles. The model leverages half-plane expressions to mathematically delineate the power adjustable domains of individual flexible loads, employs the basic homothetic polytope approximation to derive computationally tractable solutions for these domains, and utilizes Minkowski sum operations to aggregate heterogeneous load clusters into a unified feasible region model—thereby systematically quantifying the flexibility capabilities of load aggregators. In parallel, a hierarchical demand response strategy is formulated to incentivize participation of heterogeneous load clusters in demand response, while rigorously accounting for their operational constraints and energy requirements. Finally, through case analysis, it verifies that the proposed heterogeneous load aggregate model and demand response strategy enhances the economic efficiency and cleanliness in the VPP.
2. Characterization of Adjustable Characteristics of Heterogeneous Load Resources
2.1. EV Model
2.2. AC Model
2.3. DC Model
New-generation DCs [29] have a wide range of application scenarios in society, such as real-time navigation, large AI models, data storage, and downloading. According to relevant data, the annual power consumption of DCs accounts for 2% of China’s total electricity consumption. With the construction of a smart nation, the demand for computing power is increasing. Relevant institutions predict that by 2030, the annual electricity consumption of national intelligent computing centers alone will account for 5%–10% of the total electricity consumption of society.
3. Aggregation Method for Feasible Region of Multielement Heterogeneous Loads
3.1. Approach for Building the Feasible Region of Load Resources
As the time scale increases, when using the vertex expression method, the computational difficulty increases exponentially, and the solution accuracy also decreases with the increase of numerical calculation errors. Compared with the vertex expression, the plane expression has good scalability. When the time scale increases, only the constraints at the corresponding moments need to be added to the original expression. Therefore, this paper chooses the half-plane expression to represent the feasible region of loads.
3.2. Load Feasible Region Aggregation Method Based on Basic Homothetic Polytope Method
In the context of massive load scenarios, load resources exhibit diverse operating characteristics and significant parameter differences. If the polyhedrons representing individual load resources are aggregated using the vertex method for Minkowski sum, the computational space complexity becomes high, the solution time is long, and the problem becomes an NP-hard problem. Therefore, this paper adopts the idea of transforming the original power feasible region of load resources using a set of representation forms with the same structure but different parameters to achieve an inner approximation of the feasible region for massive heterogeneous load resources, thereby realizing the aggregation function.
By sequentially performing benchmark feasible region determination, scaling and displacement transformations of the benchmark feasible region for inner approximation of the original feasible region, and Minkowski sum of the approximated feasible region, the aggregated power feasible region of heterogeneous load resources is obtained.
3.3. Multivariate Heterogeneous Load Aggregation Method
Although homogeneous load resources have similar operational modes, differences in their initial operating parameters lead to variations in the feasible region among different individuals. Using a single benchmark feasible region to approximate the original feasible regions of each load within a massive cluster of homogeneous loads will result in significant errors. Therefore, this paper adopts a progressive approach, namely, the concept of “clustering before aggregation,” to solve for the feasible region of homogeneous load resources. Load resource initial operating parameters are selected as load characteristics, and homogeneous load resources are grouped through the K-means algorithm. For each cluster of homogeneous loads with similar characteristics, the original feasible region approximation algorithm and Minkowski summation method proposed in Section 2.2 are applied for aggregation, resulting in the feasible region of each cluster aggregate as shown in equation (28). The aforementioned method is then used to aggregate the feasible regions of each cluster aggregate into the feasible region of the overall homogeneous load aggregate resource. This method can largely avoid the issue where selecting a single benchmark feasible region cannot effectively represent the feasible regions of a vast number of regional load resources due to differences in load resource power and “capacity.”
To facilitate readers’ understanding, Algorithm 1 presents the pseudocode of the heterogeneous load aggregation method. Additionally, Algorithm 2 provides the pseudocode for the heterogeneous load clustering method.
-
Algorithm 1: Heterogeneous load aggregate algorithm (pseudocode).
-
Input: X = {x1, x2, …, xi, …, xm}-operational parameter of loads; M-number of loads; K-the number of clusters for loads by K-means algorithm; Ni-number of loads in cluster i.
-
Output: -aggregate feasible region.
-
for m ⟵ 1 to M do
-
Construct the feasible region based on mechanistic constraints with the same structure as equation (16);
-
Obtain the coefficient matrices of the feasible region expression A = {a1, a2, …, ai, …, am} and B = {b1, b2, …, bi, …, bm};
-
end for
-
Assign the coefficient matrices of different loads into distinct clusters generated by the K-means algorithm.
-
for k ⟵ 1 to K do
-
Calculate the coefficient matrices of the selected benchmark feasible region as equation (18).
-
for n ⟵ 1 to Nido
-
Obtain the values of the optimization variables λn, μn, and Un by solving the optimization problem with equation (23) as the objective function, subject to constraints equations (24)–(26).
-
Obtain the translation coefficient and scaling coefficient matrix φn ⟵ 1/λn, ψn ⟵ −μn/λn;
-
end for
-
Calculate the translation coefficient and scaling coefficient of difference aggregates as equation (27);
-
Obtain the coefficient matrices that represent the feasible region of difference aggregates based on equation (28);
-
Obtain the values of the optimization variables λk, μk, and Uk by solving the optimization problem with equation (23) as the objective function, subject to constraints equations (24)–(26).
-
Obtain the translation coefficient and scaling coefficient matrix φk ⟵ 1/λk, ψk ⟵ −μk/λk;
-
end for
-
Calculate the translation coefficient and scaling coefficient of the aggregate as equation (27);
-
Derive the feasible region of the inner-approximated aggregate formulation by equation (28);
-
Return
-
Algorithm 2: K-means algorithm (pseudocode).
-
Input: X = {x1, x2, …, xi, …, xm}-operational parameter of loads; M-number of loads; K-the number of clusters for loads; T-max iterations; ε-early stopping criterion; D(, )-distance metric.
-
Output: C-cluster assignments of loads;
-
C⟵φ, t⟵0, T⟵100, K⟵0, ε⟵10−5
-
Determine the optimal number of clusters K for the K-means algorithm using the elbow method on dataset.
-
Whiledo
-
Randomly select n samples from the dataset X as the initial mean vectors (μ1, μ2, …μn).
-
end while
-
While t < T do
-
for i ⟵ 1 to M do
-
for j ⟵ 1 to K do
-
Calculate the distance between the ith data point and the jth cluster center dij
-
If dij = Min{D(xi, μi)} then
-
xi ≤ Cj
-
end for
-
end for
-
for k ⟵ 1 to K do
-
Calculate the jth cluster center Cj
-
Calculate the new mean vectors:
-
if then
-
-
end if
-
t + = 1
-
end for
-
end while
-
ReturnC
4. Day-Ahead Dispatching Model Accounting the Contribution of Multivariate Heterogeneous Loads in Demand Response
4.1. Day-Ahead Dispatching Model
The constraint conditions of the day-ahead scheduling model include the operation constraints of thermal power generating units, the operation constraints of WT and PV generation, the operation constraints of ESS, and the power balance constraints, etc.
The traditional day-ahead scheduling model, when taking into account the participation of load-side resources in demand response, often simply models the load-side resources as shiftable loads, transferable loads, and curtailable loads to simplify computational complexity, and the solution speed of the scheduling model can be improved. However, this mode does not fully consider the adjustment characteristics of various flexible loads, which affects the accuracy and reliability of the dispatch results. This paper models the load-side resources as the multitype heterogeneous load aggregation model described in Section 3, taking full account of the adjustment characteristics of various flexible loads. The flexible load feasible region calculated by equation (28) is used to determine the adjustable boundary of the load aggregator. Meanwhile, incentive-based demand response policies are introduced to enhance the economy and flexibility of the VPP system while reducing carbon emissions.
4.2. Load-Side Regulation Strategy
4.3. Algorithm Flowchart
The day-ahead scheduling process considering the participation of diverse heterogeneous loads in demand response is shown in Figure 1. The process consists of three parts. The first part is the stage of characterizing the feasible region of similar loads and cluster processing. The feasible regions of similar loads, which are widely distributed and have large operational differences, are transformed into half-plane expression through equations (18) and (19).
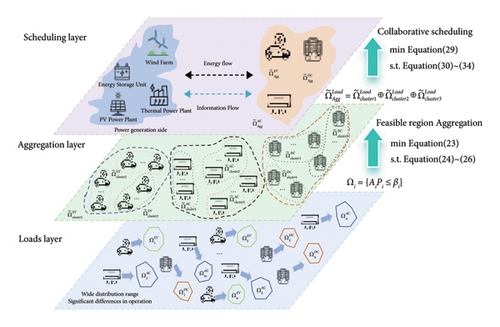
The second part is the cluster aggregation processing stage of similar loads. Firstly, the similar loads in the region are grouped through the K-means algorithm. The approximate feasible region of the loads in each cluster after K-means processing is calculated through equations (23)–(28). Then, the aggregates of the load clusters are further aggregated to obtain the feasible region of the aggregated resources of massive similar loads.
The third part is the day-ahead scheduling stage. The VPP side collects the feasible region of the aggregated resources of flexible loads in the region, combines the next-day load forecast curve, aims to minimize its own cost as the optimization objective, formulates generation and incentive strategies, and stimulates the electricity flexibility of multivariate heterogeneous loads, enabling not only the transmission of electrical energy but also the conveyance of incentive prices and information about the adjustable capacity of loads between the VPP side and the load side.
5. Case Study
5.1. Parameter Settings of Equipment in the Case
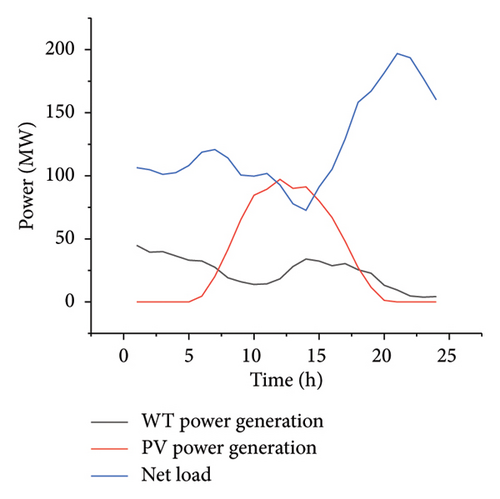
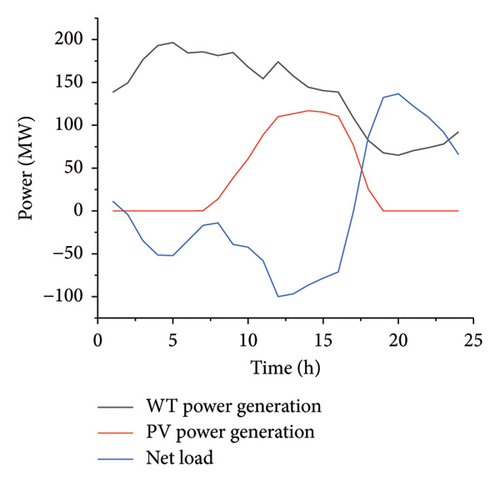
This paper conducts a case analysis using the improved PCUC-6 bus system [33]. The PCUC-6 bus system utilizes the actual renewable energy output scenarios and load data of a certain location in China. In order to adapt to the actual installed capacity of renewable energy and load conditions, the thermal power units plugged in Buses 1, 2, and 6 have been improved. A 200-MW PV generation and a 250-MW WT generation are installed at Bus 1, and energy storage is only plugged in Bus 1. The load buses include 1000 EVs, 1000 ACs, and 10 small-scale DCs. The original load curves of EVs and ACs are referenced from dataset [34], and the original load demand of DCs is simulated based on reference [35]. The detailed data are provided in dataset [36], and it provides key data such as the day-ahead prediction curves in two scenarios of system supply guarantee and high generation of renewable energy, the arrival of DC loads, equipment parameter settings such as flexible loads, thermal power units, energy storage units, the original load curves, and the topology structure of the PCUC-6 six-node system. Among them, the data load in DC are divided into two categories: delay-tolerant and delay-sensitive: Normal distribution sampling was adopted for the delay-tolerant load with time series migration capability; for delay-sensitive loads, a day is divided into four periods according to the human daily routine, and Monte Carlo random sampling is conducted respectively.
5.2. Analysis on the Aggregation Effect of Heterogeneous Loads
This paper sets the volume box approximation method and the Zonotope approximation method as comparative examples to confirm the advantage of the adopted method with respect to approximation accuracy. Since the power feasible region has the characteristics of high dimensionality and being challenging to observe within the time dimension, only the approximation effects of the power feasible region in adjacent time periods are presented.
As can be seen from Figure 2, the horizontal and vertical coordinates, respectively, represent the load power consumption in adjacent time periods. According to the flexible load mechanism model, the power outputs between adjacent time periods are mutually coupled. The light blue area represents the original feasible region of the corresponding flexible load, the region enclosed by the red solid line denotes the approximate feasible region obtained using our proposed method, and the areas bounded by black dashed lines and blue solid lines show the load feasible regions approximated using the volume box approximation method and the Zonotope approximation method, respectively.
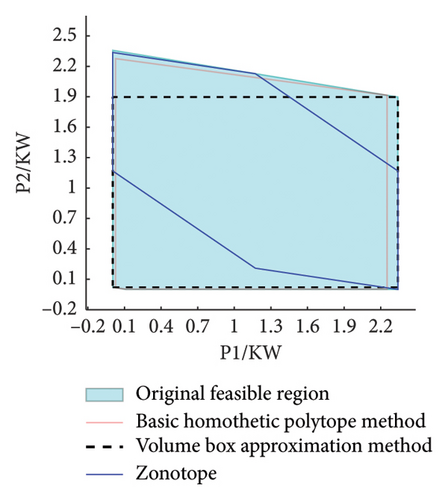

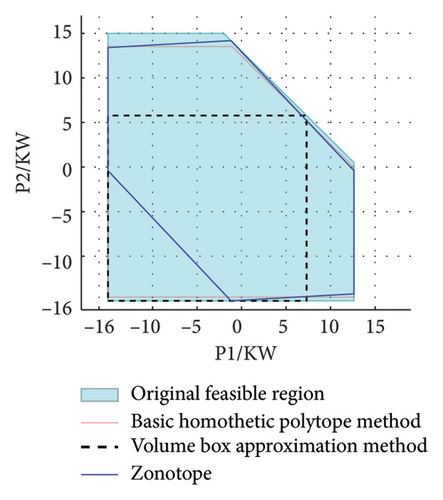
The volume box approximation method assumes that the approximate feasible region is an inscribed cube. This method does not take into account the actual shape of the feasible region and cannot represent the energy constraint of the load as shown in equation (16), resulting in a significant loss of the feasible region. However, due to the original power feasible region not being symmetric, compared with the basic homothetic polytope method adopted in this paper, there is still a relatively large loss of feasible region.
The area ratios of three types of loads under three inner approximation methods were calculated to compare their approximation performance. As demonstrated in Table 1, the proposed method in this paper achieves significantly better approximation results compared to both the volume box approximation method and the Zonotope approximation method.
| Strategy | EV | DC | AC |
|---|---|---|---|
| Basic homothetic polytope | 0.9447 | 0.8698 | 0.9363 |
| Volume box approximation | 0.6412 | 0.8319 | 0.8867 |
| Zonotope | 0.8224 | 0.5840 | 0.7254 |
This paper considers the aggregation of massive heterogeneous loads in the VPP, and it is necessary to verify the accuracy of the aggregation of feasible region of various loads with indicator.
This study compares the approximation accuracy metrics of flexible loads across three temporal dimensions under multiple spatial scales, as detailed in Table 2. The results demonstrate that our proposed method maintains significant precision advantages over both the volume box approximation and Zonotope approximation methods at all time scales. As temporal dimensionality increases, approximation complexity grows accordingly. While conventional methods exhibit rapid accuracy degradation, our approach maintains high fidelity even in 24-h high-dimensional spaces, particularly for EV and DC load feasible regions. Unlike symmetrical polytope-based approximations, our method utilizes asymmetric polyhedral approximations to better conform to the original nonsymmetric feasible regions in high-dimensional spaces. This geometric adaptability enables tighter approximation boundaries and superior precision.
| Strategy | Load type | Average accuracy metrics | ||
|---|---|---|---|---|
| 6 h | 12 h | 24 h | ||
| Basic homothetic polytope | AC | 0.9677 | 0.9595 | 0.8853 |
| EV | 0.9620 | 0.9493 | 0.9580 | |
| DC | 0.9335 | 0.9483 | 0.9571 | |
| Volume box approximation | AC | 0.8855 | 0.8361 | 0.8223 |
| EV | 0.4545 | 0.4212 | 0.3857 | |
| DC | 0.5565 | 0.5218 | 0.4964 | |
| Zonotope | AC | 0.7855 | 0.7117 | 0.6381 |
| EV | 0.8455 | 0.7552 | 0.6615 | |
| DC | 0.5488 | 0.4819 | 0.4053 | |
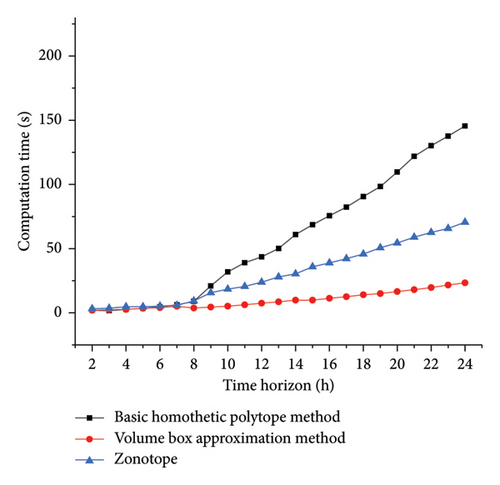
This paper presents a computational time comparison for approximating the feasible regions of 100 EVs. As observed in Figure 3, the volume box approximation method achieves the shortest computation time when approximating high-dimensional temporal feasible regions, followed by the Zonotope approximation method, while our method requires relatively longer processing time. The reason for this is that among the three types of approximation methods, the volume box approximation method has a low modeling complexity. However, the model of the method used in this paper is complex, but the overall time is within an acceptable range. Meanwhile, considering the approximation accuracy, the method used in this paper has advantages.
5.3. Optimized Scheduling Considering the Participation of Heterogeneous Load Aggregates in Demand Response
This paper constructs two cases. In Case 1, the influence of the participation of heterogeneous load aggregates in demand response on the operation of the VPP is examined when the VPP is in a load-shedding situation; in Case 2, the impact of the participation of heterogeneous load aggregates in demand response on the economy and cleanliness of the VPP under the situation of high generation of wind and solar resources is explored. Against the background of the two cases, two scheduling optimization strategies are designed. Strategy 1 involves not taking into account plenty of flexible loads in the system scheduling optimization; Strategy 2 is that plenty of flexible loads take part in the demand response regulation.
5.3.1. Large-Scale Load Shedding in the VPP
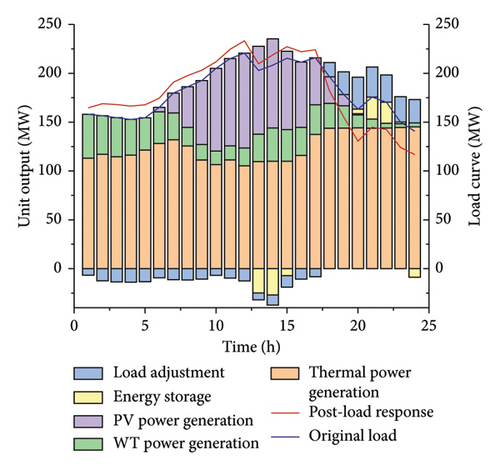
It can be observed from Figure A1 that the scenario set in this paper experiences load-shedding phenomena from 17:00 to 23:00. In Strategy 1, the energy storage devices are charged intensively during the high-generation period of new energy from 11:00 to 13:00, as shown in Figure 4. The load-shedding cost set in this paper is 10,000 yuan/MW. The cost caused by load-shedding in the system is huge as shown in Table 3. Therefore, the energy storage devices perform discharging operations from 17:00 to 19:00, alleviating the occurrence of load-shedding phenomena during this period. However, load shedding still occurs from 19:00 to 23:00.
| Scenario | Generation cost (CHY) | Start-up costs (CHY) | Charge–discharge cost (CHY) | Load curtailment cost (CHY) | Penalties for wind and solar curtailment (CHY) | New energy consumption rate (%) | Demand response cost (CHY) | Total cost (CHY) |
|---|---|---|---|---|---|---|---|---|
| No adjustment | 61,512.805 | 23,300 | 12,236 | 1,820,275.44 | 0 | 99.999 | 0 | 1,894,024.245 |
| Participate in regulation | 65,210.417 | 16,300 | 14,031.2137 | 50,783.323 | 0 | 99.999 | 17,646.40 | 149,940.140 |
Compared with Strategy 1, the energy storage devices are charged intensively from 11:00 to 14:00, and at the same time, the charging amount is increased. Meanwhile, new energy units are in high demand. Due to the wind and solar curtailment penalties set in the case study, flexible loads increase electricity consumption during this period to enhance the utilization rate of new energy. Since the regulation ability of a large number of heterogeneous loads during the period from 17:00 to 18:00 is sufficient to cope with the load-shedding problem caused by excessive system load demand and insufficient supply on the source side, the load aggregates reduce the electricity consumption during this period and delay the energy storage discharging period to 19:00–23:00, avoiding the occurrence of load-shedding phenomena.
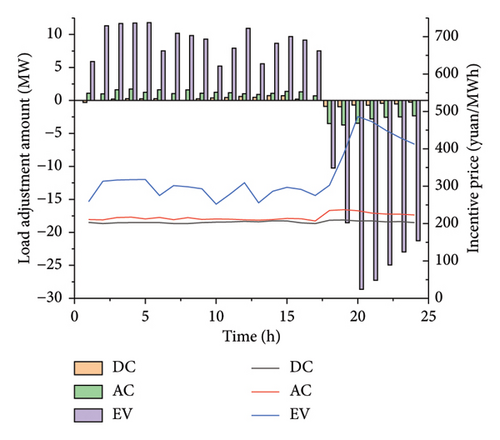
Due to Strategy 1, a demand response strategy is adopted on the load side in the system. According to Figure 5, the system dispatches flexible load resources to reduce the load when the system is under great pressure to supply guarantee and increase the load at other times simultaneously. Flexible loads can not only meet their own electricity demands but also reduce the risk of load shedding in the power system, ultimately achieving source–load interaction. Although the system dispatching process bears the demand response cost, it avoids high load-shedding costs and simultaneously enhances the stability of system operation.
5.3.2. High-Generation Situation of PV and WT
It can be observed from Figure A2 that in the scenario set in this paper, the phenomena of wind curtailment and photovoltaic curtailment occur from 01:00 to 16:00. In Strategy 1, the wind curtailment volume is 521.73 MW and the photovoltaic curtailment volume is 449.713 MW. Compared with Strategy 1, in Strategy 2, the wind curtailment volume is 576.251 MW and the photovoltaic curtailment volume is 321.617 MW, reducing the total curtailment volume by 73.585 MW. In Strategy 2, due to the increase in electricity consumption by flexible loads from 00:00 to 16:00, the curtailment volumes of wind and photovoltaic in the system are reduced, as shown in Figure 6. Based on the case study, it is found that in Strategy 2, the wind curtailment volume will be reduced from 00:00 to 08:00. From 09:00 to 14:00, even if the wind curtailment phenomenon still occurs, the reduction of the photovoltaic curtailment volume in the system will be prioritized. This phenomenon occurs because the PV generation is at a high level in this period. Theoretically, the photovoltaic curtailment volume is greater than the wind curtailment volume in the same period. Due to the limited ability of load aggregates to take part in demand response and the direct consumption of photovoltaic energy by energy storage devices, one type of power generation equipment is preferentially selected for consumption.
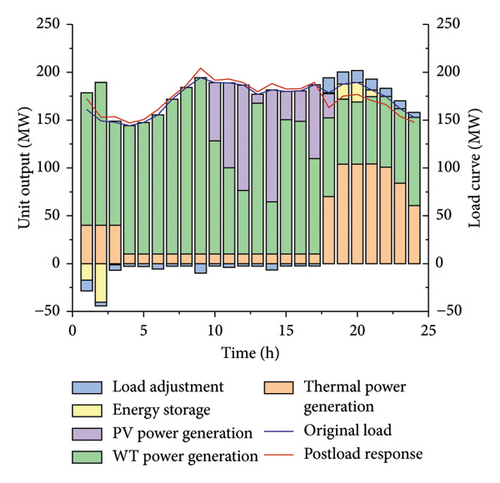
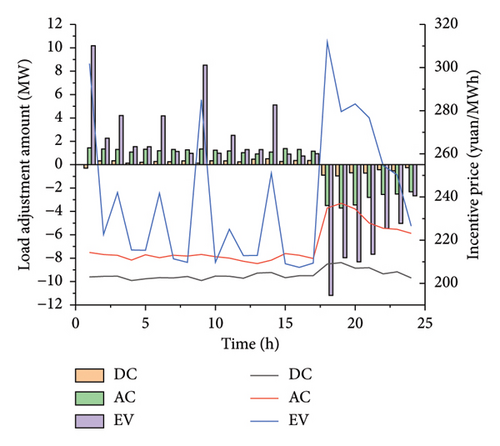
In the selected scenario, the original load increases from 17:00 to 23:00. At the same time, all types of loads need to meet the power balance constraint within the scheduling cycle. Therefore, Strategy 2 is compared with Strategy 1, and the loads within the aggregated load system reduce electricity consumption from 17:00 to 23:00 through demand response strategies, as shown in Figure 7.
During this period, the thermal power generation decreases. Through the experimental results, it is observed that one of the three thermal power generating units in Strategy 2 does not start within 24 h, reducing the generation cost. Finally, from Table 4, it can be observed that adopting the demand response strategy with the participation of load aggregates can cope with the phenomena of wind and photovoltaic curtailment, enhance the consumption of WT power and PV power, and improve the economic efficiency of system operation.
| Scenario | Generation cost (CHY) | Start-up costs (CHY) | Charge–discharge cost (CHY) | Load curtailment cost (CHY) | New energy consumption rate (%) | Penalties for wind and solar curtailment (CHY) | Demand response cost (CHY) | Total cost (CHY) |
|---|---|---|---|---|---|---|---|---|
| No adjustment | 21,382.901 | 23,300 | 12,236 | 0 | 76.748 | 485,726.335 | 0 | 542,645.236 |
| Participate in regulation | 17,981.864 | 16,300 | 12,236 | 0 | 78.983 | 448,933.999 | 5272.314 | 500,724.177 |
6. Conclusions
This paper proposes a multielement heterogeneous load aggregation model and its control method considering DCs, ACs, and EVs. Firstly, a general mechanism model of multielement flexible loads is established, considering the time series power and “energy” coupling characteristics of DCs and constructing the original feasible region of multielement loads. Secondly, using the theory of homogeneous polytopes, the original feasible region of a single load is approximated. The feasible region of the load aggregator is obtained through the method of Minkowski sum. Finally, the minimization of the VPP operation cost is set as the optimization objective, and an operation framework for multielement flexible loads participating in demand response is constructed and verified by case studies under two scenarios: system load shedding and peak generation of wind and solar power.
The current research has limitations. The adjustable capability of flexible loads has irrational characteristics. Therefore, user preferences should be analyzed in depth, a user utility function should be constructed, and the adjustable capability of loads should be more accurately characterized to provide a stronger reference for optimal scheduling.
Disclosure
There are no persons or third-party services involved in the research or manuscript preparation who are not listed as an author and have not been acknowledged.
Conflicts of Interest
The authors declare no conflicts of interest.
Author Contributions
Chenzheng Xie participated in the development of the methodology, modeling, software, writing – original draft, and investigation. Rui Zhu participated in the development of software, formal analysis, and visualization. Xinge Xu participated in the data collection, data curation, and the result verification in this manuscript. Yingyun Sun participated in the writing – review and editing, and supervision of the manuscript.
Funding
This work was funded by the National Natural Science Foundation of China (No. U24B2077).
Acknowledgments
No AI software was used, either in whole or in part, during the preparation of this manuscript.
Appendix A
Open Research
Data Availability Statement
Data in this article are used to support the findings of this study have been deposited in the Optimization Scheduling Method for Demand Response Considering Heterogeneous Load Aggregators (https://gitee.com/xie-chenzheng/optimization-scheduling-method-for-demand-response-considering-heterogeneous-load-aggregators).


