Optimal Control Strategy of Five-Phase PMSMs in a Wide Speed Range Using Third Harmonics
Abstract
The utilization of the third current harmonic in five-phase motors offers the potential to enhance their performance. This paper presents a comprehensive theory for optimally controlling five-phase permanent magnet synchronous motors (PMSMs) across all speeds, considering both motor and inverter limitations. A three-region speed profile is defined based on motor and inverter constraints, with precise relationships derived for determining region boundaries. Distinct control strategies are proposed for each region: maximum torque per ampere (MTPA) for copper loss minimization and maximum voltage–maximum current (Max V–Max I) and maximum power per voltage (MPPV) for core loss minimization. Optimal components of the first and third current harmonics are calculated for each strategy, serving as reference values for control methods such as FOC, DTC, or MPC in motor drives. Analysis results indicate that the proposed strategies significantly increase electromagnetic torque and output power and decrease power loss of five-phase PMSM motors.
1. Introduction
The five-phase permanent magnet synchronous motors (PMSMs) have superiorities such as reducing the stator current per phase leads to smaller sizes of switches for each phase, reduced torque ripple therefore less vibration and noise of the machine, simultaneous effects of both first and third current harmonics in torque generation, slighter current harmonics in DC bus, and enhanced fault tolerance, and as a result, higher reliability [1–5]. These advantages have made the motors come to attention for many applications [6, 7].
- •
Control methods of five-phase PMSMs
- •
Design of five-phase PMSMs
- •
Control strategies of five-phase PMSMs
- •
Five-phase inverters to produce the first and third harmonics independently
The five-phase synchronous motors, similar to three-phase motors, can be controlled by three main methods: field-oriented control (FOC) [8, 9], direct-torque control (DTC) [10–12], and model predictive control (MPC) [13–15].
Unlike the three-phase motors with the Y connection, injection of the third harmonics is impossible, and in five-phase motors, the third harmonic can be injected independently of the first harmonic. For this reason, the optimal design of these motors and their control strategies are closely intertwined. Therefore, a lot of research studies have been performed in order to design the optimal shape of the permanent magnet with the aim of optimizing the contribution of the third harmonic in the electromagnetic torque and reduction of the peak flux density [16–19]. Implementation of control strategies on the five-phase PMSMs has a direct relationship with the capability of the five-phase inverters to produce the first and third voltage harmonics independently. Levi et al., in their research studies, found a region where five-phase inverters can independently generate the first and third voltage harmonics [20].
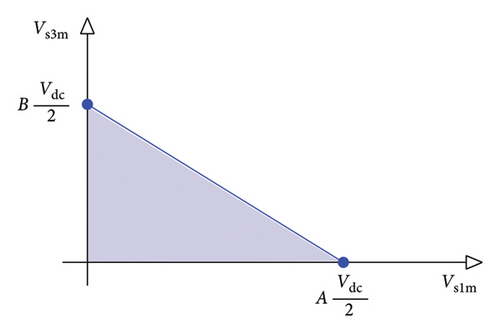
In the any control mentioned method, the control strategies determine the optimal reference values of the control variables according to the operating point. In five-phase PMSM, because of the first and third orthogonal current harmonics, there are four control variables (id1, iq1, id3, iq3). Researchers proposed different control strategies for different speed regions. A simple strategy in five-phase motors is to eliminate the third harmonic and apply only the first harmonic. Elimination of the third harmonic withdraws some of the capabilities of five-phase motors and causes increasing copper loss and decreasing maximum torque [18–20]. Hassan, Paul, and Mohan [21] have proposed a control strategy in two regions, below and above the rated speed or the flux-weakening area. They used numerical methods for optimization and considered only one flux-weakening region. In this paper, we have shown that the flux-weakening region should be divided into two regions. In addition, a new nominal speed must be defined, because the control strategy itself changes the nominal speed. In addition, nonanalytical methods are time-consuming and may face problems in practical applications. In [22–24], the optimal first and third current harmonic have been obtained. However, the inverter limitations are not considered and the flux-weakening region is not considered separately. In [25], the CBPWM technique and the extended mode observer (ESO) control scheme for a five-phase current source inverter (CSI) were studied. However, the machine model in this research does not consider the third harmonic component of the permanent magnet flux (λm3). Consequently, optimal control of the motor and the full exploitation of the inherent advantages of five-phase motors are not feasible with this method. In general, most research studies have focused on control strategies below the nominal speed or within the maximum torque per ampere (MTPA) region, aiming to minimize copper loss (i.e., ids1 = 0 and ids3 = 0). While at speeds higher than the nominal speed, core loss is also important. On the other hand, while optimal control of the five-phase PMSM faces two main limitations, motor and inverter, these limitations have not been considered simultaneously in all existing research studies. This paper addresses this gap by introducing constrained optimization, which incorporates both motor and inverter limitations. This novel approach leads to entirely new concepts and methodologies explored in detail within this work. In this paper, a comprehensive control strategy at all speeds and considering these limitations completely analytically is proposed. Here, the limitation of the motor is the maximum permissible current of the stator windings, and the limitation of the inverter is the ability to independently produce the first and third voltage harmonics according to the DC source amplitude. These limitations cause three-speed regions to be defined. In the first region, the MTPA control strategy has been studied, using completely analytical and simple mathematical relationships, with the aim of minimizing both the motor loss. For the second region, the maximum voltage–maximum current (Max V–Max I)control strategy has been used. In the third region, the maximum power per voltage (MPPV) control strategy has been applied in order to minimize iron losses of the motor.
The organization of the paper is as follows. In Section 2, modeling of the nonsalient five-phase PMSM of the five-phase motor is expressed in the orthogonal frame. Section 3 presents the proposed control strategies through the three subsections. In the first subsection, optimal values of the motor’s currents are derived, and in the second and third subsections, they are studied based on the control region boundary and geometrical interpretation. Finally, simulation and analysis remarks of the proposed method are drawn in Section 4. Section 5 presents the conclusion of the study.
2. Modeling of the Nonsalient Five-Phase PMSM
- •
The windings distribution is completely sinusoidal.
- •
There is no magnetic saturation within the core; in other words, the magnetic circuit is assumed to be linear.
- •
The iron losses are negligible; using this assumption, the parallel resistance taken to model the iron losses will be ignored in the equivalent circuit.
- •
There is no damping winding (starting cage) inside the rotor.
- •
The rotor is of nonsalient type, but the distribution of the permanent magnet’s flux is nonsinusoidal; in other words, the motor is of surface permanent magnet type.
- •
Variations of the motor’s parameters are omitted. This assumption does not invalidate the generality of the study since appropriate estimation methods for the machine’s parameters can be independently added.
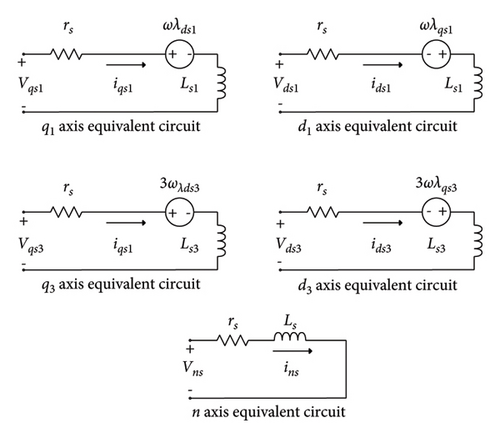
In (1)–(4), vds1, vqs1, ids1, iqs1, λds1, and λqs1 are voltages, currents, and flux linkages of the d and q axes for the first harmonic within the rotor’s rotating reference frame, respectively. Also, λm1 is the flux linkage of the first harmonic of the permanent magnet.
In (5)–(8), vds3, vqs3, ids3, iqs3, λds3, and λqs3 are, voltages, currents, and flux linkages of the d and q axes for the third harmonic within the rotor’s rotating reference frame, respectively. Also, λm3 is the flux linkage of the third harmonic of the permanent magnet.
In (14)–(17), Vs1, Vs3, Is1, and Is3 are voltages and currents of the first and third harmonics of the motor, respectively.
3. Control Strategies
- a
First control region (V < VMax and I < IMax): In this region (Figure 2, R1 region), torque is constant, and power can be controlled in the range of zero up to MTPA power, and speed can be controlled from zero up to MTPA speed (the upper limit of motor’s speed in the first region).
- b
Second control region (V = VMax and I = IMax): In this region (Figure 2, R2 region), torque decreases, and power increases from MTPA up to the maximum power, and speed can be controlled within the range of MTPA speed and critical speed (lowest speed for the maximum power performance).
- c
Third control region (V = VMax and I < IMax): In this region (Figure 2, R3 region), torque decreases gradually up to zero, and power is constant at the maximum value, and speed can be theoretically controlled, within the range of the critical speed and infinity.
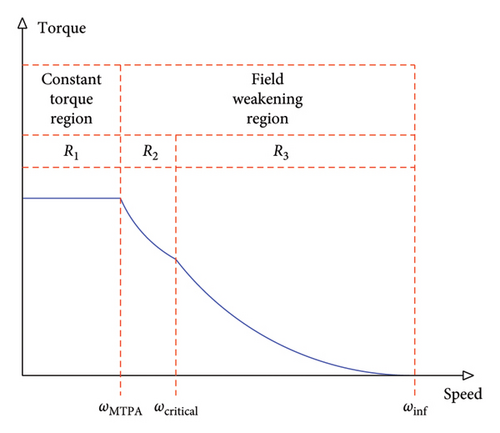
In the first control region, to minimize the machine’s copper losses and inverter losses, the MTPA method is chosen as the control strategy. In the second control region, the Max V–Max I control strategy is used in order to produce the maximum power. In the third control region, the MPPV control strategy is used for the minimization of the iron losses of the motor.
3.1. First Control Region
3.1.1. MTPA Control Strategy
3.1.2. Determination of Limit Conditions
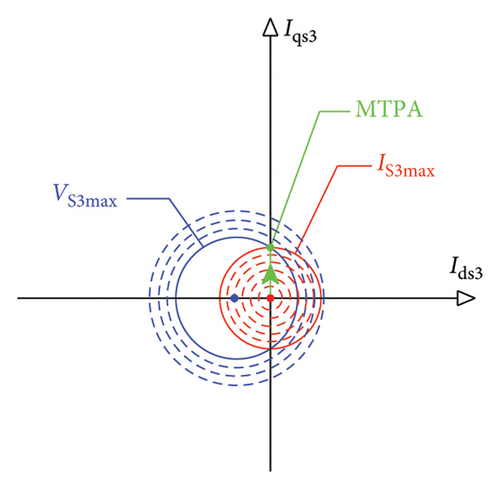
3.1.3. Geometrical Interpretation
3.2. Third Control Region
To analyze the second control region, the speed’s range needs to be determined. As mentioned before, the second control region is located between the first and third regions. Therefore, a maximum speed of the first region can be considered as the beginning of the second region, and likewise, a minimum speed of the third region is the ending of the second region. Thus, to determine the final speed of the second region, the third region should be described first.
3.2.1. MPPV Control Strategy
3.2.2. Determination of Limit Conditions
According to Figure 2 for the maximum power performance, the minimum speed at the beginning of the third region is called critical speed. For speeds higher than the critical, the motor’s speed can be theoretically increased to infinity. As the motor’s speed increases in constant power, the torque and current of the motor decrease. Therefore, the critical speed is where the current of the motor is maximized.
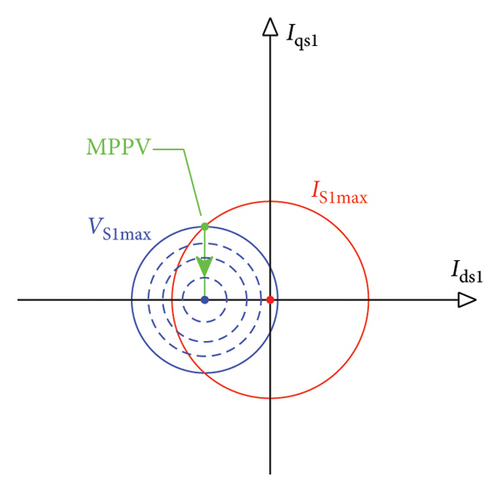
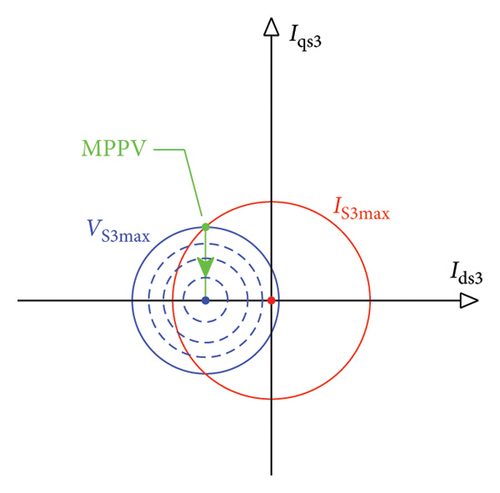
3.2.3. Geometrical Interpretation
3.3. Second Control Region
3.3.1. Max V–Max I Control Strategy
According to Figures 4 and 5, the second control region should be a path from the end of the first control region to the beginning of the third control region. A simple and solvable method is to divide the second area into three parts. In part one, the aim is to produce the maximum power while maintaining minimum copper losses. The control strategy in this section is similar to the first control region except that here, the voltage is changed on the boundary region of the inverter capability (Section 1 of Figure 6). The effective value of the first and third harmonic current must also be equal to the limit current of the motor (Ism). Similar to the MTPA strategy, in order to reduce copper losses, the current component along d axis is considered to be zero. As the speed increases, the first harmonic current will continually increase from the current at the border of the first MTPA region to the current at the border of the third MPPV region, and the amplitude of the third harmonic current will decrease.
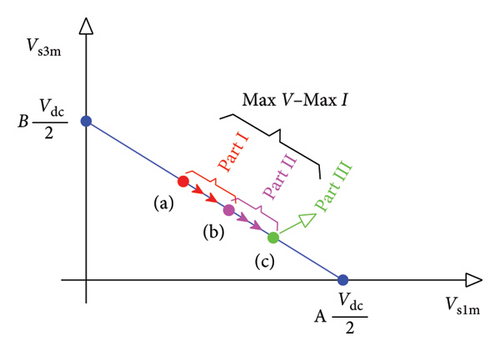
In the second part, the goal is only to produce the final power. To this end, as depicted in Section 2 of Figure 6, first, the voltage is increased over the inverter voltage limit up to the optimal value (MPPV voltage). It must be noted that by increasing the voltage, the optimal current limit will change which leads to the lost continuity in the third control region. To prevent from discontinuity, in the next step, contrary to Part 1 where the current component along axis d was considered to be zero, here, by changing the current along axis d, the current limit is maintained constant. In this way, both the maximum inverter voltage and maximum limit current of the motor are utilized to achieve the final power.
In Part 3, the control strategy is similar to the third control region with the difference that the location of the current changes on the constant current circle obtained at the border of the MPPV region. According to Figure 6, MPPV voltage is used in this part and the aim is to reach the maximum power. In this part, both the maximum voltage of the inverter and the maximum limit current of the motor are utilized. The analysis results of the Max V–Max I control strategy for the operational range of the inverter’s voltage are briefly illustrated in Figure 6.
3.3.2. Determination of Limit Conditions
In Part 3 of the second control region, the speed increases up to the MPPV’s speed value. In this section, the voltage is equal to the MPPV’s voltage. In order to maintain the boundary values of the first and third harmonic currents and prevent the current from breaking, in this section, the current will be variable along the d axis. To calculate the current values along axis d, the first and third current harmonics are the same as Part 2 of the second control region, which is equal to (55) and (56).
3.3.3. Geometrical Interpretation
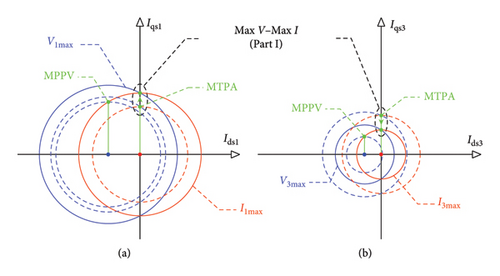
In Part 1 of the second control region, using (53), the location of the first and third voltage harmonics in the planes d1 − q1 and d3 − q3 are circles with radii and and centers (−λm1/Ls1, 0) and (−λm3/Ls3, 0). It must be noted that, as speed increases, the radii of the circles of the first and third voltage harmonics will increase and decrease, respectively.
Also, according to (49) and (50), the limitation of the first and third current harmonics can be drawn as circles with radii Is1m and Is3m and centers (0, 0). The results of the geometrical interpretation of Part 1 of the second control region are illustrated in Figure 7.
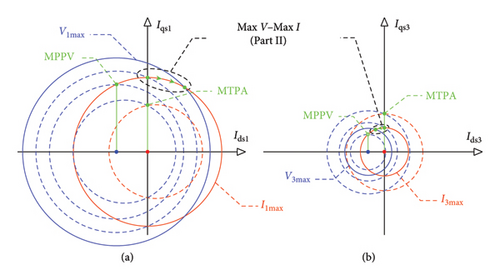
In Part 2 of the second control region, similar to Part 1, from equation (51), the location of the first and third voltage harmonics in the planes d1 − q1 and d3 − q3 are circles with radii and , and centers (−λm1/Ls1, 0) and (−λm3/Ls3, 0), respectively. Here again, the radii of the circles of the first and third voltage harmonics will, respectively, increase and decrease as speed increases. Due to constant currents’ limitation, from (49) and (50), limitation’s limit of the first and third current harmonics can be represented as circles with, respectively, radii Is1m and Is3m and center (0, 0). The geometrical interpretation obtained from Part 2 of the second control region is displayed in Figure 8.
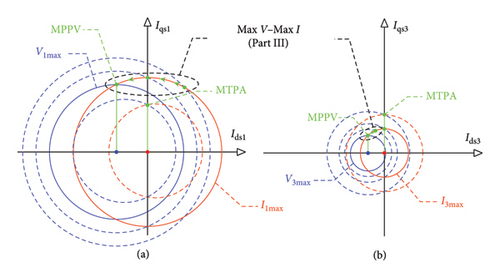
As stated before, in Part 3 of the second control region, the obtained values of current and voltage from Part 2 will be maintained unchanged. However, as speed increases from ωr2 up to the final speed limit (MPPV speed), the radii of voltage circles become smaller. Therefore, the final point of the geometrical location of Part 3 of the second control region coincides with the geometrical location of the third control region. The geometrical interpretation of Part 3 of the second control region is illustrated in Figure 9.
4. Results’ Assessment and Discussion
In this section, for the purpose of assessment and comparison of the proposed strategies, several studies and discussion have been carried out on a typical motor. The parameters of the motor under study are shown in Table 1. The calculations have been performed by MATLAB software.
| Parameter | Symbol | Value |
|---|---|---|
| Rated power | PN | 6 kw |
| DC-link voltage | Udc | 110 v |
| Rated speed | ωr | 360 rpm |
| Number of pole pairs | P | 8 |
| Fundamental PM flux linkage | λ1 | 0.142 Wb |
| Third PM flux linkage | λ3 | 0.016 Wb |
| d1 axis inductance | Ld1 | 3.17 mH |
| q1 axis inductance | Lq1 | 3.17 mH |
| Stator resistance | Rs | 0.11 Ω |
| d3 axis inductance | Ld3 | 1.4 mH |
| q3 axis inductance | Lq3 | 1.4 mH |
4.1. Optimal Voltage Path
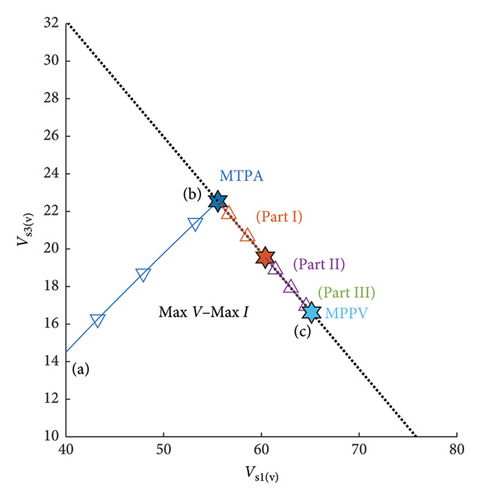
The optimal path curve of the first voltage harmonic amplitude to that of the third has been shown in Figure 10. As shown in Figure 10, by increasing the speed, the voltage’s optimal path within the first control region varies from the inside of the voltage operational region of the inverter up to the inverter voltage limit. This is represented by the segment between Points a and b. This optimal path, with more speed increase in the second and third control regions, has been located on the voltage limit line such that the second control region varies from Point b to Point c and the third control region corresponds exactly to Point c. According to Figure 10, up to the ending of the first control region, both optimal voltages of the first and third harmonics increase. However, in the second and third control regions, as speed increases the optimal share of the first voltage harmonic becomes higher than that of the third harmonic. According to simulation results, values of the optimal voltages in Part 2 of the second control region and also in the third control region remained unchanged at Point c.
4.2. Power–Speed and Torque–Speed Curves
Figures 11 and 12 show curves of power and torque versus speed in different control regions. When the third harmonic is not considered, the maximum resultant power and torque at nominal speed are 6 kW and 159.5 Nm, respectively. These values of power and torque are equal to the nominal ones listed in Table 1. By injecting the third harmonic, the maximum resultant power at the same nominal speed becomes 6.5 kW, which shows 8.8 percent increment in power. Also, the maximum resultant torque at the nominal speed with 4.3 percent growth is equal to 166.5 Nm.
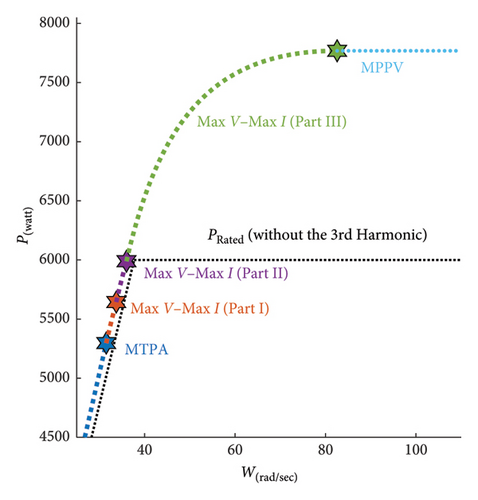
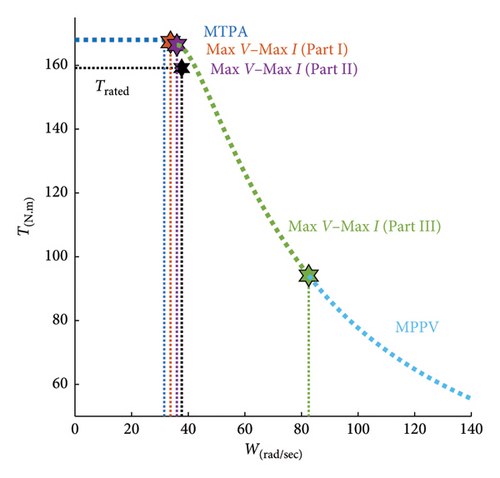
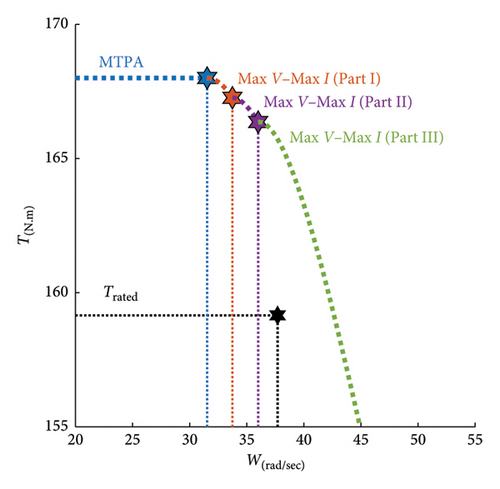
The power and torque curves are, respectively, shown in Figures 11 and 12. In the first control region corresponding to the blue curves, using the MTPA strategy at 252.24 rpm (ωrMTPA), the motor’s power and torque have reached values of 5.29 kW and 168.00 Nm, respectively. In Part 1 of the second control region, corresponding to the red curves, using the Max V–Max I strategy at 269.95 rpm (ωr1), the motor’s power and torque have reached 5.64 kW and 167.26 Nm, respectively. In Part 2 of the second control region, shown by green curves, using the Max V–Max I strategy at 660.53 rpm (ωr2), the motor’s power and torque have reached, accordingly, 7.76 kW and 94.08 Nm. In the third control region, illustrated by cyan curves, using the MPPV strategy, the motor’s power is maintained constant at the maximum power of 77.68 kW. Theoretically, by increasing the speed towards infinity, torque tends to zero.
As shown in Figures 11 and 12, compared to the case with the lack of the third harmonic, by injecting the third harmonic in an optimal manner to a five-phase motor, higher powers and torques can be achieved. It must be noted that this feature has been achieved despite the limitations on the motor limit current and inverter limit voltage.
4.3. Control Regions
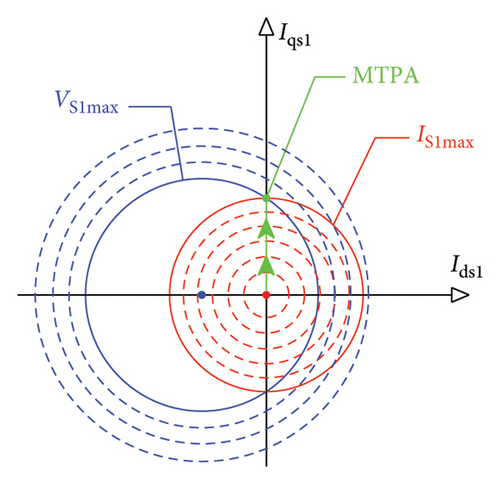
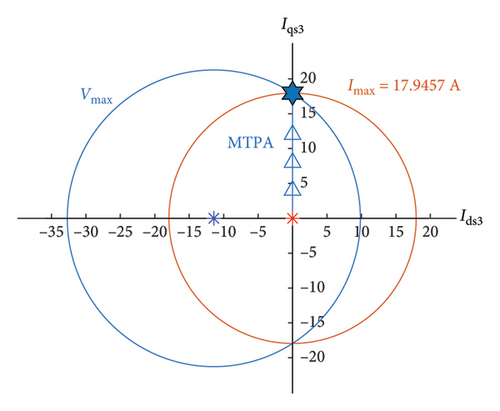
Table 2 shows the numerical results of the simulation for boundaries of different control regions. The performance of the different control regions is reported using the data obtained from Table 2. Figure 13 shows the limits of the simulated first control region in the planes d1 − q1 and d3 − q3, wherein the current limits of the first and third harmonics are 53.08 A and 17.94 A, respectively; these are revealed as red circles. Also, the voltage limits of the first and third harmonics, depicted as blue circles, are 55.54 V and 22.54 V, respectively. By increasing the load torque, the current optimal path of the MTPA strategy rises from the origin up to the intersection boundary of the current and voltage circles, along the q axis; this is illustrated in Figure 13 by blue arrows. It should be noted that over the intersection boundary of the current and voltage circles, the maximum MTPA torque has occurred at 252.24 rpm, which is equal to ωrMTPA.
| Parameter | R1 | R2 | R3 | ||
|---|---|---|---|---|---|
| 1 | 2 | 3 | |||
| Tr (Nm) | 168.00 | 167.26 | 166.36 | 94.08 | 0 |
| ωb (rpm) | 252.24 | 269.95 | 287.99 | 660.53 | ∞ |
| P (watt) | 5297.20 | 5644.20 | 5989.00 | 7768.30 | 7768.3 |
| id1 (A) | 0 | 0 | 1.20 | −44.79 | −44.79 |
| iq1 (A) | 53.08 | 54.53 | 54.52 | 31.10 | 0 |
| id3 (A) | 0 | 0 | −4.74 | −11.42 | −11.42 |
| iq3 (A) | 17.94 | 12.90 | 11.99 | 5.98 | 0 |
| Is1 (A) | 53.08 | 54.53 | 54.53 | 54.53 | 44.79 |
| Is3 (A) | 17.94 | 12.90 | 12.90 | 12.90 | 11.42 |
| Is (A) | 56.04 | 56.04 | 56.04 | 56.04 | 46.23 |
| Vd1 (V) | −42.45 | −46.66 | −49.77 | −65.12 | −65.12 |
| Vq1 (V) | 35.81 | 38.33 | 42.00 | 0 | 0 |
| Vd3 (V) | −19.01 | −14.63 | −16.51 | −16.61 | −16.61 |
| Vq3 (V) | 12.10 | 12.95 | 8.08 | 0 | 0 |
| Vs1 (V) | 55.54 | 60.39 | 65.12 | 65.12 | 65.12 |
| Vs3 (V) | 22.54 | 19.54 | 16.61 | 16.61 | 16.61 |
| Vs (V) | 59.94 | 63.47 | 67.21 | 67.21 | 67.21 |
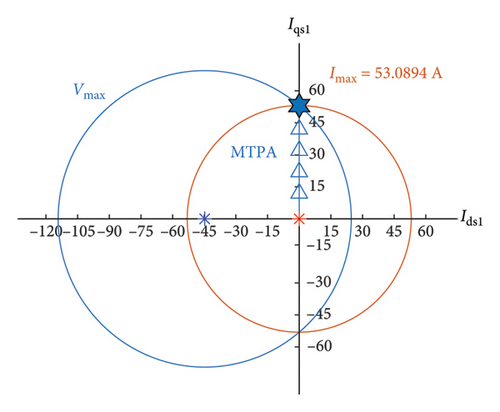
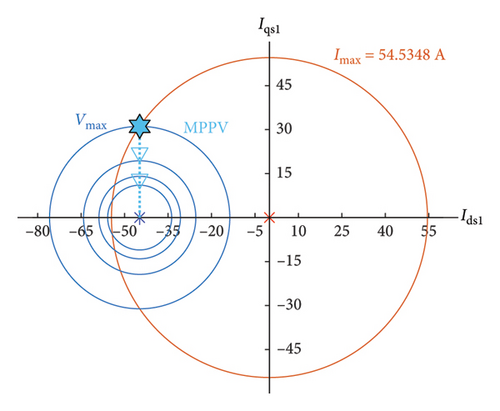
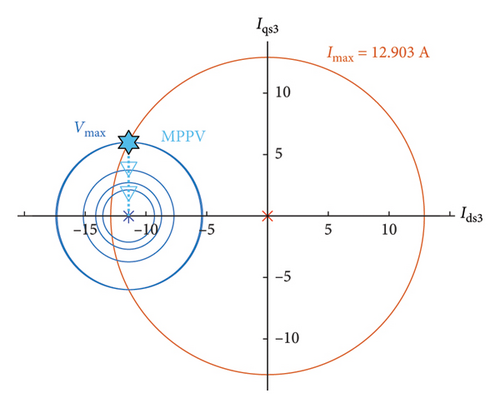
Simulation results of the third control region are shown in Figure 14. In the third control region, the limits of the first and third current harmonics are increased and decreased to 54.53 A and 12.90 A, respectively. This indicates a higher share of the first current harmonic compared to the third harmonic at high speeds; this feature has already been shown in Figure 10. As the motor’s speed increases, for preserving the maximal power, the current’s optimal path of the third control region is a perpendicular line. Starting from the intersection of the limit current and limit voltage, the path continues up to the center of the voltage circle along axis d; this is shown in Figure 14.
Figures 15 and 16 show the simulation results of the second control region for the first and third harmonics, which include two parts. In Part 1, the first and third current harmonics along axis d are zero. The first current harmonic along axis q increases from 53.08 A to 54.53 A and the third current harmonic decreases along axis q from 17.94 A to 12.90 A, such that the sum of current remains constant at 56.04 A. In this part, the motor’s speed has been increased from 252.24 rpm to 269.95 rpm. The optimal path of Part 1 has been specified from Point a to Point b. In Parts 2 and 3, due to keeping of the continuity of current, the third current harmonic along the axis d should be injected.
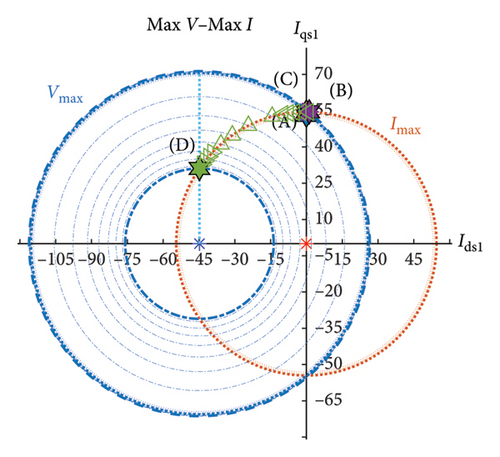
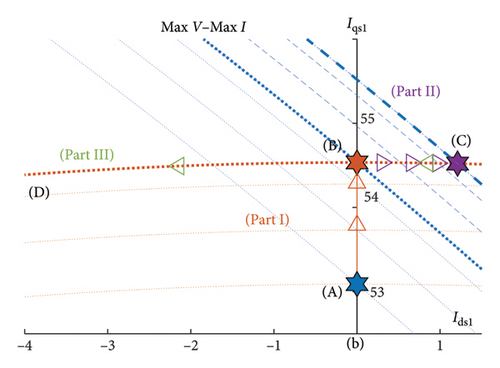
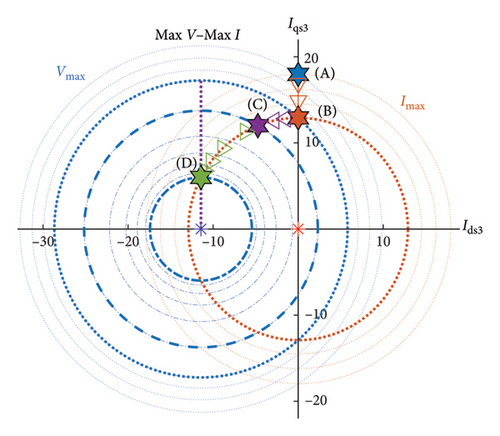
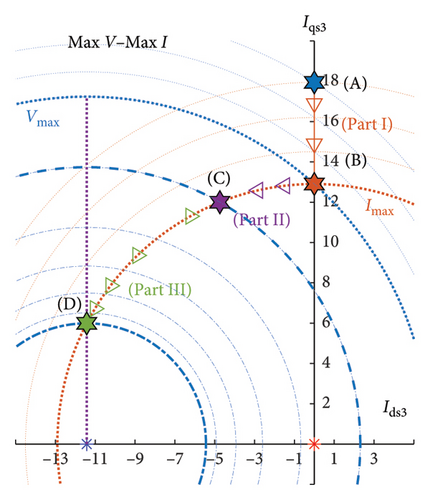
In Part 2, the d axis current of the first and third harmonics has been increased, in turn, in the positive and negative directions by 1.20 A and 4.74 A.
Also, considering movement on the boundary of the current circle, the q axis’ currents have been decreased for the first and third harmonics by, in turn, 54.52 A and 11.99 A. In this part, the motor’s speed has been increased from 269.95 rpm to 287.99 rpm. The optimal path of Part 2 has been shown from Point b to Point c. In Part 3, for the first and third harmonics, the d axis’ currents are decreased, in turn, up to −44.79 A and −11.42 A and q axis’ currents up to 31.10 A and 5.98 A. In this part, speed has been increased from 287.99 rpm to 660.53 rpm. The optimal path of Part 2 is depicted from Point c up to Point d.
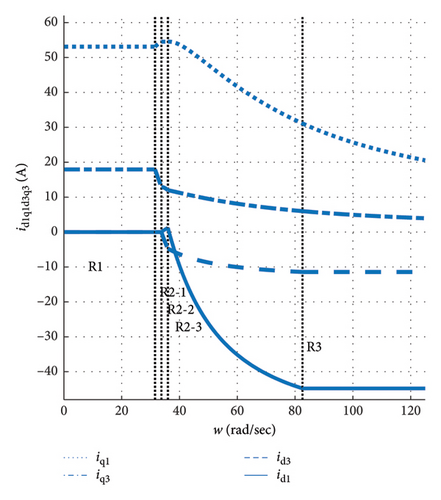
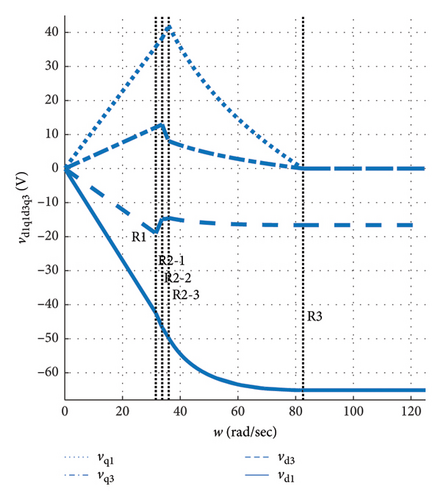
To better illustrate Figures 13, 14, 15, and 16, the optimal first and third harmonic components of the motor current and voltage at the maximum current limit and the inverter capability across all speed ranges are represented in Figures 17 and 18. As observed in Figure 17, in the first region and assuming maximum torque, the d axis’ current components are zero, and the q axis’ components are optimal. With increasing speed in regions two and three, the q axis’ current components decrease, and the d axis current. As the speed and motor power consumption increase, the q axis’ voltage components increase in the first region, and the d axis’ voltage components also increase with a negative sign until they reach the inverter capability limit. In regions two and three, the q axis’ voltage components decrease, while the d axis’ voltage components remain. One of the key points is that the proposed optimization should satisfy the continuity at the boundary of the regions. By observing the current and voltage components, it can be seen that this condition is fully met.
4.4. Power Losses
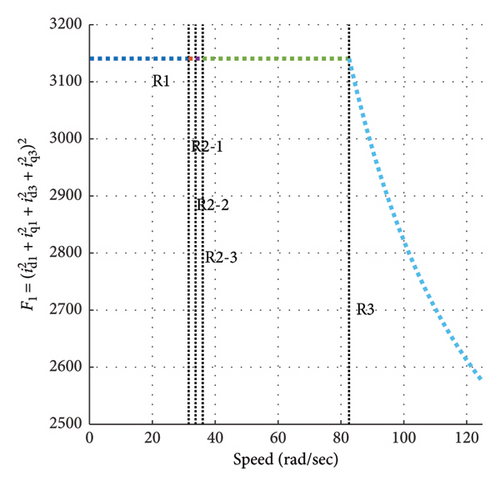
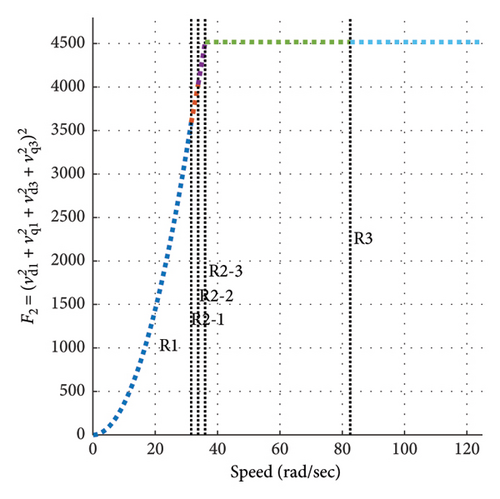
Therefore, the objective functions presented in the paper are proportional to copper losses and core losses, respectively. The results obtained from optimizing the objective functions from equations (18) and (39) for the sample motor are shown in the following Figure 19. In the first region, as torque increases, the optimal q axis current components also increase. Consequently, both copper and iron losses rise. Notably, Figure 19 depicts the function F1, which corresponds to the machine’s copper losses, under the assumption of maximum torque (TMTPAmax) or, in other words, at the current limit Is = Ismax, effectively representing maximum copper losses. As speed increases, the magnitude of the voltage components also grows, leading to an increase in function F2 and core losses. The second region is characterized by the highest current and voltage and can be termed as the constant loss region. In the third region, the current remains constant at the motor’s maximum value, thus copper losses stay constant. As speed increases and voltage components decrease, core losses are minimized.
One of the results of this research is that it seems that the nominal values of five-phase motors should be redefined. Common parameters such as speed, current, and torque do not fully represent all the characteristics of these motors. It was shown that optimal engine control has an effect on some nominal engine parameters such as power, speed, and torque. In a broader view, it seems that the motor and driver design should be integrated and the nominal values of the machine should be defined under optimal control.
5. Conclusion
A comprehensive analytical control strategy was proposed for nonsalient five-phase PMSMs, taking into account the limitations of the motor and inverter across all operating speeds. The study defined three distinct speed zones and established precise boundaries for each. Optimal control variables were then calculated for each region, accompanied by detailed geometric interpretations of all possible motor states. To validate the effectiveness of the proposed strategy, simulations were performed on a sample five-phase PMSM. The results demonstrated that by adhering to the permissible motor current limits, both the electromagnetic torque and motor power experienced significant. Specifically, the electromagnetic torque exhibited a 5.32% increase, while the power output of the motor rose by approximately 8%. Also, the results in the first region showed that the d axis currents (id1 and id3) were found to be zero, and as the speed approached, infinity and the torque decreased, and the q axis’ currents (iq1 and iq3) tended toward zero. Future research can build on these findings to develop generalized control strategies for internal magnet or salient pole motors. Due to the mutual effect of motor design and control strategies, it is suggested that the research related to engine design and proposed control strategies should be performed simultaneously.
Conflicts of Interest
The authors declare no conflicts of interest. We, the authors of the manuscript titled “Optimal Control Strategy of Five-Phase PMSMs in a Wide Speed Range Using Third Harmonics,” submitted to International Transactions on Electrical Energy Systems, hereby declare that there are no conflicts of interest related to this work.
Funding
This research received no specific grant from any funding agency in the public, commercial, or not-for-profit sectors.
Open Research
Data Availability Statement
The data that support the findings of this study are available from the corresponding author upon reasonable request.


