Multiobjective Day-Ahead Scheduling of Reconfigurable-Based Microgrids Through Electric Vehicles and Demand Response Integration
Abstract
Nowadays, as the demand for plug-in electric vehicles in microgrids is growing, there are various challenges that the network must face, including providing adequate electricity, addressing environmental concerns, and rescheduling the microgrid. In order to overcome these challenges, this paper introduces a novel multiobjective optimization model where the first objective is to minimize the total operation cost of the microgrid and the second objective is to maximize the reliability index by reducing the amount of system energy not supplied. Because of these two compromising objectives, the evolutionary multiobjective seagull optimization algorithm is utilized to find the best local solutions. In this regard, integrated plug-in electric vehicles and demand response programs are used to smooth distribution locational marginal pricing. Furthermore, the effect of the system’s various configurations is analyzed in the suggested method to smooth the amount of distribution locational marginal prices in comparison to the initial case. Two case studies including modified IEEE 33-bus and 69-bus distribution networks are applied to evaluate the efficiency of the proposed approach.
1. Introduction
1.1. Background and Context
The widespread application of electric vehicles (EVs) in distribution networks led to an increase in electricity demand in the last decade, which caused several technical problems like the line overloading or congestion, an increase in electricity prices, a shortage of generation capacity, and an environmental pollution. Overloading of lines in the network causes incoordination between generation and consumption, defined as congestion in the distribution network. Congestion has some destructive effects on the network like a failure of equipment. Congestion in active distribution networks has been intensively examined [1], but less attention has been paid to it. High penetration of EVs and distributed energy resources like solar panels, wind turbines, and CHPs cause congestion in distribution networks, which is an enormous challenge to distribution system operators.
According to these explanations, the congestion or overloading of distribution system lines must be decreased and managed. Installing local distributed energy resources and installing flexible AC transmission systems encourage consumers to modify their consumption patterns through market-oriented approaches such as demand response (DR) programs, which are among the cases that distribution system operators can use to change the amount of active or reactive power at nodes [2]. The widespread use of diesel generators, traditional power plants, and PHEVs all contribute to increased air pollution. Recently, certain metropolitan regions have had trouble maintaining acceptable air quality levels, and high levels of key pollutants have sometimes surpassed allowable limits [3].
The scheduling of microgrids has attracted high attention, and various studies have been published in this context. So, this paper is going to investigate several related and updated articles in this subsection. A day-ahead microgrid operation including various renewable energy sources like wind turbines, solar panels, and PHEVs is discussed in [4]. Moreover, the uncertainties proposed in this paper are exactly formulated in the microgrid optimal management model utilizing the Monte Carlo simulation tool. A new stochastic nonlinear, nonconvex optimal operation of a microgrid equipped with compressed air energy storage and EVs is proposed in [5]. The information gap decision theory is utilized to overcome the probabilistic nature of the problem. Also, semidefinite programming is used to solve the problem. The author in [6] introduced optimal scheduling of smart microgrids equipped with distributed energy resources, DR programs, plug-in EVs, and diesel generators with the goal of total operating cost minimization while taking into account the benefits of emissions. Moreover, to investigate the risk related to the behaviors of EV owners, distributed energy resources, demand, and market electricity prices, the suggested model was developed as a two-stage stochastic programming problem.
1.2. Literature Review
The optimal operation of microgrids containing energy storage devices, plug-in hybrid EVs, and distributed energy resources is investigated [7]. The hybrid gravitational search and pattern search algorithm are applied to tackle the proposed problem. A multiobjective model has been formulated considering economic and environmental goals in the microgrid including EVs [8]. The linear weighting approach based on game theory was applied to coordinate the distributed energy unit consumption with the whole bearing of load and balance the two objectives better. In addition, an adaptive simulated annealing particle swarm optimization (PSO) algorithm was utilized to solve the proposed problem and obtain the optimum global solutions. The author proposes a new optimization problem that combines distributed energy resources and plug-in EVs by utilizing the probabilistic approaches to enhance the load supply and reduce microgrid dependence on the main grid [9]. Adaptive modified (AM)–PSO is applied for MG operation in the presence of MT/FC/battery hybrid power source with aim of reducing cost and emission [10]. A bilevel EV aggregator bidding strategy framework is discussed, in which the upper-level goal is the reduction of EV charging costs and the lower-level issue is the maximization of social welfare [11]. Network limitations are not taken into account, and it is also supposed that all resources like generation, EV aggregators, and loads are placed at a single bus.
A market-oriented distribution system reconfiguration process is presented for the optimal configuration of the system and locational marginal pricing. Hybrid firework and a game-based algorithm are considered to minimize the cost-based objective function [12]. Applying the genetic algorithm (GA), a new procedure in finding the optimal reconfiguration in the distribution system using DLMP is offered [13].
An efficient operation of virtual energy storage systems (VESSs) within a multicarrier energy system is proposed in [14]. It addresses the pressing challenge of managing the power demand by proposing a congestion management system. The problem is cast as a bilevel model, where the upper level is overseen by the independent system operator to mitigate congestion issues, and the lower level is under the control of VESS to maximize its benefits. To simplify the problem and find the global optimum, a linearization technique has been employed to transform the bilevel problem into a single-level optimization problem. A smart grid system characterized by a significant presence of EVs engaged in bidirectional power exchange offers the potential to utilize EVs for addressing network congestion [15]. This research introduces a game-theoretical strategy to formulate an intelligent pricing framework and create a mechanism for alleviating congestion within the grid. The game attains a distinctive Nash equilibrium, effectively addressing power congestion issues while maximizing benefit for EVs.
An investigation was conducted to examine the effects of wind farms, EV charging stations, and DR on network line congestion in different scenarios using both analytical methods and structural decomposition [16]. Furthermore, several indices were introduced to assess the impact of each factor on congestion during periods of low and peak demand. In [17], a two-stage framework is introduced, which combines a reconfiguration strategy addressing technical and security constraints with a game-theoretic approach for day-ahead scheduling in microgrids to prevent market power issues. The first stage focuses on solving the distribution feeder reconfiguration problem to minimize losses and reduce distribution line overloading, while the second stage deals with the day-ahead scheduling problem for the disco and microgrids. This problem is approached using a multiobjective optimization technique rooted in game theory, considering the network’s topology.
1.3. Novelties and Contributions
- a.
They have mostly concentrated on reducing congestion through implementing an action such as FACTS units or rescheduling of generators, and the effect of overloading on the DLMPs, and, as a result, the social welfare of the system are not thoroughly examined.
- b.
The congestion management of DERs has not been published on the multiobjective optimization of PHEVs charging and DR programs.
- c.
In addition, a suitable tool should be used to include the uncertainty associated with the production of wind and solar electricity into the issue.
- 1.
To solve the first shortcomings (a), an effective multiobjective optimization is developed in which minimize both operation costs and wind curtailment as well as maximize the amount of social welfare.
- 2.
To solve the second shortcomings (b), the effect of both EVs charging and discharging scheduling and DRPs implementation is simultaneously investigated to facilitate the optimal congestion management.
- 3.
To solve the third shortcomings (c), a coherent uncertainty management instrument based on Monte Carlo simulation has been employed.
- 1.
Optimal multiobjective scheduling of grid-connected microgrids by integrating hybrid EVs and DRP.
- 2.
Applying the distributed energy resources, various patterns of plug-in EVs arbitrage, and DR program to reduce the amount of congestion and smooth the DLMPs.
- 3.
Present a multiobjective framework to the suggested problem to minimize the operating cost of network and energy not supply.
- 4.
Using the Monte Carlo method to reduce the uncertainty of distributed energy resources and consumption load.
1.4. Paper Organization
This paper is organized as follows: The problem formulation is presented in Section 2. An overview of the evolutionary multiobjective seagull optimization algorithm (SOA) is provided in Section 3. Section 4 depicted simulations and numerical results. Finally, the conclusion is illustrated in Section 5.
2. Problem Formulation
A multiobjective problem is a type of optimization problem where multiple objectives need to be simultaneously optimized. In the defined problem, the two objectives are to minimize the total operating cost of the microgrid and to minimize the energy not supplied index, which is an indicator of the reliability of the system. The problem is further complicated by the fact that it is modeled as a mixed-integer, nonconvex, and nonlinear programming problems, which means that the decision variables involved are a combination of continuous and discrete variables, and the objective function is nonlinear and nonconvex. Solving such a problem requires specialized optimization techniques that can handle these complexities.
One such technique is the evolutionary multiobjective SOA, which is a metaheuristic algorithm inspired by the behavior of seagulls in nature. This algorithm is designed to search for the optimal solution by iteratively generating a population of candidate solutions and using various selection and mutation operators to evolve the population towards the Pareto-optimal front, which represents the set of solutions that cannot be improved in one objective without worsening another. By using this algorithm, it is possible to find a set of Pareto-optimal solutions that strike a balance between the two competing objectives, taking into account the system’s reliability and operating costs.
2.1. First Objective Function (Total Operating Cost of Microgrid)
2.1.1. The Cost of Power With Upstream Grid
2.1.2. The Cost of DERs
2.1.3. The Cost of Charge/Discharge of the Plug-In EVs
2.1.4. The Implementation Cost of DR Program
2.1.5. The Cost of Congestion
Overloading or congestion phenomena in distribution network lines can result in increased power losses, reduced system efficiency, and increased maintenance costs. To effectively manage these issues, it is important to develop accurate cost function models that can capture the operational and maintenance costs associated with these phenomena. The cost function model for overloading or congestion in distribution network lines typically includes several key parameters, such as the line capacity, the power flow, the voltage levels, and the cost of system losses. This cost can be modeled as a function of these parameters.
Additionally, the cost function model can be used to optimize the scheduling and DERs dispatch and DRPs to alleviate congestion. By incorporating the cost function model into the optimization algorithm, it is possible to identify the most cost-effective solutions for congestion management in distribution network lines, such as load shedding. Overall, the development of accurate and reliable cost function models for congestion in distribution network lines is essential for effective management and optimization of power systems. These models can help to identify the most cost-effective solutions for mitigating congestion, supporting the integration of DERs, and ensuring the reliability and efficiency of the power grid.
2.1.6. The Cost of Power Losses
2.2. Second Objective Function (ENS)
2.3. Constraints
2.3.1. Equality Constraints
2.3.2. Inequality Constrains
2.4. DER Modeling
2.4.1. Wind Turbine
2.4.2. Solar Cell
The standard operational PV temperature is described as the cell temperature when the photovoltaic units drop under 0.8 kW/m2 sunshine and 20 degree C of ambient temperature.
2.4.3. Combined Heat and Power Units
2.4.4. Consumption Load
2.5. Radiality Constraint
2.6. PHEVs Modeling
Different kinds of rechargeable batteries are installed on the PHEVs that can be recharged by connecting to the distribution network. Moreover, utilizing fossil fuel sources over long distances instead of battery energy is one of the abilities of these machines. To suitably model PHEVs behavior, some essential parameters that specify the charging behavior must be taken into account. Kind of charger, state of charge (SoC), PHEV number, capacity of the battery, time of charging, and charging length are the important parameters [24]. Generally, there are some uncertainties regarding the PHEV charging demand in both private and general parking lots. To manage the uncertainties driven by PHEVs, three different charging patterns are discussed in this section as follows: (i) uncoordinated charging pattern; (ii) coordinated charging pattern; and (iii) smart charging pattern; in the second approach, PHEVs are charged at any moment when linked to the charging point [25].
2.7. Distribution Locational Marginal Pricing Concept and Calculation
3. Providing an Overview of Evolutionary Multiobjective SOA (EMoSOA)
The optimization method may solve any metaheuristic optimization issue by finding the best global answers when exploration and usage characteristics are balanced properly. In order to maintain optimum convergence, the exploration process depicts variation in the search for novel answers on a global scale [30]. The primary idea behind the suggested algorithm is inspired by the seagulls’ typical activities. An adaptation of the seagull optimization technique for multiobjective optimization has been created using the four components [31]. The grid and archive controller are the two most important integrals since they hold the best nondominated Pareto answers. The later integrals use the pioneer selection method and evolutionary operators to choose the best option from the archive based on the prey’s direction.
3.1. Archive Controller
- •
If it is discovered that the archive is empty, the present answer should be adopted.
- •
Any answer that is mostly owned by someone in the archive should be rejected.
- •
The solution should be approved and kept in the archive if it is not dominated by the external population.
- •
The archive is emptied of answers if the new element dominates them.
3.2. Grid
The adaptive grid approach produces Pareto fronts [32]. There are four areas in the main function that are being used. When populations are outside of the grid region, they are established and measured using the grid technique [33]. The grid space is produced as a result of the hypercube being eventually distributed.
3.3. Leader Selection Mechanism
- •
The algorithm extends the traditional SOA, which is primarily a single-objective optimization technique, to handle multiple conflicting objectives. This adaptation allows for simultaneous optimization of various goals, such as minimizing costs and emissions, while maintaining system reliability.
- •
The algorithm incorporates adaptive mechanisms to dynamically adjust the search parameters. This adaptability enhances the algorithm’s ability to explore and exploit the search space effectively, leading to improved convergence rates and better-quality solutions.
- •
An innovative archive controller is implemented to maintain a diverse set of nondominated solutions. This feature ensures that the algorithm can provide a comprehensive Pareto front, representing the trade-offs between different objectives. The archive controller also adopts solutions when the archive is empty, facilitating a robust search process from the beginning.
- •
The algorithm is specifically designed to handle the uncertainties associated with renewable energy sources. By incorporating stochastic models for renewable generation, the algorithm can generate reliable and realistic scheduling plans that account for the variability and intermittency of renewable energy.
- •
The algorithm effectively integrates EVs and DR programs into the scheduling process. This integration not only enhances the flexibility of the microgrid but also optimizes the use of available resources, leading to improved operational efficiency and reduced overall costs.
- •
The proposed algorithm combines elements of seagull optimization with other optimization techniques, such as PSO and simulated annealing. This hybrid approach leverages the strengths of each technique, resulting in superior optimization performance compared to using any single method alone.
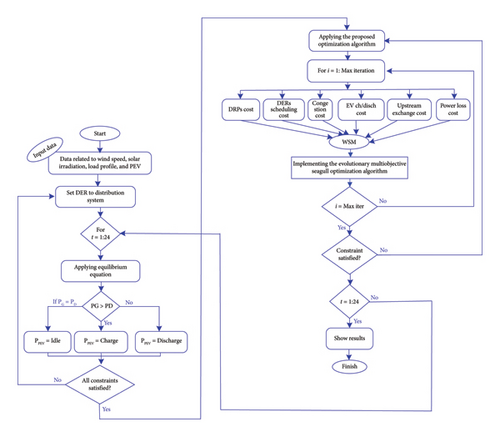
Figure 1 shows the flowchart of the suggested method. As can be seen from this flowchart, at first, the data of the DERs and network structure are entered. Then, by using these data, a backward–forward power flow has been performed. In the second step, a multiobjective optimization method has been used for the objective functions to minimize the total operation cost of the distribution system and maximize the amount of social welfare. In the end, optimal results have been obtained.
3.4. Step-by-step Explanation of the Proposed Method
-
Step 1: Enter data for distributed energy resources and network structure.
-
Step 2: Initialize the population of solutions and set algorithm parameters.
-
Step 3: Perform backward–forward power flow using the input data to determine the initial network state.
-
Step 4: Define objectives such as minimizing total operation cost and maximizing social welfare.
-
Step 5: Assess initial solutions against multiobjective criteria and calculate fitness values.
-
Step 6: Update and refine solution positions through migration and attack behaviors.
-
Step 7: Dynamically adjust control parameters to enhance convergence.
-
Step 8: Maintain and update an archive of nondominated solutions.
-
Step 9: Integrate stochastic models to account for renewable energy variability.
-
Step 10: Optimize the scheduling of EVs and DR strategies to enhance grid flexibility and reduce costs.
-
Step 11: Terminate the algorithm upon meeting convergence criteria and extract final nondominated solutions.
-
Step 12: Analyze the Pareto front to understand trade-offs and select the most suitable solutions based on practical constraints.
4. Simulation and Numerical Results
4.1. Case Study
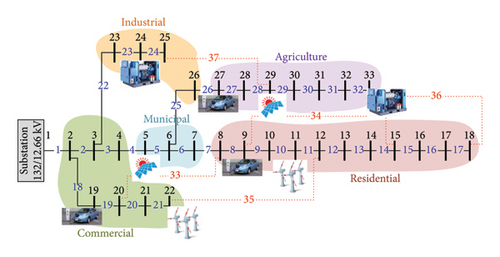
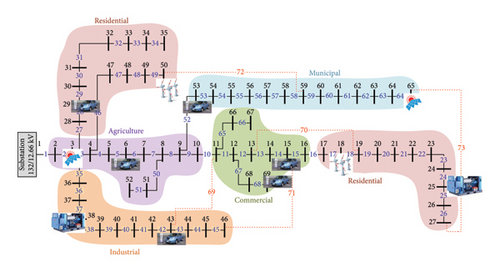
Two case studies, an IEEE 33-bus distribution system (Case I) and an IEEE 69-bus distribution system (Case II), are shown in Figures 2 and 3 [35] to see how well the suggested method works. As can be seen, the proposed network includes different areas with different consumptions, like industrial, commercial, and residential. Each region has several distributed energy resources and plug-in EVs that can optimally trade electric power with the grid and upstream grid. Two types of plug-in EVs containing battery EVs and plug-in hybrid EVs are taken into account for active distribution network optimization [36]. Also, the minimum and maximum amounts of solar irradiance, wind velocities, battery DoDs, and battery SoC have been added to the revised paper as shown in Table 1. The presented issue is resolved using EMoSOA in the MATLAB software in this research. The simulations are run on a laptop running Windows 10 that is equipped with an Intel (R) Core (TM), a CPU i7-4300 M, and 16 GB of RAM.
| Item | Lower bound | Upper bound |
|---|---|---|
| Solar irradiance (kW/m2) | 500 | 1000 |
| Wind velocity (m/sec) (moderate and fresh breeze) | 5.5 | 10.5 |
| Battery DoD (%) | 40 | 80 |
| Battery SoC (kW) | 0 | 500 |
4.2. Discussions
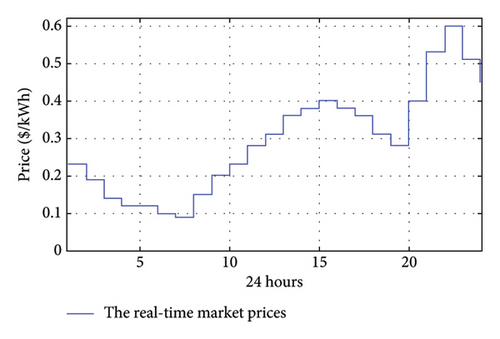
The real-time market prices for a day are shown in Figure 4 [37]. These prices are required for power transaction cost calculations with the upstream grid. DSO uses market prices to determine the cost of electric power purchased or sold with the upstream grid in the proposed scheduling horizon.
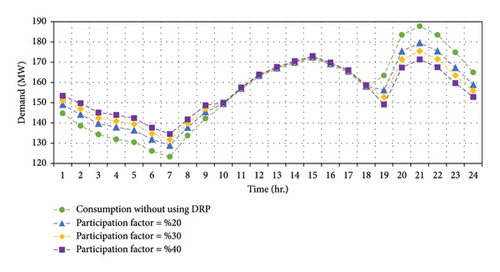
The total load consumption of the network for every hour is presented in Figure 5 [38]. As indicated, this work considered consumption without using DRP and various participation factors. As it can be seen from the figure, when the amount of participation factor increases, the impact of DRP on that load profile also increases. DRP tries to transfer consumption from the peak periods to off-peak periods. This is helpful to DSO to better schedule their available sources.
The amount of active power flow transactions for two case studies is illustrated in Figures 6 and 7. These are very important figures because if congestion or overloading phenomena happen in one or some of the distribution lines, outages are the result, and DSO cannot supply the local loads. This is the cause for customer dissatisfaction, and the amount of the social welfare index is significantly reduced. For this purpose, investigation of all lines’ active power flow is a critical issue for DSO. In both figures, the red line shows the distribution line capacity [39] and compares with the blue and black lines, which show the active power flow in presence of various resources. As can be seen from the figure, the amount of power flow is remarkably reduced in the presence of PHEVs, DERs, and DRP, which shows the efficiency of the proposed model.
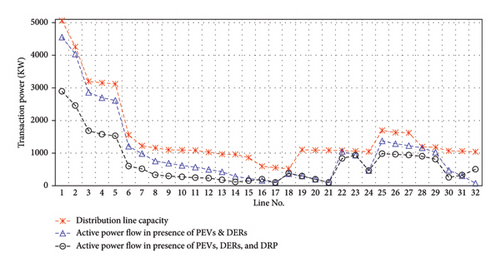
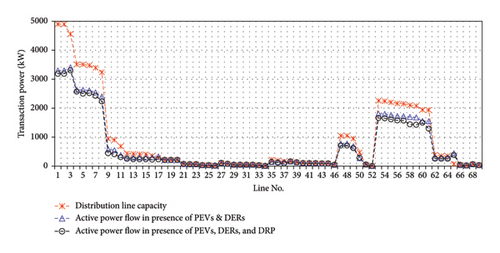
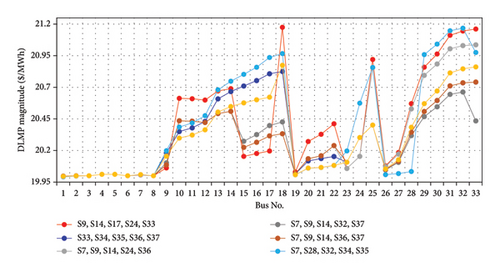
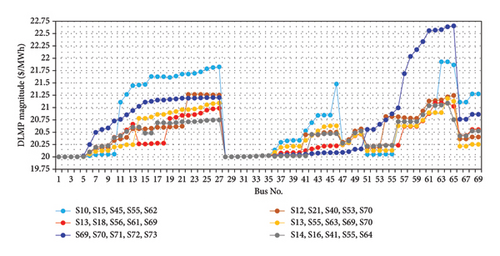
Figure 8 shows the effect of PHEVs, DRP, and the reconfiguration process on the suggested buses of the network, simultaneously. As can be observed, the initial configuration of the system is shown as a blue line and the best configuration of the system is indicated by the gray line, which is achieved from the proposed optimization technique. Figure 9 presents the effect of PHEVs, DRP, and the reconfiguration process on the suggested buses of the network, simultaneously. As can be observed, the initial configuration of the system is shown as a blue line and the best configuration of the system is indicated by the red line, which is achieved from the proposed optimization technique. By comparing all these lines, it is noticed that applying the proposed method has had a significant impact on DLMP smoothing.
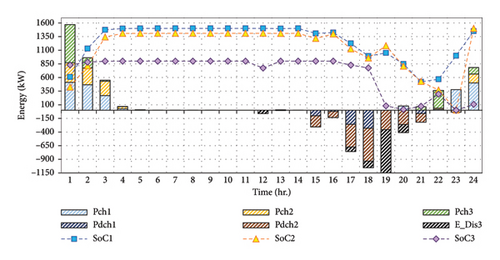
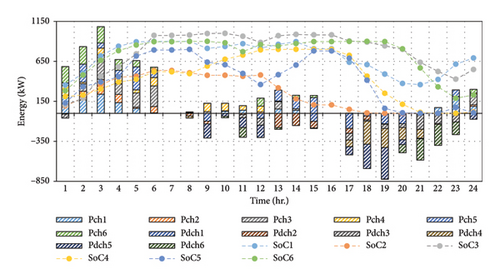
Optimal charging and discharging pattern of EVs are determined by the suggested algorithm and presented for the two case studies in Figures 10 and 11. The obtained scheduling is the result of the pattern search method, which suggests three schemes for the EVs owner to participate. As can be seen from this figure, various kinds of EVs are charging and discharging due to the pattern. For example, in Case II, at 3:00 a.m., all of the EVs are in charging mode (all of them located in the parking lots) and use electricity of the network. Because in this time of the day, the price of electricity is cheaper and its off-peak time of the day. Contrariwise, at 7:00 p.m., all of the EVs are in discharging mode and give back their power stored to the distribution network because in this time of the day the price of electricity is high and it is the peak time of the day. Also, the dashed line in this figure shows the SoC amount of each EV. The SoC level of each EV depends on the charging and discharging in that time. At both 7:00 a.m. and 4:00 p.m., the EV owners use their device and they are not connected to the distribution network, so the DSO cannot schedule and make pattern for these times of the day.
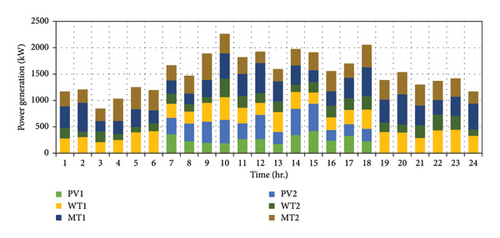
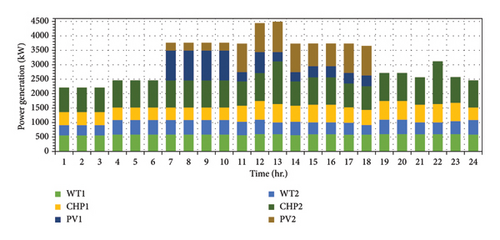
The DERs power generation amount is illustrated in Figures 12 and 13 for two case studies. As can be seen from these figures, the sum of the hourly production of DERs is related to the wind and solar uncertainties in the distribution network.
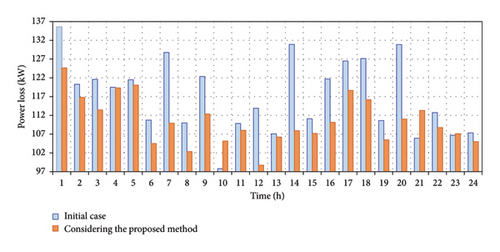
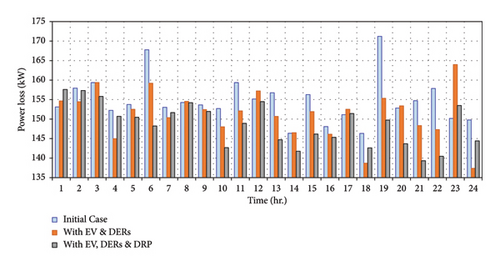
The active power loss amount in the various conditions for two case studies is depicted in Figures 14 and 15. The blue line column shows the initial power losses of the distribution network, which is achieved from the backward–forward power flow method. The dashed brown and black columns show the amount of power losses with EV and DERs and with EV, DERs, and DRP, respectively. As compared to these columns, the amount of power losses in the black column is remarkably reduced due to the other cases. It results that the suggested approach has had a good impact on the power loss.
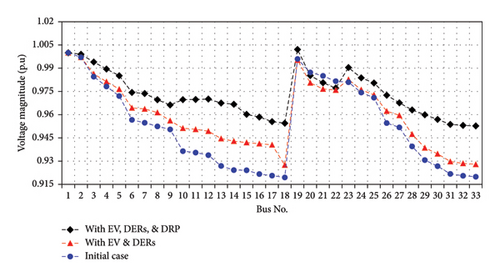
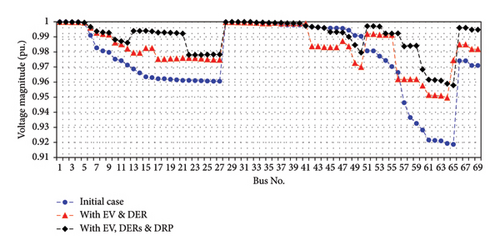
Figures 16 and 17 illustrate the value of voltage magnitudes for each node of the two case studies. Due to these graphs, the blue dashed line shows the initial voltage magnitudes that are obtained from the backward–forward power flow technique. The permissible dynamic stability limitation of the voltage in the distribution network is defined from 0.9 to 1.1 per unit. The red and black dashed lines of these graphs show the amount of voltage magnitude with EV and DERs and with EV, DERs, and DRP, respectively. As can be seen, the suggested method has had a good impact on the voltage profile improvement.
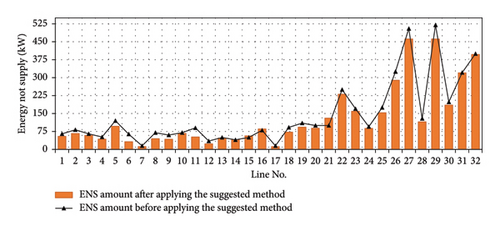
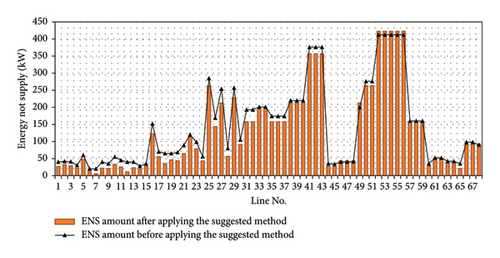
Figures 18 and 19 show the energy not supplied for each section. The ENS of each section is calculated by using the objective function (20), and the suggested algorithm is used to minimizing the total amount of ENS in order to enhance the reliability service goals.
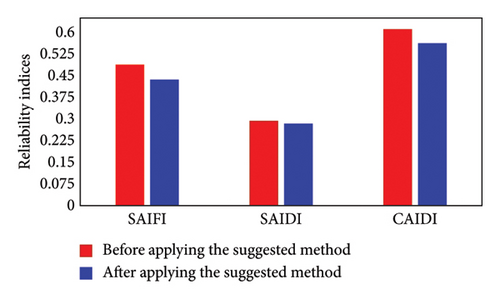
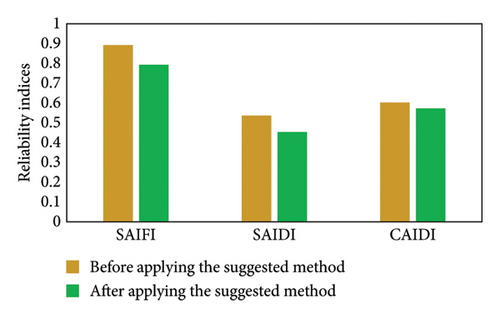
Figures 20 and 21 show the SAIFI, SAIDI, and CAIDI indices as essential reliability metrics for the 33-bus and 69-bus distribution networks, respectively. The results depicted in these visual representations underscore the noteworthy impact of integrating plug-in hybrid EVs and implementing DR programs in conjunction with the reconfiguration technique. Evidently, this combined approach stands out as a potent strategy, leading to a discernible enhancement in the reliability indices of the distribution systems. The demonstrated outcomes underscore the efficacy of synergizing emerging technologies and innovative strategies to bolster the robustness of these vital networks.
Tables 2 and 3 display the values of the first and second objective functions. These tables present the objective function values both before and after the implementation of the proposed method.
| Case study | Operating cost with distributed generation sources after load flow ($) | Operating cost with electric vehicles, demand response program, and network reconfiguration ($) | Percentage improvement in operating cost (%) |
|---|---|---|---|
| 33-Bus system | 4517.00 | 3618.25 | 19.89 |
| 69-Bus system | 35,368.10 | 28,677.16 | 18.91 |
| 85-Bus system | 77,748.60 | 45,700.00 | 41.22 |
| Case study | ENS amount before the proposed method implementation | ENS amount after the proposed method implementation |
|---|---|---|
| 33-Bus system | 4513 | 4080.12 |
| 69-Bus system | 9628 | 8873 |
| 85-Bus system | 80,447 | 63,103 |
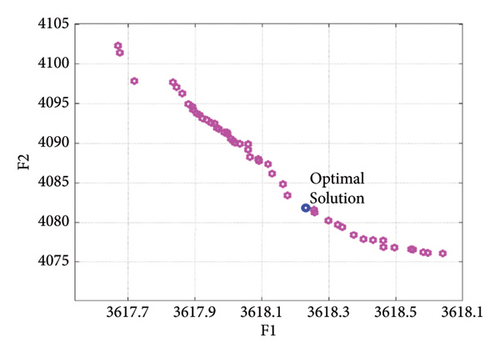
Figure 22 plots the operation cost of the microgrid with the amount of ENS. It demonstrates the trade-offs between these two objectives. In the figure, the blue points represent the optimal solutions, showcasing the best balance between minimizing both the operational costs and the ENSs.
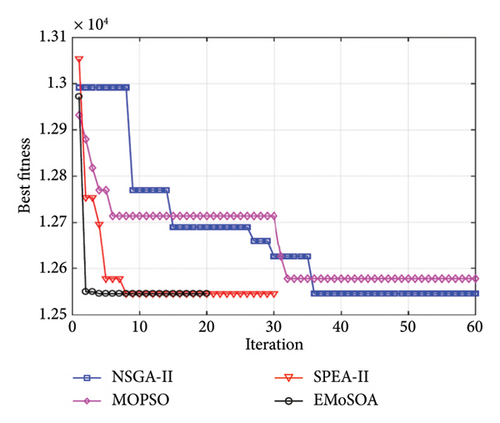
The performance of the EMoSOA in comparison with other algorithms, such as PSO, GA, and gray wolf optimization (GWO) algorithm, is presented in Figure 23. According to this figure, the speed and convergence rate of the EMoSOA are higher compared to other optimization methods.
5. Conclusion
- i.
Exploring the potential benefits of integrating energy storages into MGs to enhance their flexibility and resilience.
- ii.
Conducting field experiments and pilot studies to evaluate the real-world performance and scalability of the proposed management strategies in different settings.
- iii.
Evaluating the environmental and economic benefits of the proposed scheduling and management strategies and comparing them to other approaches for achieving sustainable and efficient energy systems.
Nomenclature
-
- BES
-
- Battery energy storage
-
- CHP
-
- Combined heat and power
-
- CM
-
- Congestion management
-
- DER
-
- Distributed energy resources
-
- DLMP
-
- Distribution locational marginal pricing
-
- DoD
-
- Depth of discharge
-
- DRP
-
- Demand response program
-
- DSO
-
- Distribution system operator
-
- EMoSOA
-
- Multiobjective seagull optimization algorithm
-
- ENS
-
- Energy not supplied
-
- FACTs
-
- Flexible AC transmission systems
-
- GWO
-
- Gray wolf optimization
-
- GA
-
- Genetic algorithm
-
- MG
-
- Microgrid
-
- MST
-
- Minimal spanning tree
-
- PDF
-
- Probability density function
-
- PHEV
-
- Plug-in hybrid electric vehicle
-
- PSO
-
- Particle swarm optimization
-
- SoC
-
- State of charge
-
- WT
-
- Wind turbine
-
- t
-
- Index of time
-
- l
-
- Index of line
-
- b
-
- Index of SEVs
-
- k
-
- Index of DERs
-
- NDER
-
- Set of DERs
-
- NSEV
-
- Set of SEVs
-
- Nl
-
- Set of distribution system line
-
- F1
-
- First objective function (total operating cost of microgrid)
-
- F2
-
- Second objective function (costumers’ energy not supply)
-
- CUpstream
-
- The cost function of power exchange with upstream grid
-
- CDER
-
- The cost function of power generated by DERs
-
- Cch/Dch
-
- The cost function of charging and discharging power by EVs
-
- CDR
-
- The cost function of demand response implementation
-
- CCong
-
- The cost function of congestion phenomena
-
- CLoss
-
- The cost function of microgrids power loss
-
-
- The hourly amount of power exchange with upstream grid
-
-
- The cost factor of the upstream grid at time t
-
-
- The amount of power generation by DERs at time t
-
-
- The cost factor of DERs at time t
-
- Pbt
-
- The amount of power charged/discharged of EVs at time t
-
- Cbt
-
- The cost factor of charged/discharged of EVs at time t
-
- Ubt
-
- The operation factor at time t
-
- DRt
-
- The amount of power consumption in demand response program
-
- Pt,l
-
- Active power flow of lth line
-
-
- Capacity of active power flow at lth line
-
- μt
-
- Cost coefficient that converts the amount of power to cost
-
- Rl
-
- lth line resistance
-
- Ilt
-
- The amount of current of line l at time t
-
- ENSi
-
- Energy not supplied at bus i
-
- Pi(…)
-
- The portion of each kind of loads including industrial commercial, residential, general, and agriculture
-
- ki
-
- The importance of ith load in the distribution network
-
- λ
-
- Failure rate
-
- U
-
- Average outage time
-
- r
-
- Repair rate
-
-
- The amount of power consumption at time t
-
-
- The amount of charged power by PEVs at time t
-
-
- The amount of discharged power by PEVs at time t
-
-
- The amount of power losses at time t
-
-
- The amount of generated power by PV arrayes
-
-
- The amount of generated power by WTs
-
-
- The amount of generated power by CHP units
-
- Vi
-
- Voltage magnitude at ith bus
-
-
- Minimum and maximum bound of voltage profile
-
- v
-
- Wind speed of the farm under study
-
- vc in
-
- Cut-in speed
-
- vc out
-
- Cutout speed
-
- vrat
-
- Rate speed of the WT
-
- c1, c2
-
- Acceleration coefficients
-
- TC, Tref
-
- Cell and air temperature of PV units
-
- Ta
-
- Ambient temperature
-
- GING, GSTG
-
- Solar irradiance in standard and study condition
-
- G
-
- Global solar radiation
-
- NOCT
-
- Normal operating cell temperature of PV
-
-
- Rated power of the WT installed in bus i
-
- PSTG
-
- Rated output power by the module under standard test condition
-
- x, γ
-
- Beta function parameter
-
- Frk
-
- Frequency of event k
-
- Prk
-
- Probability of event k
-
- ACIF
-
- Average cutoff frequency of the consumer
-
- ACIT
-
- Average customer outage time
Disclosure
A preprint has previously been published [40].
Conflicts of Interest
The authors declare no conflicts of interest.
Funding
This research did not receive any specific grant from funding agencies in the public, commercial, or not-for-profit sectors.
Open Research
Data Availability Statement
The data that support the findings of this study are available from the corresponding author upon reasonable request.


