Investigating Configuration-Induced Changes in Hybrid Microgrid (HµG) Parameters for Grid-Connected and Standalone Modes
Abstract
The integration of renewable energy sources into hybrid microgrids (HµGs) holds the potential to improve grid voltage profiles, but without proper optimization, it can also lead to performance degradation. This study offers an explorative investigation into the dynamic behavior of HµGs under various configurations, operating in both grid-connected and standalone modes. Through technical analyses, an energy system design is presented for comparing performance across different scenarios. In contrast to previous research, HµGs incorporating solar photovoltaic (PV) systems, wind turbine generation (WTG), diesel generators (DG), and battery energy storage systems (BESS) are modeled. Two operational cases—grid connected (Case 1) and standalone (Case 2)—are simulated, each evaluated through three scenarios using MATLAB/Simulink. Key parameters such as HµG voltage, frequency, power contributions, and battery state of charge (SoC) are analyzed, revealing significant challenges and insights into system behavior. The study shows that changes in system configuration impact HµG voltage and frequency, with maximum deviations reaching 54 Hz, 17 kV, and 5.8 kV. Frequency instability is observed in scenarios involving WTG integration, while sensitivity analysis highlights the critical role of load variations on frequency stability. This research provides actionable benchmarks for network planners and operators to ensure efficient integration of renewable energy into power grids.
1. Introduction
The rapid urbanization of the global population is exerting immense pressure on social, environmental, and infrastructural systems, with the energy sector facing particularly significant challenges. This strain is most evident in the persistent global energy deficit, which is disproportionately concentrated in Africa [1]. The COVID-19 pandemic has further exacerbated this issue, pushing over 20 African countries toward debt distress and severely impeding progress in expanding electricity access [2]. Renewable energy has emerged as a pivotal solution for achieving the United Nations’ Sustainable Development Goal 7 (SDG 7), which aims to provide affordable, reliable, sustainable, and modern energy for all [3]. However, the inherent variability and intermittency of renewable energy sources (RES), such as solar and wind, present significant technical challenges, particularly in terms of grid integration and reliability. These challenges have catalyzed extensive research and development efforts, particularly in distributed generation (DG) technologies, over the past few decades [4]. A major advancement in this field is the smart grid, a sophisticated power network that facilitates bidirectional communication between consumers and DG sources. Smart grids are often referred to as next-generation power systems due to their ability to create a globally distributed, automated energy distribution network through the integration of two-way electrical and information flows.
Microgrids (μGs) emerge as an innovative and highly efficient strategy for the generation and distribution of electricity. A μG is defined as a cluster of loads and micro power sources that operate cohesively as a single, controllable entity, providing both power and heat to localized areas [5]. These systems are a cornerstone of modern distributed power systems, aligning closely with smart grid initiatives by harnessing local, sustainable energy sources. μGs are not only flexible and intelligent networks—sometimes referred to as active power networks—but also offer significant potential for enhancing the penetration of renewable energy resources. Importantly, μGs can operate independently from the main utility grid, offering local communities energy security and resilience [6]. The technical advantages of μGs extend beyond energy security; they also enhance the overall reliability, efficiency, and security of the power system. In broader terms, μGs can be characterized as medium or low-voltage distribution grids that integrate DG, hybrid systems, and energy storage devices to deliver electrical energy to end users [7]. When well-designed and coupled with energy storage systems (ESS), μGs can be seamlessly integrated into existing power networks, optimizing the balance between energy generation and electricity consumption without disrupting the load [8]. Moreover, the implementation of μGs plays a critical role in reducing greenhouse gas emissions and mitigating the impacts of climate change [9].
A μG can be configured in various ways: it can operate in parallel with the main utility grid, known as grid-connected mode, function independently as an islanded system, referred to as standalone or off-grid mode, or transition between these two modes [10]. In grid-connected mode, the μG can supply electricity to all connected loads; however, during grid outages, it ensures uninterrupted power to critical loads by prioritizing their operation. This mode also supports the main grid and conserves fossil energy when the μG is functioning properly. In off-grid mode, the μG relies solely on local micro sources, such as wind, photovoltaic (PV) systems, fuel cells, and small hydroelectric plants, to power the load.
µGs can also be classified based on the type of voltage they use, with the primary categories being AC μGs, DC μGs, and hybrid AC/DC μGs [11]. Among these, AC μGs are the most prevalent due to their numerous advantages, including the plug-and-play compatibility with all distributed energy resources (DERs), well-established interconnection protocols, product standards, and norms. On the other hand, DC μGs offer lower conversion losses when delivering power and are more efficient in transmission, with no skin effect and reduced transmission losses. Hybrid AC/DC μGs are gaining significant attention as they combine the strengths of both AC and DC systems [12]. These μGs are particularly advantageous when the energy sources and loads differ in their voltage types—for instance, when a DC source like PV powers an AC load. The key feature of hybrid AC/DC μGs is that they integrate both AC and DC networks within the same distribution grid, allowing for the seamless connection of AC- and DC-based DG, ESS, and loads. This integration facilitates the efficient inclusion of RES or electric vehicle (EV) units with minimal modifications to existing distribution infrastructure, thereby reducing overall costs [13].
- i.
A concise review of μG architectures and control strategies was carried out.
- ii.
We successfully modeled and simulated real-world scenarios of standalone and grid-connected HµGs, providing actionable insights into their dynamic behavior.
- iii.
We revealed the critical role of wind turbines in influencing frequency stability and attributed to the unique characteristics of induction generators.
- iv.
We highlighted the impact of load variability on system frequency stability, emphasizing the need for robust load management strategies.
Therefore, the remaining parts of the study are organized as follows: Section 2 presents an overview of the μG classification and control, Section 3 discussed the methods used in this study, Section 4 discussed the results obtained from the simulations in Sections 3, and the study is finally concluded in Section 5.
2. Overview of μG Classification and Control
μGs can be generally classified based on various parameters like as signal type and energy sources. For electrical system-based classification of μGs, the AC μG which uses alternating current (AC) combines traditional generators and renewables and typically involves AC buses and synchronized control. Whereas DC μG operates solely on direct current and incorporates components such as PVs, batteries, supercapacitors, and fuel cells, DC μG is advantageous in that it offers flexible operating modes and efficient control for renewable integration. On its own, the hybrid AC/DC μG utilizes both AC and DC buses for its operation thereby making it more complex. It is highly reliable and capable of powering both AC and DC load types. Simulations studies have shown that though costlier but often more economically viable [17–22].
When the classification of μGs is considered from constituent, the nonrenewable-based μG leverages on fossil fuels generators which negates the current global push toward cleaner alternatives. The renewable-based μG harnesses energy from clean sources like solar and wind. This class is advantageous as it offers emission-free, sustainable solutions and is highly useful for providing energy access for remote or underserved areas [23–25]. The constituent-based μG can as well be configured in hybrid mode to combine multiple sources to include renewables and nonrenewables to achieve enhanced resilience and flexibility. This μG typically integrates various energy technologies such as solar, wind, and diesel to adapt to different operational scenarios [26–29]. Hence, it can be asserted that μG can be operated in both off-grid and grid-connected configurations. In off-grid or standalone μG, the operation is independent from the utility grid to offer quality supply but requires more investment whereas the grid-connected μG interconnects the utility grid for its operation to offer cost-effective and reliable solutions. This type requires energy storage and advanced control systems. They are mostly found in urban areas of Africa [30–33].
μG control plays a crucial role in the operation of μG as it ensures efficient energy management. There are a number of control strategies developed for various purposes in μG applications. Hierarchical control is a multilevel approach with central and local controls. The centralized control is one in which central system manages all operations making it efficient but vulnerable to single-point failures [34–37]. In decentralized control, each component is managed individually thereby making the μG to be fault tolerant though at higher cost. The multiagent systems are one of the recent advanced strategies that use multiple autonomous agents, and it is often integrated with other control techniques to ensure optimal performance [38–45]. Table 1 reports some of the μG types, configurations, and characteristics.
| References | μG type | Configuration | System components | Characteristics |
|---|---|---|---|---|
| [46–48] | DC | Hierarchical control strategy |
|
|
| [49–52] | AC | Centralized control architecture |
|
|
| [53–55] | AC | Decentralized |
|
|
| [43, 56] | AC | Distributed multiagent |
|
|
| [56–58] | DC | Distributed multiagent |
|
|
| [28, 38] | AC | Hybrid stand-alone microgrids (SAMGs) |
|
|
| [39, 59] | AC | Standalone microgrid |
|
|
| [60, 61] | DC | Distributed cooperative control strategy |
|
|
3. Methods
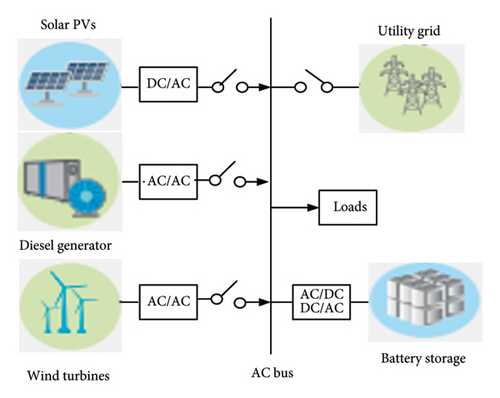
3.1. Model of the Wind Turbine
The air density is given by ρ = (1.225 kg/m3), and Ar is the blades’ swept area, which is 1735 m3.
3.2. Model of Solar PV Output Power
3.3. Model of DG
3.4. Model of Battery ESS
3.5. Model of the Utility Grid
3.6. Model of the Loads
- a.
constant power characteristic: mp = mq = 0
- b.
constant current characteristic: mp = mq = 1
- c.
constant impedance characteristic: mp = mq = 2
3.7. HµG Configuration Variants and Analysis
Having modeled each component of the HµG system, we now analyze the HµG using HµG voltage, HµG frequency, wind power, PV power, battery power, DG power, and battery SoC. To enable this analysis, two cases, namely, Cases 1 with Scenarios 1, 3, and 5 and Case 2 with Scenarios 2, 4, and 6, were created to represent grid-connected and standalone system, respectively. These scenarios were simulated in the MATLAB/Simulink environment. The subsequent expressions illustrate the various HµG system configurations in this study.
3.7.1. Case 1
- i.
Scenario 1:
-
The HµG is made up of the BESS open circuit voltage, PV power, wind turbine generation, DG power, and the grid as given in (26).
() - ii.
Scenario 3:
-
The HµG is made up of the BESS open circuit voltage, wind turbine generation, DG power, and the grid as given in (27).
() - iii.
Scenario 5:
-
The HµG is made up of the BESS open circuit voltage, PV power, DG power, and the grid as expressed in (28).
()
3.7.2. Case 2
- i.
Scenario 2:
-
The HµG is made up of the BESS open circuit voltage, PV power, wind turbine generation, and diesel generation power as expressed in (29).
() - ii.
Scenario 4:
-
The HµG is made up of the BESS open circuit voltage, PV power, and diesel generation power as shown in (30).
() - iii.
Scenario 6:
-
The HµG is made up of the BESS open circuit voltage, wind turbine generation, and diesel generation power as shown in (31).
()
The list of the scenarios’ configurations and corresponding models in this study is summarily presented in Table 2.
| Cases | Scenarios | Configurations | Model |
|---|---|---|---|
| 1 | 1 | Battery, PV, WTG, grid, DG | PTS1 = VOCV + Ppv + PW + PZ + P0 |
| 1 | 3 | Battery, WTG, grid, DG | PTS3 = VOCV + PW + PZ + P0 |
| 1 | 5 | Battery, PV, grid, DG | PTS5 = VOCV + Ppv + PZ + P0 |
| 2 | 2 | Battery, PV, WTG, DG | PTS2 = VOCV + Ppv + PW + P0 |
| 2 | 4 | Battery, PV, DG | PTS4 = VOCV + Ppv + P0 |
| 2 | 6 | Battery, WTG, DG | PTS6 = VOCV + PW + P0 |
3.7.3. Frequency Deviation
3.7.4. Sensitivity Analysis
- a.
Finding a nominal point close to 50 Hz is the first step. A number of values are combined to see which correct combination gives the crisp or a close enough value.
- b.
Variation of frequency in percentage up and down some system parameter value when the system is working in steady state (≈50 Hz).
- c.
Plotting the tornado plot in excel using the data obtained from running the varied parameters.
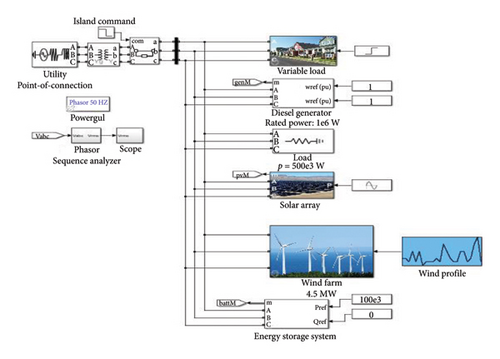
The simulation settings for different scenarios and sensitivity analysis are summarily presented in Table 3, and the MATLAB/Simulink diagram is presented in Figure 2.
| Variations | PV (kW) | WTG (MW) | DG (MW) | BESS (kW) | Load (kW) | Variable load (kW) | L—L voltage (kV) |
|---|---|---|---|---|---|---|---|
| Original setting | 250 | 2 | 0.2 | 250 | 510 | 400 | 10 |
| 20% up | 300 | 2.4 | 0,24 | 300 | 612 | 480 | 12 |
| 20% down | 200 | 1.6 | 0.16 | 200 | 408 | 320 | 8 |
| 75% up | 437.5 | 3.5 | 0.35 | 437.5 | 892.5 | 700 | 17.5 |
| 75% down | 62.5 | 0.5 | 0.05 | 62.5 | 127.5 | 100 | 2.5 |
| 150% up | 625 | 5 | 0.5 | 625 | 1275 | 1000 | 25 |
| 150% down | −125 | −1 | −0.01 | −125 | −225 | −200 | −5 |
4. Results and Discussions
The simulation results obtained for the cases were presented and discussed in this section.
4.1. Case 1 Results and Discussions
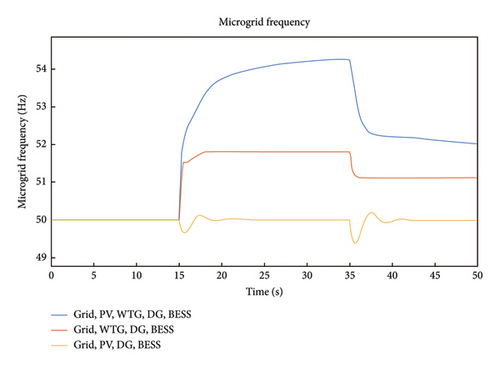
The HµG frequency response for Scenario 1 is depicted in Figure 3 from which it is observed that the frequency deviates from its nominal values (50 Hz) to a peak of 54.25 Hz at 15s. In the Scenario 3, HµG frequency response is observed that the HµG frequency maintains stable 50 Hz frequency until time 15s where it vacillated for a period of approximately 4s then attains stability for another 15s. The HµG frequency response for Scenario 5 shows a frequency up shoots of 51.5 Hz, 51.7 Hz, and 51.1 Hz at 15s, 32s, and 35.7s, respectively. The vacillation of the system frequency at 15s is as a result of cut-in power of the WTG.
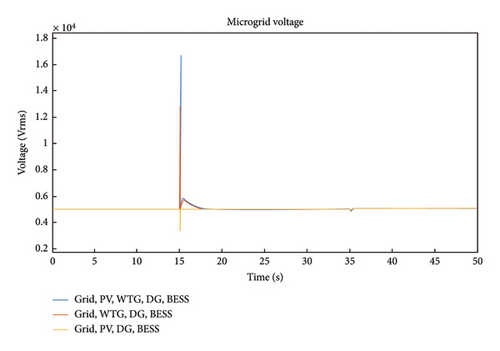
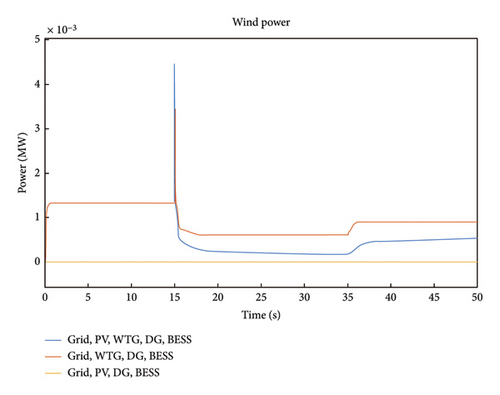
In Figure 4, the HµG voltage response of Scenarios 1, 3, and 5 is presented. It is noted that Scenarios 1 and 3 experienced spike while Scenario 5 dips between 15 and 17.85s. The system returned to stability that lasted for about 15s and experienced another voltage dip at time 35s to a voltage magnitude of 4.9 kV. Again, the system returned to stability after 4s and maintained the stable 5 kV for the rest of the period under consideration. The wind power for Case 1 is presented in Figure 5. From the Figure, the time 0.09s, 15s, and 35s are notable for Scenarios 1 and 3 due to jumps in the system power. It was observed that the largest power fluctuations occurred in Scenario 1 at time 35s with power value of 4.5 MW. This is attributed to the variability of wind and solar resources and also demonstrates the complementarity of these resources. Note from the Figure that the wind power for Scenario 5 is zero throughout the period under consideration because wind turbine is not present in Scenario 5 configuration.
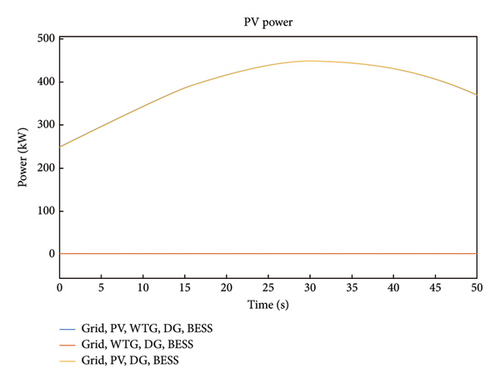
In Figure 6, the PV power for Case 1 is illustrated where it was observed that the response for Scenarios 1 and 5 starts from 250 kW at time 0s rises gradually to a peak value 448 kW at time 30s where it starts to diminish gradually. It is noted that the PV power for Scenario 3 is zero throughout the period under consideration due to the absence of PV in that scenario.
The HµG DG power is shown in Figure 7 for Case 1 where the DG power is 50 kW for 15s. At 15s, a small spike of 200 kW in Scenario 5 was observed while a dip to −1305 kW was observed in Scenarios 1 and 3. At time 35s, another spike was noticed in all the scenarios with Scenario 5 attaining and retaining above 400 kW while Scenarios 1 and 3 spiked to 200 kW but diminishes to a 0 kW at time 39s and maintains that power value.
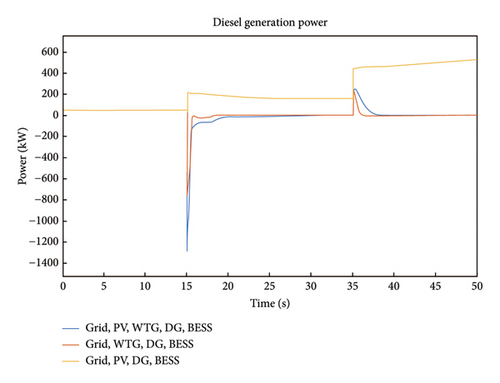
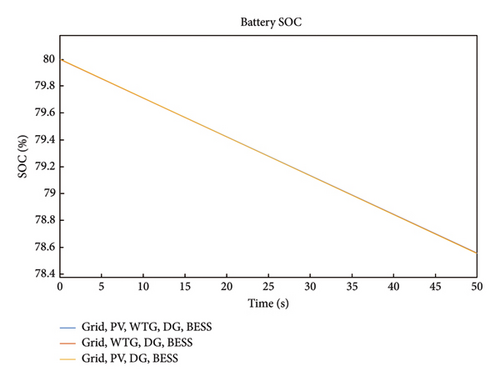
Figure 8 presents the response of battery SOC for Case 1. The SOC is the ratio of a battery’s available capacity to the maximum charge that can be stored. For the three scenarios presented in this case, it is seen that the battery SOC dropped from 80% to 78.55% for the 50s under consideration. By implication, if the discharge is kept constant and the battery is full charged with DoD of 20% then, the system autonomy would be 46 min.
The battery power for case 1 is presented in Figure 9 to demonstrate that the battery maintains a constant power of 100 kW perpetually. It implies that the battery maintains constant power supply during the period under consideration. It should be noted that this is consistent for all the scenarios.
4.2. Discussion of Case 2 Result
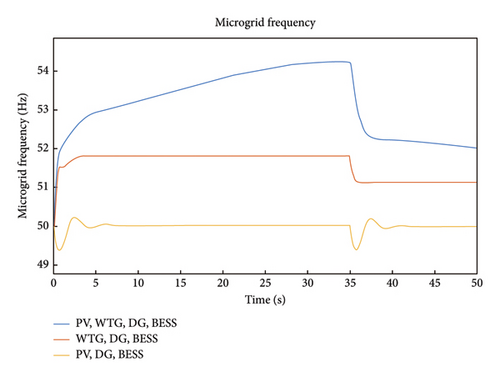
The frequency response of the HµG for Scenario 2 is presented in Figure 10. It is noted that the HµG in Scenario 2 experienced intense frequency fluctuations that lasted for 36s where it reaches its peak of 54 Hz. For Scenario 4, the HµG frequency response showed a spike in frequency to about 51.7 Hz at 3s where it stays constant for a duration of 34s and it then drops down to a constant value of 51.2 Hz. The frequency response of Scenario 6 shows frequency oscillations between 0 and 9s and repeats itself between 35 and 43s.
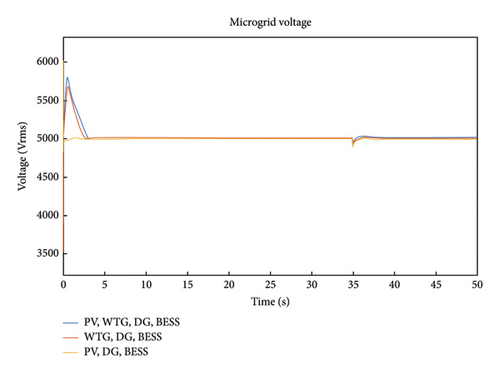
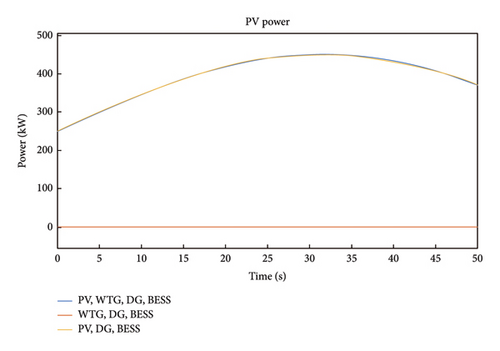
In Figure 11, Scenarios 2 and 4 revealed a spike in HµG voltage to 5.8 kV between 0 and 3s. The system stabilizes till 35s where a short duration dip occurred. This can be attributed to the variability in the speed of WTG and the cut-out power of the WTG. For Scenario 6, the HµG voltage response has a relatively steady behavior around the system nominal voltage of 5 kV with minimal oscillations at 0s, 35s, and 39s. Figure 12 presents the PV power for case 2, and it is noted from the response for Scenarios 2 and 6 that the PV power starts from 250 kW at time 0s rises gradually to a peak value 448 kW at time 30s where it starts to diminish gradually. It is observed that the PV power for Scenario 4 is zero throughout the period because PV is absent in the scenario.
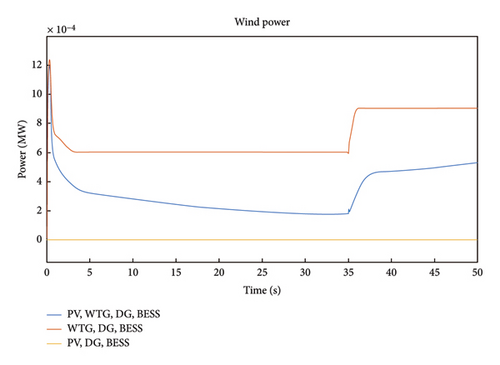
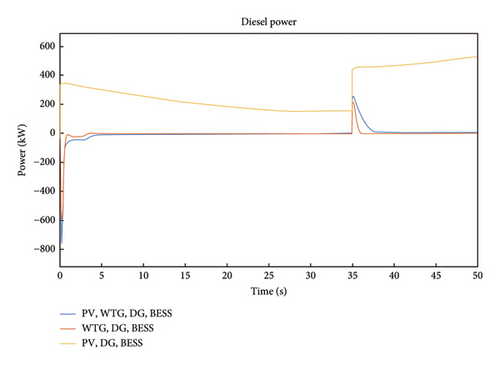
The wind power for Case 2 is shown in Figure 13 where it is noted that the wind power for Scenarios 2 and 4 spiked to about 12 MW. The power dropped to about 1.9 MW in Scenario 2 and finally rises to a 5.2 MW at 35s till the end of duration. In Scenario 4, the power dropped to about 6 MW at 4s and maintained this value till around 35s when the power rises to 9 MW. The change in the wind power can be attributed to the variability in the speed of WTG. It should be that the wind power for Scenario 6 is zero because wind turbine is absent in the configuration of Scenario 5. The HµG DG power for Case 2 is presented in Figure 14. It is observed that the DG power rises about 350 kW for Scenario 6 dips to −780 kW and returned to about 0 kW at 7s in Scenarios 2 and 4. At time 35s, another rise in power to 450 kW was observed in Scenario 6 while Scenarios 2 and 4 spiked to 200 kW but diminishes to a 0 kW between 35 and 38s.
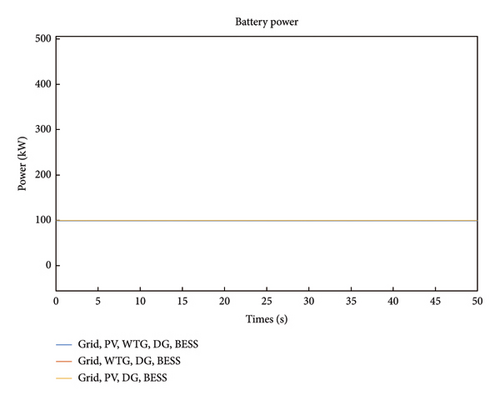
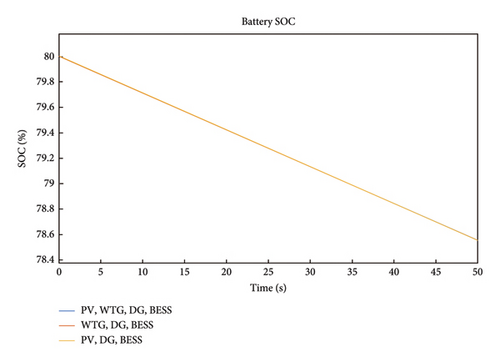
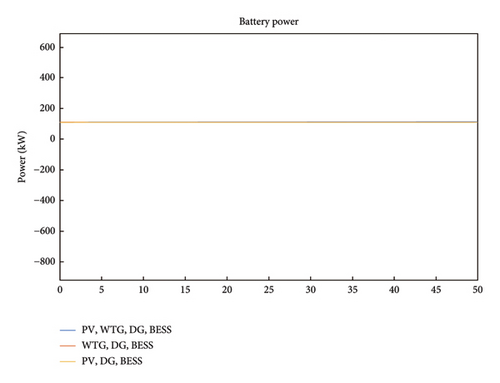
In Figure 15, the waveform of Scenario 2 battery SOC is illustrated where the y-axis represents the percentage (%) values of the battery charge levels and the x-axis represents the time (t). The SOC is the ratio of a battery’s available capacity to the maximum charge that can be stored. The SOC of a completely charged battery is 1 or 100%, whereas the SOC of a fully depleted battery is 0 or 0%. The three scenarios presented in this case revealed that the battery SOC dropped from 80% to 78.55% for the 50s under consideration. This implied that if the discharge rate is kept constant and the battery is fully charged with DoD of 20%, then the system autonomy for this configuration would be 46 min. It should be noted that the DoD can be extended by increasing the battery bank capacity. The battery power for Case 2 is shown in Figure 16 which is similar to that of Case 1 where the battery maintains a constant power of 100 kW perpetually. Again, it can be inferred that it can be said that the presence of the grid has no effect on the battery power.
4.3. Frequency Deviation
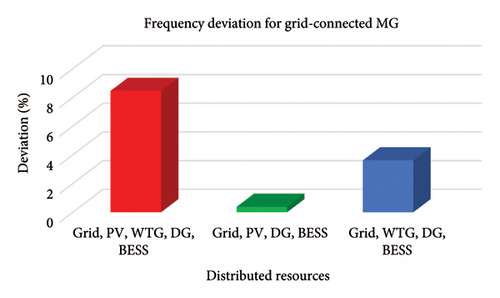
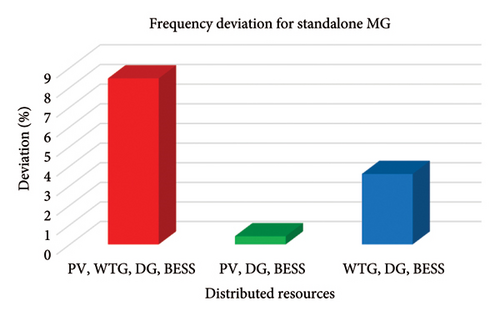
The frequency deviation of the HµG was determined for different scenarios of both cases to ascertain if any of the scenarios violates the acceptable system deviation of 49.8 Hz–50.5. The result of the frequency deviation for Case 1 and Case 2 is presented in Figures 17 and 18, respectively. It can be observed from the figures that the HµG experienced greater frequency deviation that violates the acceptable limits of ±2%, i.e., 49.8 Hz to 50.5 for a 50 Hz system when WTG is present in the Scenarios, namely, 1, 2, 3, and 6 and less frequency deviation was experienced in Scenarios 4 and 5 without WTG. This implies that the wind turbine has great influence on the frequency stability of the HµG due to the presence of induction generator and the intermittency and stochastic nature of wind which makes its power swings at random. This result is in line with the assertion that massive penetration of wind power into the grid increases the issue of power quality, which degrades grid frequency quality [63].
4.4. Sensitivity Analysis
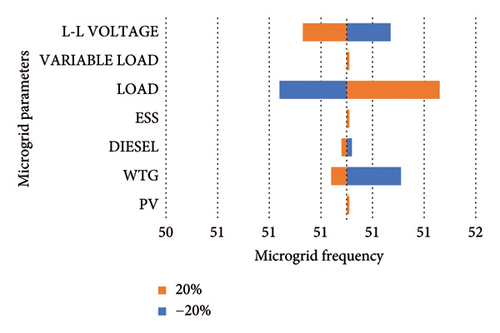
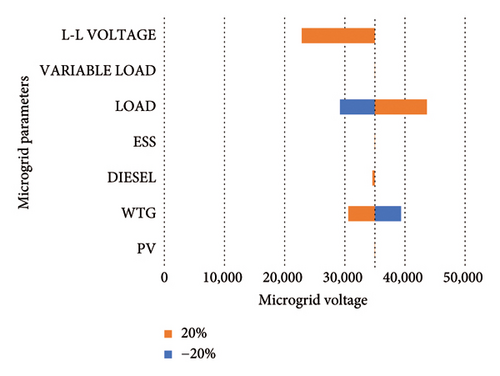
The result of the sensitivity analysis is presented using Tornado plot in Figures 19 and 20 for HµG frequency and HµG voltage. As seen from the plot, the load appears to be the system component that has the most significant effect on system frequency stability both at positive and negative 20% variations. This was followed by WTG which also affected the system frequency stability at positive and negative 20% variations. The implication of this result is that the more load is introduced in the system frequency, the more it increases from the nominal value and vice versa which may results in the violation of the acceptable limits of ±2%, i.e., 49.8 Hz to 50.5. The parameters that appear to have influence on system voltage stability tallies with the HµG frequency case where the load and WTG have the notable system influence. The load regulation approach may be adopted to minimize frequency and voltage deviation within the HµG since its configuration includes BESS which is another method of minimizing frequency deviation.
5. Conclusions
This study presented different configurations of HµG with RES like solar and wind. The scenarios were presented such as to reflect the impact of the integration of distributed resources on HµG. The distributed resources were individually modeled before the modeling of the scenarios which were created for grid-connected and standalone cases was carried out. The HµG scenarios were analyzed using parameters like HµG voltage, HµG frequency, wind power, PV power, battery power, DG power, and battery SOC. The result of the analysis has demonstrated that the HµG parameters vary with variation in the configuration of the HµG. The results presented in this study further revealed that frequency deviation corroborates the fact that wind power owing to its stochastic nature causes a wide range of frequency variation in the HµG. As seen in the results, that in both cases, the scenarios where WTG is present in the HµG possess large fluctuations away from nominal value of frequency.
The sensitivity analysis results of the HµG obtained from the variation of the system distributed resources which are factors that affect the output of the system. It has been demonstrated in this study that load has significant effect on the overall system frequency stability. The behavior of HµG has been thoroughly accessed in this study; consequently, this work serves as benchmark for network planners and operators for effective grid integration of renewable energy. This study opens the need for HµG frequency stabilization under varying load conditions. Consequently, attention would be given to this frequency stabilization in further studies.
Conflicts of Interest
The authors declare no conflicts of interest.
Funding
This work was supported in part by the South African National Research Foundation under Grants nos. 141951, CHN231229201835, 137951, AJCR230704126719.
Acknowledgments
This work was supported in part by the South African National Research Foundation under Grants nos. 141951, CHN231229201835, 137951, AJCR230704126719.
Open Research
Data Availability Statement
The data that support the findings of this study are available from the corresponding author upon reasonable request.


