Combustion and Emission Characteristics of NH3/H2/Air Premixed Gas Under Wall Effects
Abstract
Zero-carbon fuels have garnered significant attention in the context of carbon neutrality and peak carbon emissions. A numerical model utilizing computational fluid dynamics (CFDs) software integrated with detailed chemical reaction mechanisms is established to investigate the premixed combustion process of ammonia/hydrogen/air under wall effects and it is validated by comparing experimental results. As the equivalence ratio increases from 0.6 to 1.2, the peak temperature at the wall stagnation point rises. At the same time, the combustion reaction intensifies, and the higher temperature leads to an increase in the concentration of OH radicals near the wall. As the hydrogen blending ratio increases from 0.5 to 0.8, the overall peak temperature increases. The increase in the hydrogen blending ratio in the fuel enhances the intensity of combustion, resulting in a decrease in the height of the premixed cone, and the rise in temperature weakens the inhibitory effect of wall heat dissipation on nitric oxide (NO) generation, resulting in an increase in NO emissions near the wall.
1. Introduction
Flame–wall interaction [1] (FWI) is a challenging issue in contemporary combustion research and is widely present in combustion chambers of internal combustion engines [2], low NOx gas turbines [3, 4] and rocket engines [5, 6]. Currently, FWI research mainly focuses on hydrocarbon fuels, such as methane (CH4) and ethylene (C2H4). In the study of FWIs, many scholars [7–9] have focused on the measurement and prediction of quenching distance. Poinsot et al. [10] conducted a numerical simulation to compare the front quenching (HOQ) of laminar and turbulent premixed flames. Based on direct numerical simulation (DNS) results, a flame surface density model for turbulent FWIs was proposed and tested in a piston engine calculation. Some scholars have also studied the heat transfer characteristics of different types of flame near the wall. Lataillade et al. [11] studied the interaction between flame and wall in a diffusion burner, and pointed out that the heat transferred from the wall by the diffusion flame is greater than that from the wall by the premixed flame under the condition of chemical equivalent ratio. Wehrfritz et al. [12] studied the interaction between the n-dodecane jet flame and the wall, and the results showed that there was strong diffusion in the high-temperature chemical reaction zone, which led to flame extinction. They also studied heat transfer and found that the wall heat transfer rate was highest for the mixture equivalence ratio between 1.0 and 1.5. Additionally, some scholars have conducted research on the generation characteristics of key components near the wall. Jiang et al. [13] analyzed the influence of wall temperature on the concentration of CO near the wall and found that as the wall temperature decreased, the maximum concentration of CO near the wall would decrease. Mokhov et al. [14] used laser-induced fluorescence technology to obtain the distribution of CO concentration on the extinguishing interface. Rißmann et al. [15] used PIV velocity measurement and OH–LIF flame front synchronization techniques to analyze the entire process of flame wall approach and flame extinction. They conducted qualitative and quantitative analyses of the effects of fuel CH4 and C2H4 on flame structure and flow field at Φ = 1.0. According to the results, the quenching distance of CH4 was 179 μm, while that of C2H4 was 159 μm. Although the velocity fluctuations were small, the flame wrinkling rate of CH4 was higher than that of C2H4 due to velocity fluctuations. Some scholars also studied the coupling between the combustion of carbon-containing fuels and the wall surface, including the flame structure and the generation of carbon soot. Rißmann et al. [15, 16] studied the carbon smoke generation characteristics of C2H4 jet flame after hitting a wall. The study showed that adding a large proportion of DME could reduce the generation of carbon smoke under the interaction between the flame and the wall, lower the degree of graphitization and increase the oxidation activity, which helps to improve energy efficiency and reduce carbon smoke emissions.
The current era of energy conservation and emission reduction has made reduction of carbon emissions a top priority in the combustion field, and many scholars have studied ways to conserve energy and reduce emissions [17, 18].
Ammonia, as a zero-carbon fuel and an efficient carrier of hydrogen energy, has many advantages [19, 20]. First, ammonia production is relatively simple, and coal chemical technology for ammonia production [21] is very mature at present. It can be synthesized by electrolyzing water and compressing nitrogen in air, and the synthesis process can be carbon-free. Second, ammonia has a higher hydrogen energy density, with the liquid form carrying 45% more hydrogen energy than the same volume of liquid hydrogen; finally, ammonia storage and transportation is very convenient, as it can be liquefied at room temperature under 1 MPa pressure, with lower transportation costs. Although ammonia has many advantages, there are also some disadvantages [22] in its use, such as a long ignition delay time, slow combustion speed, and the production of nitrogen oxides, such as nitric oxide (NO) and nitrogen dioxide (NO2) during combustion. To address the low reactivity of ammonia and other issues, current research methods mainly involve adding hydrogen [23–26] or other high-activity fuels [27, 28] as fuel additives. Zhang et al. [29, 30] investigated combustion and emission characteristics of ammonia–hydrogen mixed fuel in an engine and found that when the equivalence ratio was less than one, adding a small amount of hydrogen increased the combustion rate of the mixture, but at the same time it decreased the indicated thermal efficiency and peak thermal efficiency of the engine. Bajrami et al. [31] confirmed the influence of thermal acoustic instability in the ammonia/hydrogen flame on flame stability, and found that the increase in oxygen content in the oxidizer and the initial temperature of the premixed gas would increase the tendency for a boundary layer flashback. Han et al. [32] used the heat flux method to measure the laminar burning velocity of hydrogen/hydrogen/air from lean to rich combustion and different examples. Ichikawa et al. [33] studied the laminar burning velocity of the hydrogen/hydrogen/air premixed flame at different pressures ranging from 0.1 to 0.5 MPa.
Due to its many advantages, ammonia–hydrogen mixed fuel will shine in the field of combustion in the present and the future. Currently, there is less research on the interaction between ammonia/hydrogen/air-premixed flames and surfaces, and many combustion equipment designs cannot be separated from the coupling between flames and surfaces. Therefore, the focus of this paper to explore the interaction between ammonia–hydrogen air premixed flames and surfaces.
2. Materials and Methods
To complete this study, the main method used was simulation calculation using ANSYS Fluent software to obtain data, and experimental verification was conducted to ensure the reliability of the simulation.
2.1. Physical Model
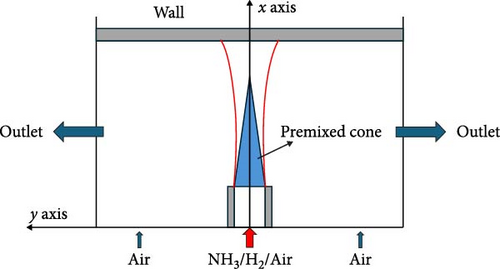
To further investigate the impact of wall surfaces on the flame structure and combustion characteristics of premixed flames, a two-dimensional numerical model was developed for the ammonia/hydrogen/air premixed combustion process incorporating wall effects. The jet flame is directed perpendicularly towards a horizontal wall, with the geometric model exhibiting symmetry about the center axis of the wall. Consequently, a half-model was selected for simulation purposes, as illustrated in Figure 1. Given that the influence of the wall’s end on the flame dynamics is minimal, to optimize computational efficiency, the length of the model in this simulation was set at 60 mm; thus, the half-length measures 30 mm. The thickness was established at 3 mm using stainless steel 304 as material. The inner diameter of the cylindrical tube burner is 6 mm, with a wall thickness of 0.5 mm; the material used for the tube is 304 stainless steel. A premixed gas consisting of ammonia, hydrogen, and air enters the combustion chamber through this cylindrical pipe. To accurately simulate external airflow dynamics, pressure inlets are positioned on both sides of the pipe, while pressure outlets are located at both ends of the model.
2.2. Mechanism Selection and Boundary Condition Setting
In this numerical simulation, the gas-phase reaction mechanism for NH3/H2/air proposed by Okafor et al.Gotama et al. [34] was employed. This mechanism encompasses 32 gaseous species and 165 reversible elementary reactions; specific species and reaction pathways can be found in the reference [34]. Given that the Reynolds number of the fuel jet is significantly less than 2300, a laminar finite rate model was selected for the Fluent simulation. Ammonia/hydrogen/air serves as the premixed gas, with the inlet boundary condition of the jet configured as a velocity inlet. In the simulation, the mass fractions of the mixture components were varied, referred to as the equivalence ratio, which is defined in Equation (1). The inlet temperature of the mixture is maintained at 300 K. The boundary condition for simulating ambient air movement is defined as a pressure inlet, with the inlet temperature also set to 300 K. The outlet boundary condition is specified as a pressure outlet. The temperature of the horizontal metal wall surface is held constant at 300 K. The density of the mixed gas is determined using the ideal gas law applicable to incompressible fluids. Thermodynamic properties of the mixture are evaluated at 25°C and 0.1 MPa, computed through a pressure–velocity coupled solution control equation utilizing the SIMPLE algorithm.
2.3. Calculation Parameters
In this equation, (A/F)stoic represents the stoichiometric air-fuel ratio, and (A/F)actual represents the actual air-fuel ratio.
In this equation, v represents the velocity of the mixture gas at the exit of the burner, D is the inner diameter of the burner, ρmix is the density of the mixture gas, μmix is the dynamic viscosity of the mixture gas, Y is the mass fraction, X is the molar fraction, and M is the relative molecular mass.
2.4. Grid-Independence Analysis
To ensure that the grid division has no effect on the solution, grid independence verification is needed before numerical calculation. The equivalent ratio is set to 1.0, the hydrogen content is 0.7, and the Reynolds number is 500 for the grid independence study.
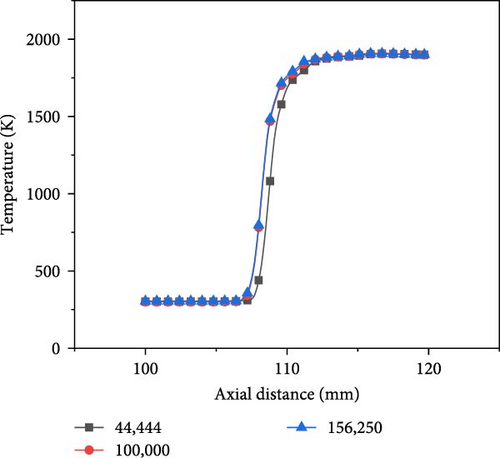
The model is divided into three models with different numbers of grid points using the Mesh software, with grid numbers of 44,444, 100,000, and 156,250. The temperature distribution along the central axis is shown in Figure 2. Among them, the axial temperature curve corresponding to 100,000 grid points is closest to that of 156,250, and the results obtained with 44,444 grid points differ significantly from the others. Considering computational accuracy and efficiency, the model with 100,000 grid points is used for simulation. The structured grid with an edge length of 0.1 mm is adopted, and the number of grids is 100,000. As the overall grid appears relatively dense, a part of the grid is intercepted as a representative, as shown in Figure 3.

2.5. Experimental Verification
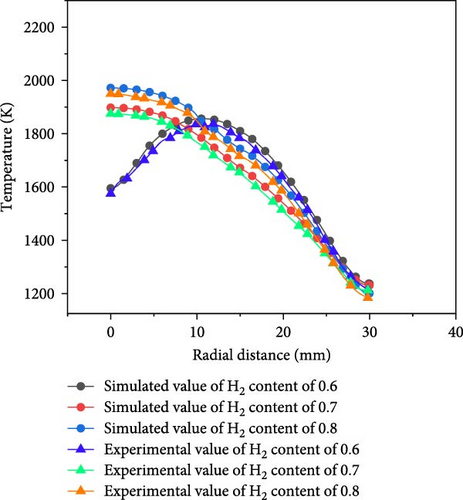
To validate the accuracy of the simulation model, numerical simulation results were compared with experimental data. For ease of measurement, three distinct hydrogen blending ratios were selected for experimental validation, with an equivalence ratio set to 1.0 and a Reynolds number of 500. The gas flow rate through the nozzle is 4.239 × 10⁻⁵ m3/s. In the experiment, the flow of gas was controlled by a mass flowmeter, dry air was generated by an air compressor, and the fuel and air mixture was ignited at the exit of the nozzle. The temperature of the wall’s lower surface was measured using a K-type thermocouple [35–37]. Given the symmetrical nature of the model, only the radial temperature at half of the lower surface was analyzed. As illustrated in Figure 4, the experimental values were slightly lower than those predicted by simulations due to cooling effects from airflow. The maximum discrepancies observed for hydrogen blending ratios of 0.6, 0.7, and 0.8 were found to be 1.88%, 2.04%, and 2.41%, respectively; this indicates that the simulated curves align closely with those measured experimentally. At an infinite distance from the stagnation point, the heat dissipation area expands, resulting in increased heat dissipation and a gradual reduction of temperature to ambient levels—an aspect not accounted for in the simulation. Consequently, this model demonstrates a certain degree of reliability for numerical simulations.
3. Results and Discussion
3.1. Effect of Equivalent Ratio
One of the objectives of this study is to conduct a thorough analysis of the premixed combustion characteristics of ammonia/hydrogen/air by varying the equivalence ratio. The calculated total flow rate is 4.239 × 10⁻⁵ m3/s.
3.1.1. The Effect of Equivalent Ratio on Gas Temperature
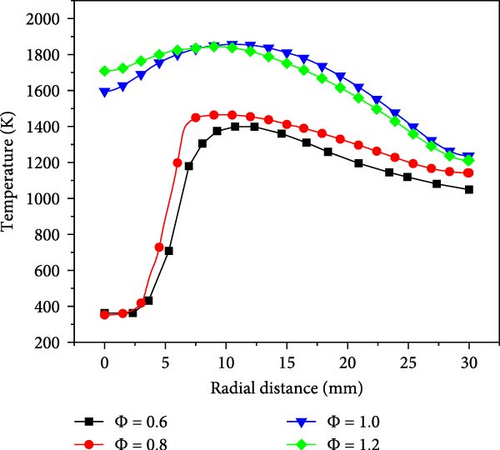
Figure 5 shows the radial distance temperature curves for the premixed combustion of ammonia/hydrogen/air with a hydrogen blending ratio of 0.5 and a Reynolds number of Re = 500, when the equivalence ratio is set to 0.6, 0.8, 1.0, and 1.2, respectively. It is clearly evident from these curves that at an equivalence ratio of 1.2 (rich combustion condition), the temperature at the wall stagnation point reaches the highest value among the four cases. This phenomenon indicates that under rich combustion conditions, due to the higher concentration of fuel participating in the reaction, the combustion reaction per unit volume becomes more intense. A large amount of fuel rapidly reacts with oxygen, resulting in higher local temperatures. In contrast, at equivalence ratios of 0.6 and 0.8 (lean combustion condition), the temperature at the wall stagnation point is significantly lower than the other two cases, and the overall temperature at this location is lower than the corresponding locations for equivalence ratios of 1.0 and 1.2. This is mainly because in the lean combustion condition, the available fuel in the mixed gas is relatively less. When the equivalence ratio is 0.6 and 0.8, the fuel flow rates are 3.857 × 10⁻⁶ m3/s and 5.087 × 10⁻⁶ m3/s, respectively, resulting in an incomplete reaction. Additionally, in cases where the equivalence ratio is 0.6 and 0.8, due to the longer flame premixing cone length, the contact time between the flame and the wall is increased, causing a large amount of unreacted mixed gas to directly contact the wall, further, inhibiting the flame development. Therefore, in this case, most of the unburned mixture expands radially. At the same time, due to the lower total heat value provided by the system in the lean combustion state, the temperature at the center point and its surrounding area is also lowered.
3.1.2. The Effect of Equivalent Ratio on OH-Free Radicals
Figure 6 shows the distribution of OH radical concentration near the wall at different equivalence ratios. From Figure 6, it can be seen that the OH concentration shows an increasing trend first and then decreasing. When the equivalence ratio is 0.6 and 0.8, the premixed flame comes into contact with the wall surface. The premixed cone is compressed by the wall. At this moment, the gas inside the premixed cone that is in contact with the wall is unreacted, so the mass fraction of OH radicals at the stagnation point is zero. As the reaction zone moves towards the wall surfaces on both sides, the mass fraction of OH radicals increases to some extent and then decreases to around 0 at the far end of the wall. When the equivalence ratio is 1.0 and 1.2, the OH mass fraction at the stagnation point is 0.00067 and 0.0013, respectively. In these two cases, the tip of the premixed cone does not come into contact with the wall surface, and the mass fraction of OH radicals generated by the reaction at the tip of the premixed cone increases as the equivalence ratio increases. The presence of the wall causes the reaction zones of fuels with different equivalence ratios to shift. When the equivalence ratio is relatively small, the region with the most intense combustion near the wall will move towards the far end of the wall.
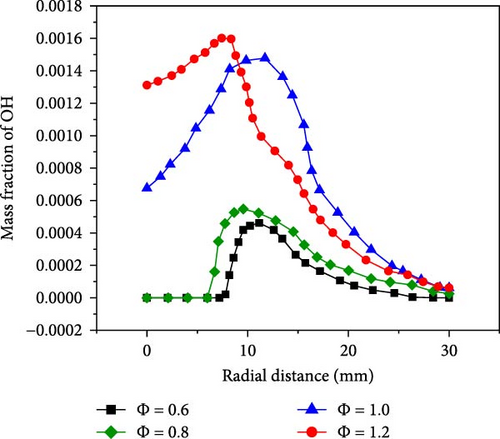
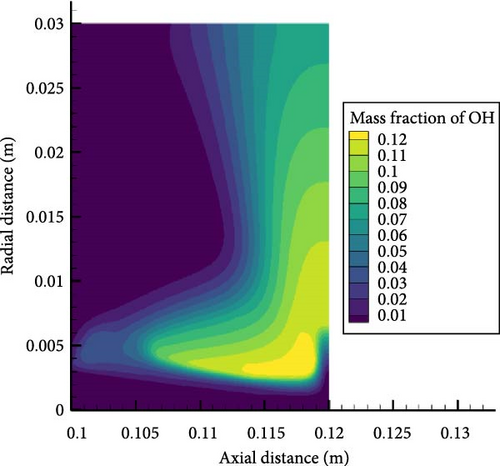
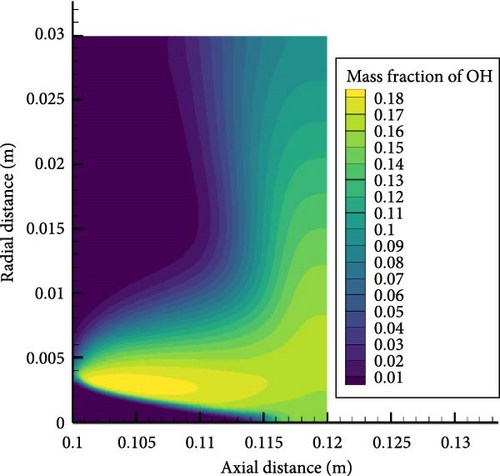
Figure 7 shows the OH concentration contour map for equivalent ratios of 0.6 and 1.2, from which it can be seen that the peak concentration of OH radicals in the case of an equivalent ratio of 0.6 is lower than that in the case of an equivalent ratio of 1.2, where the premixing cone height is lower. The peak area of OH radicals is concentrated at the edge of the premixing cone, and the concentration of OH radicals near the wall surface decreases significantly. This can be analyzed from several main elementary reaction processes. The two elementary reactions that exert the most significant influence on the generation of OH are R22: NH3 + O = NH2 + OH and R28: NH2 + O = NH + OH. It can be seen that as the equivalence ratio increases, the concentration of ammonia and hydrogen increases, so the OH concentration generated by oxidation reaction increases. The peak value of the concentration of OH radicals also corresponds to the radial distance from the temperature peak. Moreover, high temperatures can accelerate the chemical reaction rate. More intense oxidation reactions occur at high-temperature locations, thereby promoting the generation of hydroxide radicals. The increase in equivalence ratio causes the temperature near the wall to rise and weakens the suppression of the flame by the wall. In addition, a higher temperature will generate a larger temperature gradient, leading to enhanced heat dissipation near the wall surface. Although the heat dissipation from the wall surface will have a certain inhibitory effect on the generation of OH radicals, generally speaking, the increase in temperature will cause the concentration of OH radicals near the wall surface to increase.
Meanwhile, the oxidizing ability of OH radicals also affects NOx emissions. The two elementary reactions that have the greatest impact on NOx emissions are R98: HNO + OH = NO + H2O and R132: HONO + OH = NO2 + H2O. It can be seen that the increase in OH concentration in the reaction region leads to an increase in the NOx concentration that is oxidized. The increase in the equivalence ratio leads to an increase in the concentration of fuel that undergoes combustion reactions near the wall surface and the combustion of gas will generate a higher temperature near the wall surface. On the other hand, although the enhanced heat dissipation near the wall surface will inhibit the generation of NOx, the increase in the equivalence ratio makes the temperature near the wall surface higher, and the influence of the heat dissipation from the wall surface will be weakened. Therefore, in the near-wall region, the increase in equivalence ratio leads to the generation of a large number of OH radicals during combustion, resulting in higher levels of NOx emissions.
3.2. Effect of Hydrogen Blending Ratio
3.2.1. The Effect of Hydrogen Blending Ratio on Gas Temperature
Different hydrogen blending ratios were selected for analysis of combustion characteristics. The hydrogen blending ratio selected in this paper is 0.5–0.8. This is because ammonia, as a relatively inert fuel, requires the addition of hydrogen to facilitate combustion. A hydrogen ratio greater than 0.5 can help the fuel burn rapidly, so a hydrogen ratio greater than 0.5 was chosen. Figure 8 shows the axial and radial temperature curves for different hydrogen blending ratios at 700 and an equivalence ratio of 1.0.
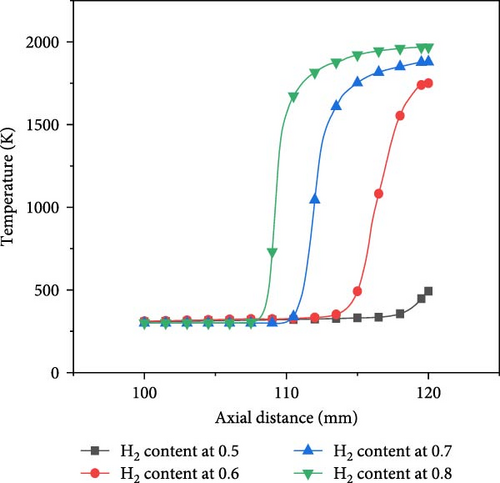
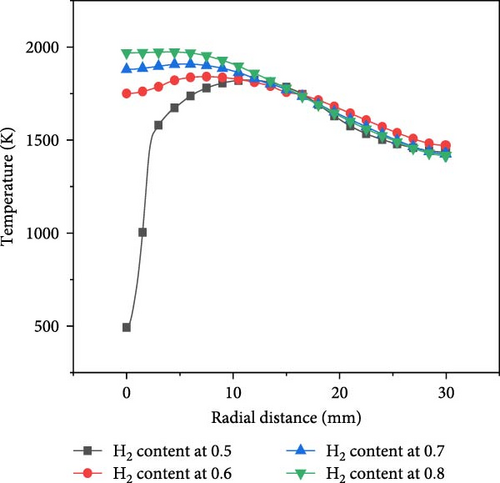
At the same axial distance, the temperature increases with the increase of hydrogen content. On the one hand, the heat value of hydrogen is higher than that of ammonia, so it is easier to produce higher temperatures during combustion. On the other hand, as the proportion of hydrogen in the fuel increases, it becomes easier for the mixture to burn, so the premixed flame cone is shorter. Therefore, since the flame premixing cone with a hydrogen blending ratio of 0.5 is higher, the flame does not fully extend when it comes into contact with the wall at the stagnation point, resulting in a significantly lower temperature at the wall stagnation point compared to the other three cases. In the radial direction, the flame is compressed after interacting with the wall surface. Consequently, the radial temperature profile of the flame with a hydrogen content of 0.5 exhibits an initial sharp increase followed by a decline, attaining its peak value at approximately10 mm in the radial direction. In contrast, for the other three scenarios, the flame fully propagates before making contact with the wall surface, reaching its maximum temperature at the stagnation point on that surface; thereafter, the temperature decreases radially as the distance from this point increases.
3.2.2. The Effect of Hydrogen Blending Ratio on NO Generation
Ammonia/hydrogen/air premixed combustion generates toxic and harmful gases, such as nitrogen oxides, including NO and NO2, and the main component is NO, so the NO gas generated by the ammonia–hydrogen premixed gas combustion under wall surface conditions is analyzed. Figure 9a shows the axial NO mass fraction curve, reflecting the NO gas concentration distribution along the centerline. It is evident that the concentration of NO initially rises, and subsequently, experiences a slight decline as the axial distance increases. This is due to the change in the height of the premixing cone caused by the blending of hydrogen with different proportions. The blending of hydrogen helps to burn the mixture faster, so the greater the proportion of hydrogen blending, the shorter the premixing cone. The interior of the premixing cone is an unreacted mixture, so the NO concentration is 0 at this time. The region with the highest NO generation rate is the tip of the premixed flame cone, where the NO concentration also reaches its maximum axial value. The concentration near the wall is slightly lower, and the presence of the wall has a weak inhibitory effect on NO generation. In the reaction zone, as the proportion of H2 is increased, the NO concentration on the centerline at the same axial distance keeps increasing, thus, the mixing of H2 promotes the formation of NO. The radial NO mass fraction is shown in Figure 9b. When the hydrogen mixing ratio is set to 0.7 and 0.8, due to the smaller length of the premixed cone at this time, when the flame hits the wall, the largest NO concentration will appear near the stagnation point, and as the radial distance gradually increases, the concentration will decrease. When the hydrogen mixing ratio is 0.5 and 0.6, due to the closer proximity of the premixed cone to the wall, the wall inhibits the chemical reaction and flow of the gas at the tip, causing the unreacted gas to move towards the sides and undergo the most violent reaction at a radial distance of 12 mm, where the NO concentration reaches its peak, and then decreases as the radial distance increases. In addition, as the hydrogen blending ratio of the fuel gradually increases, the highest temperature generated during combustion is increasingly dominated by hydrogen. The higher flame temperature weakens the effect of heat dissipation from the wall surface and accelerates the chemical reaction rate near the wall.
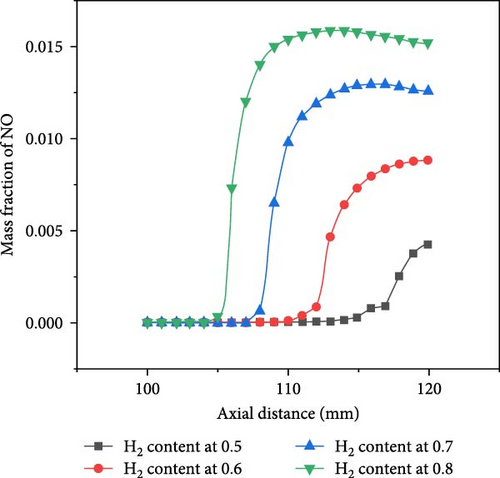
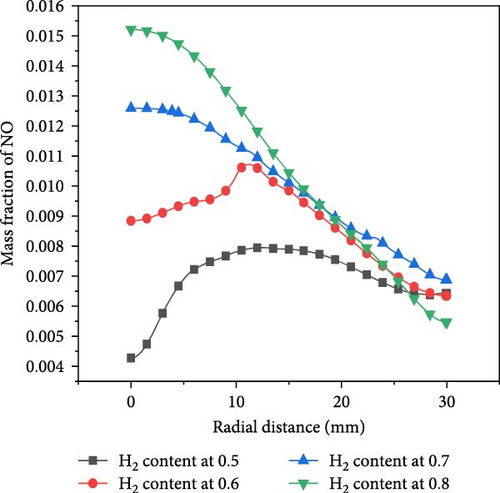
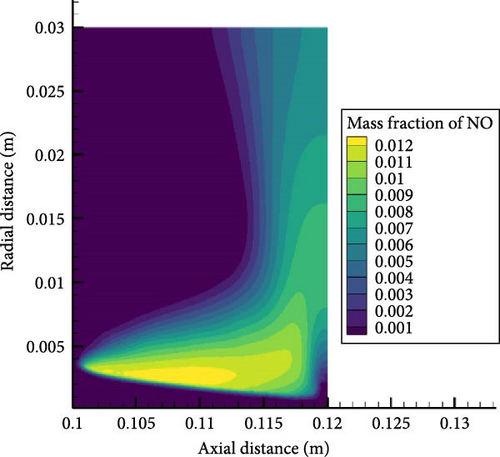
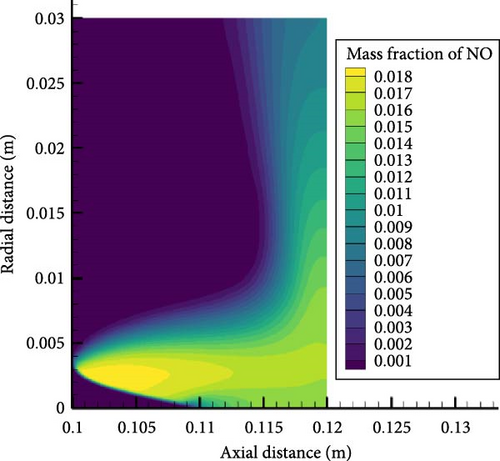
Figure 10 shows NO concentration contour maps for hydrogen enrichment ratios of 0.5 and 0.8. From the figure, it can be seen that the peak NO concentrations for both hydrogen enrichment ratios appear at the edge of the premixed flame cone, with the latter being higher than the former. Upon further observation, it can be seen that as the hydrogen enrichment ratio increases, the NO concentration distribution becomes more uniform, and more NO moves closer to the wall. This is because the greater proportion of hydrogen enhances the combustion of the mixture, causing the tip of the premixed flame cone to move away from the wall, weakening the interaction between the flame and the wall, while also producing higher temperatures that promote NO reaction near the wall. In addition, the greater proportion of hydrogen enhancement will produce higher concentrations of OH radicals, as shown in the previous section’s analysis of elementary reactions. This will also lead to higher NO concentrations.
4. Conclusions
- 1.
Compared with traditional hydrocarbon fuels, such as CH4, the combustion of ammonia–hydrogen fuels does not produce CO and CO2, nor does it generate soot particles on the wall surface. However, it will produce more NOx. When the proportion of hydrogen is relatively high, the temperature gradient near the wall is larger and the heat dissipation from the wall is stronger, which will have a certain inhibitory effect on the reaction. Nevertheless, on the whole, the higher temperature will promote the combustion reaction near the wall.
- 2.
In lean combustion, the premixing cone is longer, leading to unburned mixture coming into contact with the wall surface, thus causing stronger suppression of the flame. As the equivalence ratio increases, the OH concentration near the wall surface increases, accelerating the oxidation reaction of ammonia. In rich combustion, the peak NO concentration is greater than that in lean combustion. A higher equivalent ratio will result in the production of more NOx.
- 3.
The addition of hydrogen helps the mixture burn faster, and the higher the proportion of hydrogen mixed, the lower the height of the premix cone. The addition of a large proportion of hydrogen will increase the peak temperature, weaken the wall flame inhibition, accelerate the chemical reaction rate, and promote the formation of NO near the wall.
Conflicts of Interest
The authors declare no conflicts of interest.
Author Contributions
Yuanming Song: methodology, validation, formal analysis, investigation, data curation, writing – original draft, writing – review and editing, visualization. Jianfeng Pan: conceptualization, resources, writing – review and editing, supervision, project administration, funding acquisition. Feiyang Li: software, investigation, supervision. Muhammad Nauman: writing – review and editing. Baowei Fan: supervision. Wenming Yang: supervision. All the authors have made substantial, direct, and intellectual contributions to the work and approved it for publication.
Funding
The study was supported by the National Natural Science Foundation of China (Grant 51976082 and 52276117).
Acknowledgments
We would like to sincerely acknowledge the School of Energy and Power Engineering, Jiangsu University, for providing experimental equipment and technical support, and DeepSeek for their professional language translation services that ensured the accuracy of the manuscript.
Open Research
Data Availability Statement
The data that support the findings of this study are available from the corresponding author upon reasonable request.


