Real-Time State of Charge Estimation for Tri-Electrode Rechargeable Zinc–Air Flow Batteries via Pulse Response
Abstract
Accurate estimation of the state of charge (SOC) is essential for the optimal operation of batteries. However, to achieve such accuracy remains challenging for tri-electrode rechargeable zinc–air flow batteries (TRZAFBs) due to their flat voltage profiles. This study presents an innovative SOC identification technique based on the optimization of battery model parameters derived from pulse response data. Model parameters are extracted from pulse steps within the experimental data, establishing correlations between these parameters and SOC. Such correlations are then utilized as constraints in the optimization process. Results indicate that the slope of total resistance effectively identifies SOC with acceptable accuracy. The proposed method is further enhanced by integrating it with an extended Kalman filter (EKF) to enable real-time SOC estimation. Various initial SOC guess conditions and optimization frequencies are tested, demonstrating that EKF combined with the proposed optimization technique accurately tracks the true SOC in real-time and effectively corrects the incorrect initial SOC guesses. Additionally, the results show that the proposed technique can compete with other alternative methods in terms of multiple-cycle stability and surpass them in terms of convergence of true SOC for zinc–air batteries (ZABs).
1. Introduction
Nowadays, renewable energy is seen as a critical component in addressing global energy needs. Yet, despite its promise, the intermittent nature of renewable energy sources leads to significant imbalances between power supply and demand. To mitigate these imbalances, energy storage systems (ESSs) viz, batteries have been developed and increasingly applied [1, 2]. Among the various battery types, zinc–air batteries (ZABs) stand out due to their superior energy density and cost-effectiveness, primarily because they use zinc (Zn) and oxygen, which are both abundant and inexpensive [3–5].
Research on ZABs has mainly focused on improving materials and optimizing battery operations. By developing efficient oxygen reduction reaction (ORR) and oxygen evolution reaction (OER) catalysts for air cathodes, significant advancements have been achieved [6, 7]. Furthermore, studies on Zn electrodes and electrolytes have enhanced coulombic efficiency and cycle life [8, 9], while innovations in battery design, such as flow batteries, mechanically rechargeable cells [10], and tri-electrode rechargeable batteries [11], have considerably improved ZAB performance. A recent development in this field is the tri-electrode rechargeable zinc–air flow battery (TRZAFB), which has demonstrated exceptional capacity and cycle life, indicating great potential for practical applications [12]. The TRZAFB employs tin-coated copper foam as a Zn-free anode, achieving an ultrahigh discharge capacity of 800 mAh/cm2 over 5220 h. Moreover, when the battery was scaled up into a TRZAFB pack, it exhibited an energy density of 151.8 Wh/kg at a cost of 46.7 USD/kWh, showcasing promising commercial viability. These advancements suggest that ZABs are nearing commercialization, with substantial progress made over the past decade. It is noted that research on battery management systems (BMSs) for ZABs remains insufficient and requires further development to ensure efficient and reliable operation.
For ensuring safe, efficient, and reliable operation of batteries, BMSs are essential; accurate state of charge (SOC) estimation is particularly crucial [13]. It is acknowledged that SOC cannot be directly measured and must be estimated via measurable parameters, such as cell voltage, current, and temperature [14, 15]. Traditional methods for SOC estimation, namely, coulomb counting (CC) and lookup-table methods, have limitations in accuracy and applicability for real-time or multicycle estimation [16].
Advanced SOC estimation techniques have, thus, evolved, focusing on data-driven and model-based methods. Data-driven methods have recently gained widespread interest because in-depth knowledge of battery mechanisms is not required. These techniques can achieve high accuracy in state estimation by utilizing past battery data. Various data-driven methods have been developed for battery state estimation, including Gaussian process regression [17, 18], artificial neural networks [19], and support vector machines [20, 21]. Recently, Zuo et al. [22] studied SOC estimation of power lithium manganate batteries during the discharging process using data-driven methods such as back propagation neural networks, radial basis function neural networks, least squares support vector machines, and improved functional link neural networks. The results show that the FLNN provides the highest accuracy, with a maximum error of 1.82% and a maximum average error of 0.98%. However, though powerful, data-driven methods require large, high-quality datasets, which may not always be available [23].
Conversely, model-based methods, which integrate battery models with adaptive state estimators, offer a practical solution with lower computational demands [24]. These estimators function as an update algorithm for model parameters, combining estimated and measured data to improve the precision of real-time estimation. Various adaptive estimators, such as state observers or Kalman filter–based estimators, have been studied for SOC estimation over the years. For example, Klee Barillas et al. [14] compared four popular estimators, including the Luenberger observer (LO), sliding-mode observer (SMO), extended Kalman filter (EKF), and sigma-point Kalman filter, for estimating the SOC of Li-ion batteries (LIBs). The four estimators were benchmarked across six aspects: accuracy, dynamic convergence, computational time, RAM, complexity, and stack size. The results show that the SPKF has the highest score in terms of accuracy and dynamic convergence, but it requires very high computational time. On the other hand, the EKF appears to be more balanced in every benchmarking aspect. Yang et al. [25] compared the EKF, unscented Kalman filter (UKF), and particle filter for estimating the SOC of LIBs. They found that the three filters provided satisfactory accuracy, with a root mean square error of less than 4%, while the UKF stood out in terms of robustness and the PF had the fastest convergency.
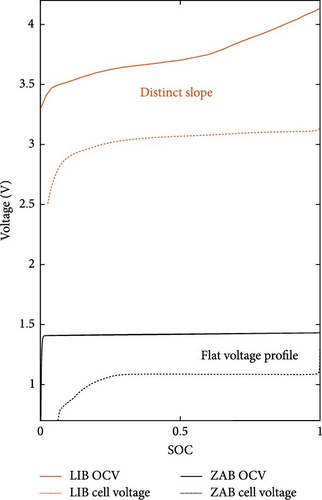
Despite extensive research on SOC estimation for LIBs, such methods cannot be directly applied to ZABs due to fundamental differences in their voltage profiles and charge–discharge mechanisms. In Figure 1a, it is noted that the LIB shows differentiation in both open-circuit voltage (OCV) and cell voltage with distinct slopes [26]. In contrast, the ZAB has a relatively flat OCV and a terminal cell voltage profile. Because cell voltage is one of the few measurable parameters that can be used to estimate SOC, these flat voltage characteristics of ZAB show a unique challenge for SOC estimation. Developing a system of SOC estimation for ZABs can be very challenging. In the past, only a few works have addressed this problem. Recently, Loechte et al. [27] combined electrochemical impedance spectroscopy (EIS) with neural networks. This technique can be used to estimate SOC accurately, but the operation must be stopped when EIS is applied. For indirect measurements, Zelger et al. [28] showed that electrolyte concentration can be used to monitor the SOC of the alkaline Zn–air redox flow batteries. Bhadra et al. [29] investigated the relationship between the coefficient of restitution and SOC of alkaline Zn primary batteries via a bounce test. Such indirect measurements have potential, but they are difficult to implement in real processes. In our previous work, SOC estimation was conducted, using an EKF integrated with a linear parameter varying model [30]. In the case of reaching SOC depletion, the true SOC can be tracked. It is seen that SOC estimation still struggled with the flat-voltage profile of ZAB.
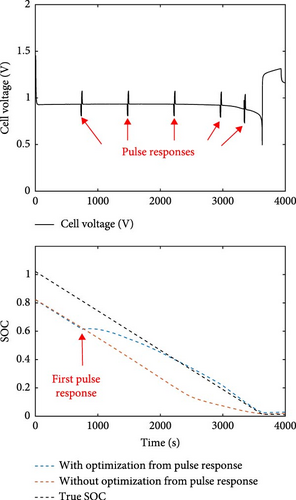
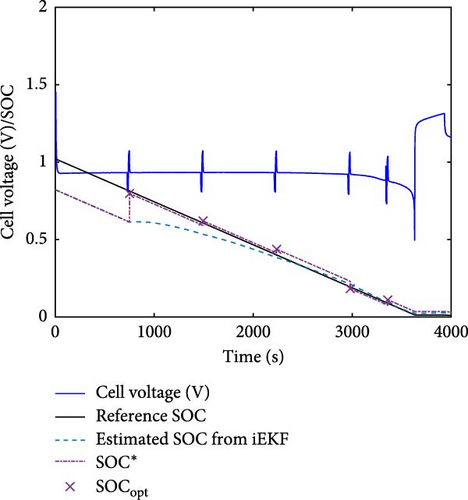
To overcome these challenges, we propose a novel real-time SOC identification technique for ZABs, leveraging optimization of model parameters derived from pulse response data. The optimized values obtained from pulse response can reflect the SOC in the flat region of ZAB and can be used to improve the estimated SOC value, as illustrated in Figure 1b. By identifying parameters from the experimental data under various SOC conditions and constructing correlations between these parameters and SOC, we aim to enhance the accuracy of SOC estimation. This technique is further integrated with EKF to enable real-time SOC tracking and correction of initial SOC estimation errors, demonstrating significant improvements over traditional and advanced methods alike. Our work, therefore, addresses the research gap in SOC estimation for ZABs, offering a robust method capable of real-time application, thus, enhancing the reliability and efficiency of ZAB–based ESSs.
2. Description of TRZAFB
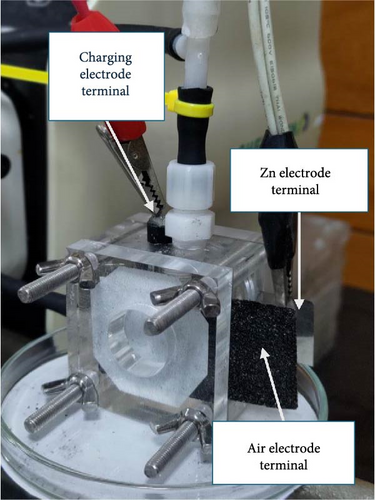
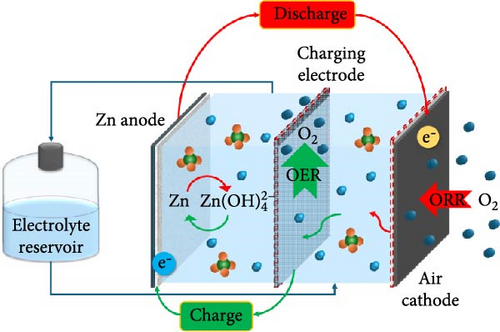
A photographic image of TRZAFB utilized in this study is shown in Figure 2a. As observed in Figure 2b, TRZAFB consists of three electrodes: a Zn electrode (negative), an air electrode (positive for discharging), and a charging electrode (positive for charging). During the charging process, the Zn electrode and charging electrode work in tandem, with Zn being electrodeposited on the Zn electrode; oxygen is generated on the charging electrode. Conversely, during discharging, the Zn electrode and air electrode are paired. Hence, the oxidation of Zn takes place on the Zn electrode and an ORR occurs on the air electrode. The reactions involved in these processes are summarized as follows:
2.1. Charging
2.2. Discharging
The laboratory-made TRZAFB is constructed as a block cell made from polymethyl methacrylate (PMMA). The anode current collector is a stainless steel plate, while the charging current collector is a stainless steel mesh. The air electrode’s current collector is composed of nickel foam coated with an ORR catalyst and a gas diffusion layer (GDL). The active areas of each electrode are 3.14 cm2. The electrolyte used is a 7 M KOH solution with 4% ZnO, circulated between the battery cell and the reservoir by a peristaltic pump at a constant flow rate. Most of the experiments used a flow rate of 33.33 ml/min except the case of the test of flow sensitivity. A hydrophilic polypropylene membrane separates the electrolyte channel and the air electrode. At the air side of the air electrode, a polytetrafluoroethylene membrane is attached to prevent electrolyte leakage. The experiments were conducted at an ambient temperature of 27 ± 1°C. In the case of the test of temperature, the temperature was adjusted via electrolyte temperature by heating or cooling the electrolyte tank with water jacket. The temperature data were recorded by Mastech MS6514 digital thermometer with K-type thermocouple.
To obtain battery data, the experimental data were monitored and collected using battery testing machine (NEWARE CT-4008-5V6A, Neware Technology Ltd., Shenzhen, China) with a sampling interval of 1 s. The battery testing machine directly connects to the positive and negative electrodes of the TRZAFB. The testing profiles of charge/discharge were regulated via the connecting computer with BTS software (Neware Technology Ltd., Shenzhen, China).
3. SOC Estimation Using Pulse Response Information
3.1. Equivalent Circuit Model (ECM) of TRZAFB
3.2. Data Description and Parameter Identification
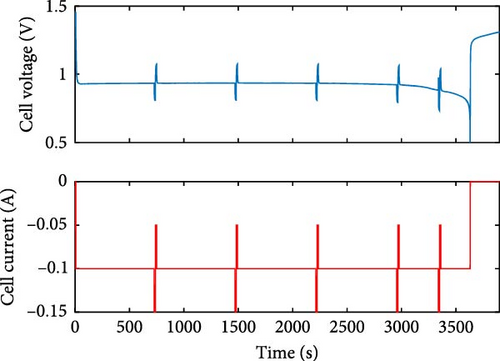
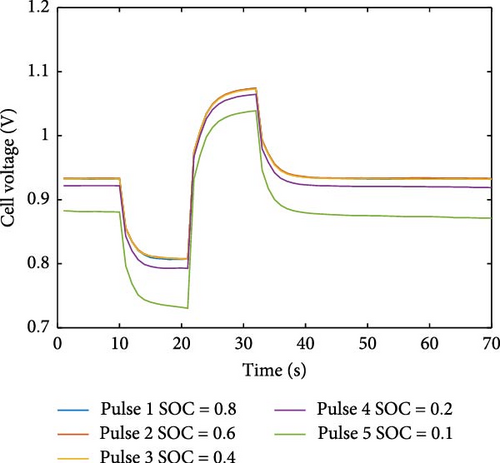
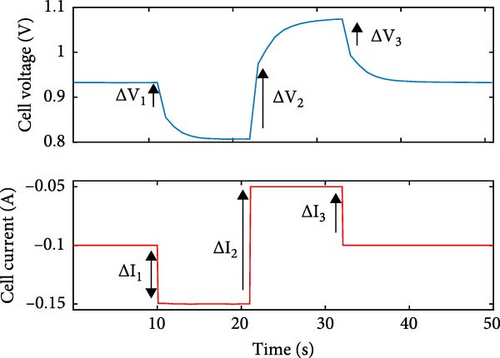
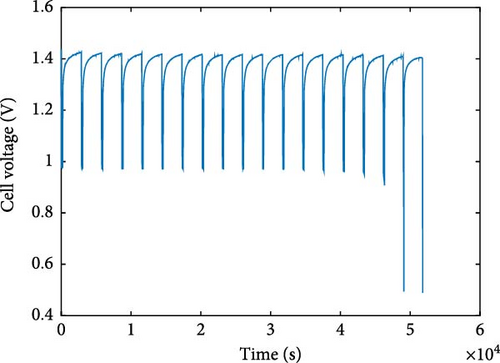
Datasets used in this work can be classified into three types. The first type is the dataset used to identify the model parameters. As shown in Figure 3a, this type of dataset contains discharge with a constant current of 0.1 A and multiple pulse steps. The pulse step consists of higher and lower current pulses, respectively. In Figure 3b,c, parameter identifications are conducted, using these pulse steps. The second type is the charge–discharge cycle dataset used in robustness testing. This type of dataset contains constant current discharge with pulse steps alternating with constant current charge. Another type of dataset is used to identify fVOC. In Figure 3d, this dataset contains constant current discharge for 5% SOC, alternating with rest for 45 min. In Table 1, a list of datasets is tabulated. Additionally, the response signals of the datasets used in this work are illustrated in the Supporting Information (Figures S1–S15).
| Dataset name | Description |
|---|---|
| DC01 | 100 mA discharge with five pulse steps. Used for correlation fitting. |
| DC02 | 100 mA discharge with five pulse steps. Used for correlation fitting. |
| DC03 | 100 mA discharge with five pulse steps. Used for correlation fitting. |
| DC04 | 100 mA discharge with five pulse steps. Used for correlation fitting. |
| DC05 | 100 mA discharge with five pulse steps. Used for correlation fitting. |
| V01 | 100 mA discharge with 17 pulse steps. Used for validation. |
| V02 | 100 mA discharge with 17 pulse steps. Used for validation. |
| V03 | 100 mA discharge with three pulse steps. Used for validation. |
| V04 | 100 mA discharge with five pulse steps. Used for validation. |
| V05 | 10 cycle data: 100 mA discharge with five pulse steps and 100 mA charge. Used for multiple-cycle testing. |
| V06 | Three cycle data: 100 mA discharge with five pulse steps and 100 mA charge. Used for higher temperature testing. |
| V07 | Three cycle data: 100 mA discharge with five pulse steps and 100 mA charge. Used for lower temperature testing. |
| V08 | Three cycle data: 100 mA discharge with five pulse steps and 100 mA charge. Used for higher flow rate testing. |
| V09 | Three cycle data: 100 mA discharge with five pulse steps and 100 mA charge. Used for lower flow rate testing. |
| VOCC | 100 mA discharge for 5% SOC alternating with 45 min rest. Used for fitting of fVOC. |
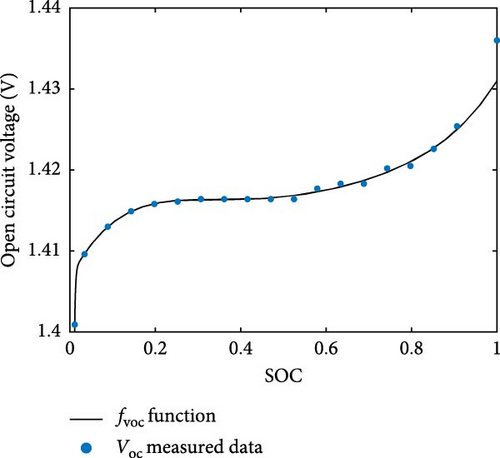
As a fitting result, the fitted parameters of fVOC are obtained and tabulated in Table 2. In Figure 4, the graphical comparison of OCV between fVOC and measured data is shown. The goodness of fitting, according to Figure 4, can be found in the Supporting Information (Table S2).
| Figure | Correlation | Equation | Fitted parameter |
|---|---|---|---|
| Figure 4a | fVOC | Equation (7) | α = −1.6266, β = −489.2597, μ1 = 0.2513, μ2 = −0.7001, μ3 = 0.7848, μ4 = −0.4147, μ5 = 0.1031, μ6 = 1.4066 |
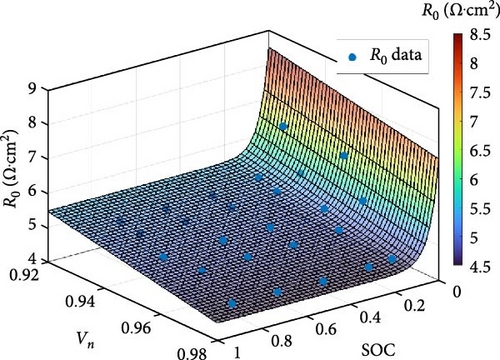
| Figure 4b | R0 | Equation (10) | α = 20.41, β = −0.018, γ = 6.3571, δ = −24.34, θ = −16.21 |
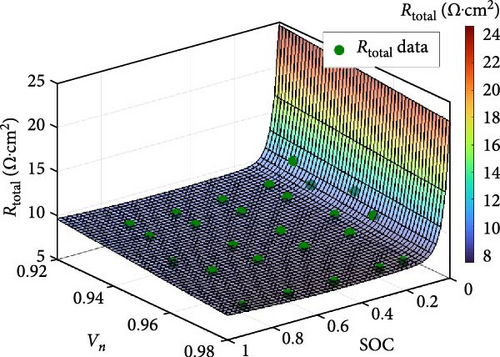
| Figure 4c | Rtotal | Equation (11) | α = 15.16, β = −34.94, γ = 1.593, δ = −1.476, ε = 37.78, θ = −30.72 |
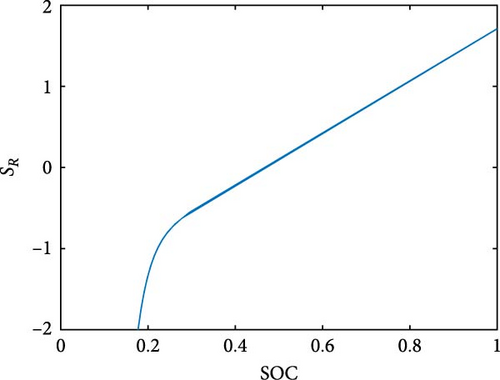
| Figure 4d | SR | Equation (12) | α = 15.16, β = −34.94, γ = 1.593, δ = −1.476 |
The identifiable model parameters: R0, Rc, and Cp were set up as optimization variables. Vp,max is also an optimization variable but it was fixed at −0.2 V for this work. Parameter identifications were conducted, using pulse steps from datasets DC01 to DC05.
In Table S1 (Supporting information), a summary of the optimization problem is shown. Initially, parameter identification was conducted with a known SOC value. Hence, each identified parameter had its own SOC. In Figure S16, the results of parameter identification are plotted against SOC. Thus, it was found that R0 was quite constant at the nondepleted SOC region, while R0 steeply increased at the depleted SOC region. As for Rc, it is seen that a concave appeared in the middle of the nondepleted SOC region. The behavior of Rc at the depleted SOC region is quite akin to R0. To obtain a better observation of the total resistance: Rtotal (R0 + Rc) is observed. The concave that occurred in Rc was also observed in Rtotal. This concave can be used to assist in the estimation of SOC for ZAB. Regarding Cp, it was found to be quite constant at the nondepleted SOC region, the same as R0. However, at the depleted SOC region, Cp is seen to decrease.
In Figure 4b, the R0 correlation fitted via Equation (10) is shown; their parameters are tabulated in Table 2. It is seen that R0 correlation is in good agreement with the data points obtained from parameter identification. Equation (10) shows the exponential relationship between R0 and SOC, while R0 linearly depends on Vn. According to SOC, it can be observed that the surface correlation divides into two regions: a flat inclined plane and a steep slope. This exponential trend also agrees with Figure S16a: R0 steeply increased only at near-zero SOC.
In Figure 4d, the SR function is plotted. It is observed that SR is distinguishable over the range of SOC. Therefore, SR can be used to estimate SOC. Hence, the value of SR is related to the behavior of Rtotal (Figure S16c). The SR value at SOC of 1 started with a positive value and decreased when SOC declined. It is noted that point 0 of SR is seen at the same spot, where the minimum point of the concave appears in Rtotal plot. This concave behavior of ZAB might have transpired owing to the phenomena that occurred at the electrodes.
In this work, the discharge datasets used were obtained from the cycling of a TRZAFB. All discharge datasets have to undergo a pre-charge process. As for the charging of TRZAFB, the cathode was resting during that period because the charging electrode was used instead. Consequently, while alternating between charge, discharge and resting, the concentration of all chemical species at the electrodes, including water content, shifted to a new state affecting the battery response [31, 32]. At a high SOC zone, decreasing resistance is the result of voltage recovery from the sluggish ORR. At a SOC depletion zone, resistance increases due to ZnO passivation and diffusion limitation [33].
3.3. Model Validation
In Figure 5, a comparison of the SOC identification is shown. In Figure 5a,b, validation was confirmed, using datasets that were not involved in the construction of correlations. It is significant that when SR function constraint was used, SOC could be estimated, demonstrating the highest accuracy among the compared cases. As mentioned in the previous section, SR function was able to distinguish SOC. In Figure 5c, the errors of SOC identification, using SR function constraint for both validation scenarios are shown.
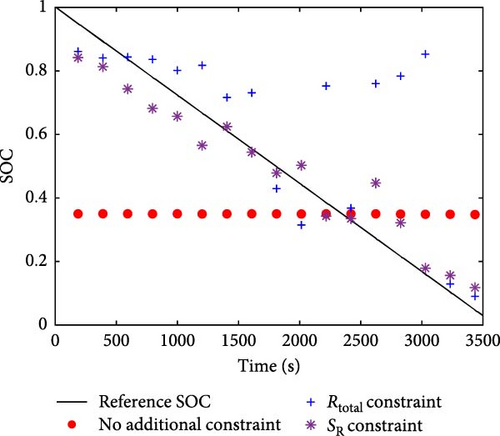
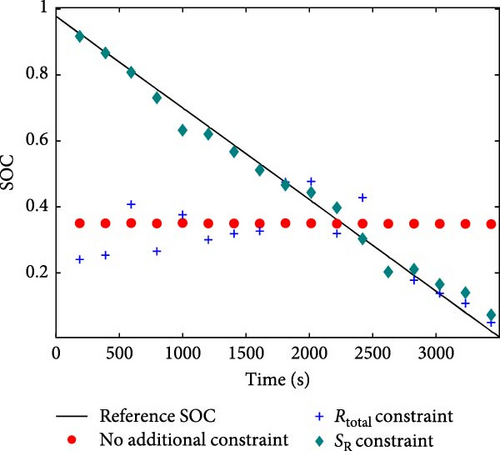
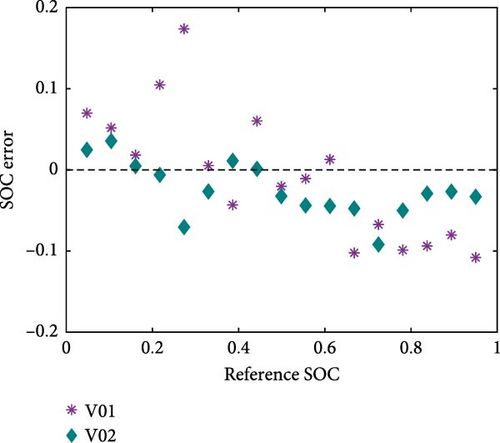
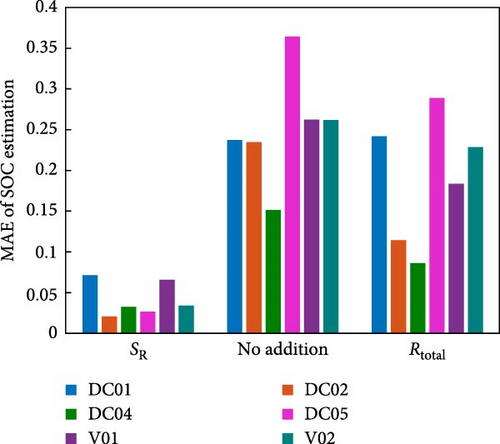
Further, SOC identification, using Rtotal constraint was only found to be accurate at the SOC depletion region due to the steep slope of the correlation. As regards the nondepleted SOC region, identifications were erroneous because the values of resistance were redundant over the inclined concave surface of the correlation. In the worst case scenario for SOC identification, when no additional constraint was used, results proved to be inaccurate and were unable to track the true SOC. In Figure 5d, the comparison of mean absolute error (MAE) of SOC identification for various testing datasets is shown. The numerical values of MAE, according to Figure 5d, can be found in Table S3 in the Supporting information. Thus, it was found that MAE, using SR function constraint, was the smallest for every compared dataset, not exceeding 7%. This result encourages the SR function for use in SOC identification.
4. SOC Identification Integrated With EKF
The procedure of EKF can be explained as follows:
4.1. Prediction
4.2. Correction
Herein, EKF integrated with the optimization technique (improved EKF (iEKF)) is introduced. In Figure 6a, the schema of iEKF is displayed. The variables and battery model are set up as follows:
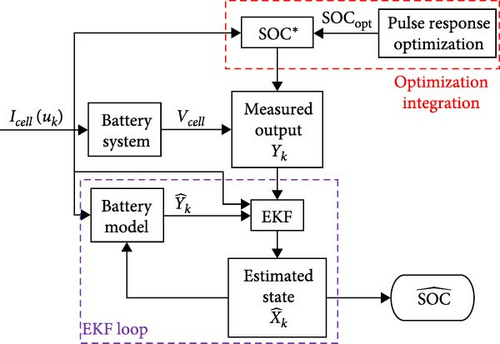
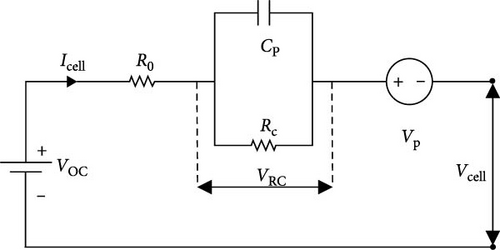
As expressed in Equation (24), the state variables, including SOC, VRC, and VP are estimated by EKF. Icell represents the input of the system. It should be noted that SOC is also included as output variables with Vcell because SOC estimated from optimization is used as measured output. The models expressed in Equations (25) and (26) are replicated from Equations (1)–(6). R0 and Rc are calculated from the correlations optimized in the previous section, as expressed in Table 2.
To investigate the validity of the proposed technique, SOC estimation was carried out comparing the normal EKF (nEKF) with iEKF. Hence, nEKF was conducted in a similar procedure as mentioned above, except that optimization integration was excluded. SOC estimators were tested with an incorrect guess (IG) of the initial value in order to observe the ability to track the true SOC. The three compared datasets possessed a different number of optimization points. Consequently, optimization frequency was investigated. In Figure 7, results of example tests and comparison of MAE are shown. The numerical values of MAE, according to Figure 7, can be found in Table S4 in the Supporting information. In most cases, it was found that the SOC estimated with iEKF started to converge after the first point of optimization occurred. Consequently, iEKF was able to track the true SOC faster than nEKF. However, in some cases, SOC estimated via nEKF was unable to converge to the true SOC. As for such cases where SOC converged, nEKF could only track the true SOC near the depletion of the ZAB since the voltage profile of ZAB in the nondepleted SOC region was exceptionally flat. To determine the SOC of ZAB, using cell voltage only proved to be inadequate. On the other hand, SOCopt obtained via optimization provided useful information for EKF, resulting in faster convergence of true SOC. By comparing different IGs of the initial value, the result showed that iEKF was able to efficiently handle the incorrectness of the initial value even with a high IG of +/−0.5.
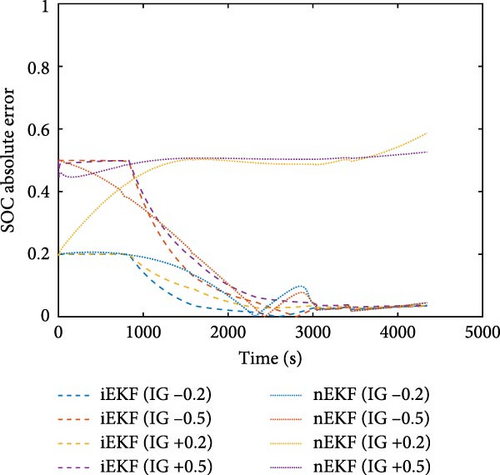
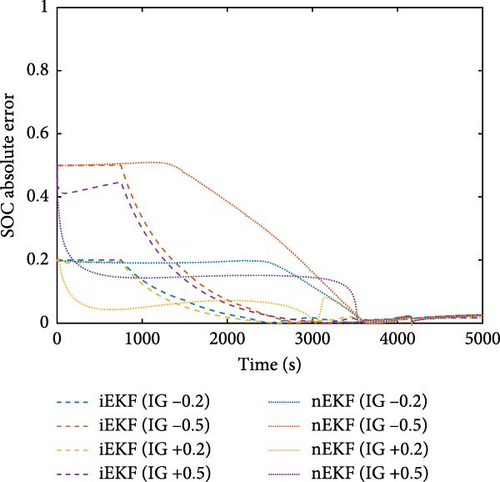
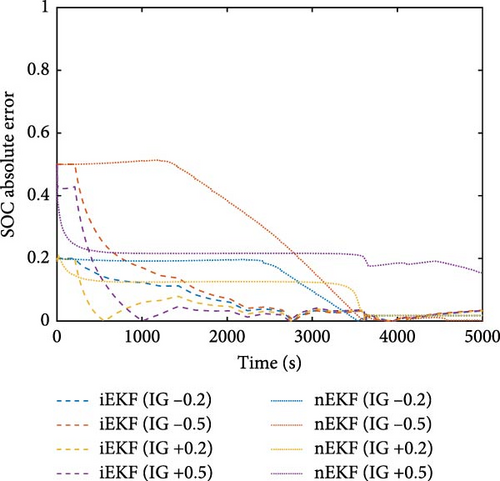
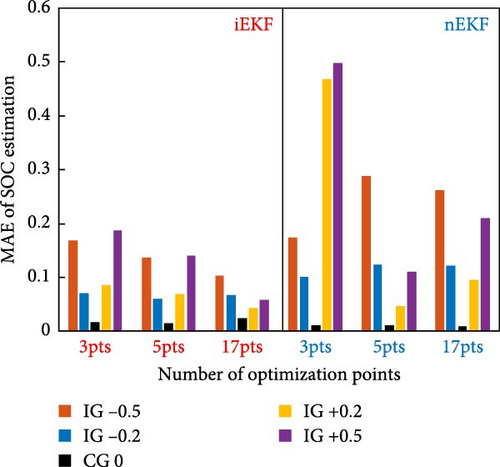
As for the effect of optimization frequency, the three datasets contained the number of optimization points of 3, 5, and 17 points. From MAE of SOC estimation, it was observed that the higher optimization frequency provided better estimation performance as SOC∗ was updated faster and more often. The worst case for 17 optimization points is the IG-0.5 which converged to error below 5% after 36 min, while the worst case for three optimization points is the IG + 0.5, which used 45 min to converge to error below 5%. However, iEKF with a higher optimization frequency received greater influence from the accuracy of optimization than that with a lower frequency. For the correct guess (CG) scenario, the iEKF with 17 optimization points provided the MAE of 2.48% and the maximum error of 4.9% which are the highest among all CG cases using iEKF. It was found that the higher optimization frequency provided higher MAE than the lower one because the erroneousness of SOCopt affected the estimator performance. Compared with nEKF, the result of the CG cases using nEKF showed less error than that using iEKF because nEKF did not have the interference from SOCopt. The worst CG case of using nEKF was the case with three optimization points which provided the MAE of 1.07% and the maximum error of 3.54%. Using nEKF with CG, then, provided more accurate result than iEKF for these CG cases. Nevertheless, these results reveal the promising potential of the proposed technique as it enables the identification of SOC during the operation of ZAB. Additionally, this optimization technique can also be used to improve the performance of EKF for estimating SOC of ZAB.
5. Robustness and Stability of iEKF
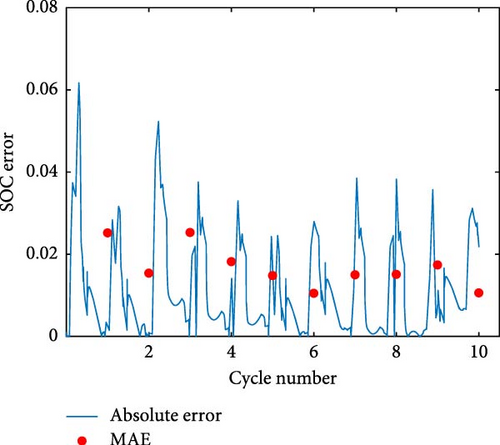
The test of the robustness of the iEKF involved both a multiple-cycle test and an examination of external factors. The numerical values of MAE and maximum error according to the test of robustness are tabulated in the Supporting Information (Tables S5 and S6). The multiple-cycle test was conducted by using the iEKF to estimate the SOC for dataset V05, applying the CG scenario. The result was observed across multiple cycles to assess the robustness of the iEKF. As shown in Figure 8a, the iEKF was able to maintain operation over the 10 tested cycles. The MAE ranged from 1.05% to 2.52% and the maximum error for each cycle varied from 2.45% to 6.1%. This suggests that the iEKF exhibited good robustness through the multiple-cycle process. Over the 10 cycles, the optimization and calculation of the parameters were operating properly. The errors for each cycle did not increase over time, but rather fluctuated due to the optimization process. Thus, the accumulation of error can be managed as the EKF and integrated optimization act as a self-correction mechanism. However, the test did not include sufficient influence of battery aging. The proposed optimization technique applied in the iEKF involves resistance parameters such as R0 and Rc, which can be affected by aging [34]. Therefore, this technique may become more erroneous for long-term operation. To address the effect of aging, periodic recalibration of the iEKF may be required.
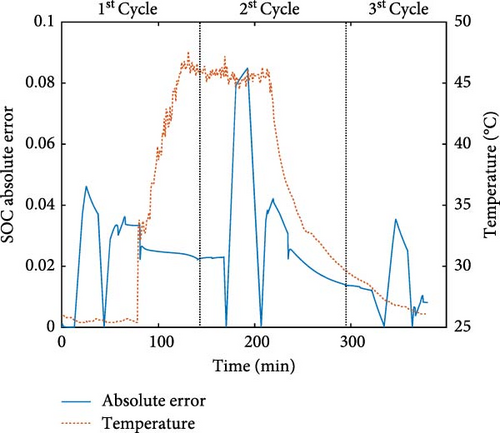
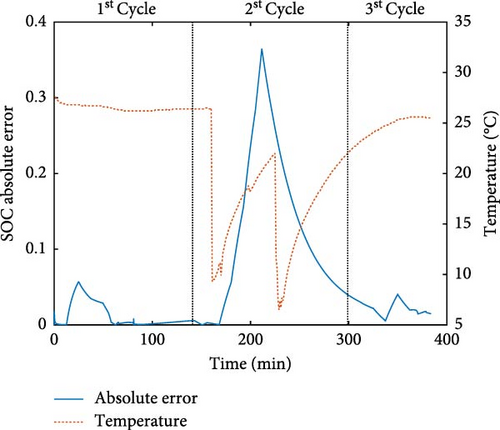

The next robustness test examines the effect of external factors. In this work, two factors were tested: temperature and electrolyte flow rate. The purpose of the temperature test was to observe how changes in temperature impact the performance of the iEKF. The temperature was altered by heating or cooling the electrolyte tank, with two testing scenarios: higher and lower temperatures. Dataset V06 was used for the higher temperature condition, while dataset V07 was used for the lower temperature condition. During the first cycle, no temperature change was applied. Heating or cooling was initiated in the second cycle and ceased after the third cycle began.
As shown in Figure 8b, the error increased as the temperature rose. Once the heating was stopped, the estimation accuracy improved, though with slightly more error than the initial cycle. A similar behavior was observed for the lower temperature case, depicted in Figure 8c. Erroneous estimation occurred when the temperature shifted lower. This can be explained by the high sensitivity of the model parameters involved in the optimization to temperature changes. For TRZAFB, temperature can affect various properties, such as electrolyte conductivity or electrochemical reaction kinetics [35]. These property changes influence the battery parameters and when the temperature shifts to a value not included in the model, the optimization of SOCopt becomes inaccurate, leading to errors in the iEKF.
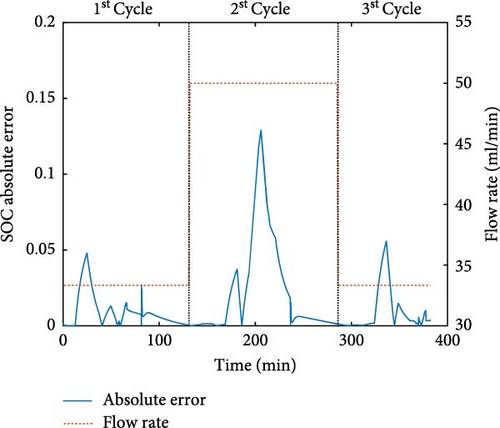
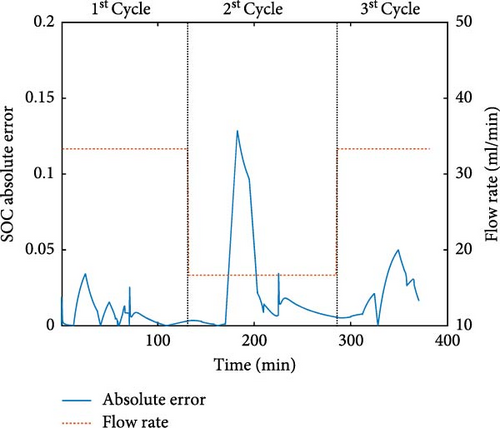
Another factor tested was flow rate of electrolyte. Two scenarios were tested: higher and lower flow using the dataset V08 and V08, respectively. At the initial cycle, a flow rate of 33.33 ml/min was applied. In the second cycle, the flow rate was increased to 50 ml/min for the higher flow rate test and was decreased to 16.67 ml/min for the lower flow rate test. At the third cycle, the flow rate was returned to 33.33 ml/min equal to the initial cycle. In Figure 8d,e, the errors of SOC estimation for the flow rate test are displayed. The result showed that the error of estimation significantly increased when the flow rate was changed. It can be observed that the SOC estimation of the second cycle, which had flow rate change, was more inaccurate than the first and third cycles. It was found that the model parameters involved in the optimization were also affected by flow rate similar to the temperature. Adjusting the electrolyte flow rate influences the mass transfer rate of reactant species and the reaction kinetics [36]. Therefore, the shift in electrolyte flow rate also reflects changes in model parameters, resulting in errors in SOC estimation.
While the changes in temperature and flow rate significantly impact the performance of the iEKF, the system can recover. As shown in Figure 8f, the errors in the third cycle, where the temperature and flow rate return to the initial values, decrease. This indicates that the iEKF is robust within the conditions used to create the battery model and correlations but becomes less reliable outside of those parameters. To expand the operational range, the model and correlations should account for the effects of external factors like temperature and flow rate.
6. Comparison Against Other Methods
While numerous SOC estimation methods have been developed, only a select few have been applied to ZAB systems. To validate the proposed technique against alternative approaches, four widely accepted model-based methods were selected: LO, SMO, EKF, and UKF. Additional details on LO, SMO, and UKF are provided below:
6.1. LO
6.2. SMO
6.3. UKF
UKF utilizes statistical linearization to linearize a nonlinear function. This filter uses the unscented transformation to pick a set of sigma points around the mean. The procedure of UKF can be explained as follows:
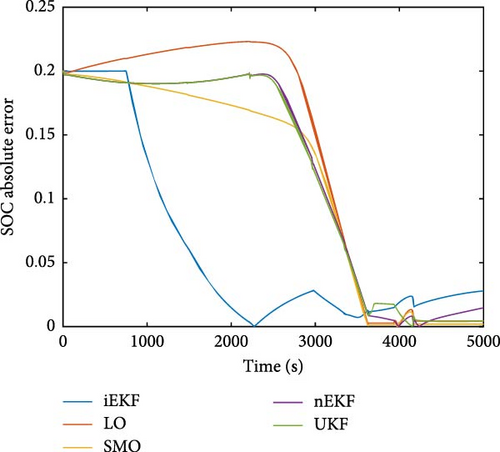
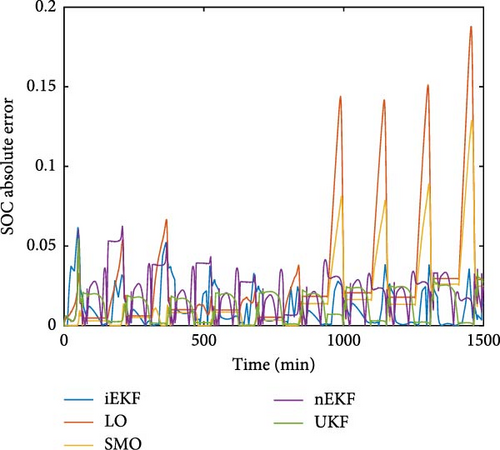
All five methods were used to conduct the SOC estimation under two scenarios. The first scenario examined the convergence of true SOC using dataset V04 with IG−0.2. The second scenario assessed the stability in multiple-cycle operations using dataset V05 with CG. The numerical values of MAE and maximum error according to the comparison against other methods can be found in the Supporting Information (Table S7). As shown in Figure 9, the comparison between iEKF and other alternative methods reveals the following: Regarding the convergence of true SOC, as depicted in Figure 9a, the results indicate that only iEKF was able to converge to the true SOC before the battery was depleted. The other methods relied on the battery depletion behavior to converge the true SOC, and thus, they converged at the same time as the battery depletion. In Figure 9b, it was found that iEKF exhibits acceptable stability compared to the other methods. Error accumulation was observed for LO and SMO, as their errors increased over time. In contrast, nEKF and UKF were able to handle the multiple-cycle test efficiently, with no error accumulation. The maximum error observed for iEKF was 6.1%, which is comparable to nEKF and UKF. It should be noted that at some point, the error of iEKF may be higher than the other KF–based estimators due to the deviation of SOCopt implemented in iEKF. Nevertheless, the comparative results demonstrate that iEKF can compete with other model-based methods, exhibiting superior convergence of true SOC for ZABs.
7. Conclusion
In this study, a novel technique for real-time SOC estimation in TRZAFB was successfully developed by optimizing model parameters derived from pulse response data. Validation results of the optimization technique showed that the correlation of the slope of total resistance provided more accurate SOC identification compared to other correlations. The proposed optimization technique, integrated with EKF, created an integrated SOC estimator that significantly outperformed the standard EKF. Applying the technique demonstrated faster and more accurate SOC tracking with reduced error and effective management of incorrect initial SOC guesses. Comparative studies highlighted its superiority over alternative methods, particularly in handling the flat voltage profile of ZABs. Showcasing the potential of real-time SOC identification, using pulse response optimization, is a promising solution for SOC estimation in ZABs, paving the way for further advancements in battery management technologies.
Nomenclature
Abbreviations
-
- BMS:
-
- Battery management system
-
- CG:
-
- Correct guess
-
- ECM:
-
- Equivalent circuit model
-
- EIS:
-
- Electrochemical impedance spectroscopy
-
- EKF:
-
- Extended Kalman filter
-
- ESS:
-
- Energy storage system
-
- iEKF:
-
- Extended Kalman filter integrated with the optimization technique
-
- IG:
-
- Incorrect guess
-
- LIB:
-
- Li-ion battery
-
- LO:
-
- Luenberger observer
-
- MAE:
-
- mean absolute error
-
- nEKF:
-
- normal extended Kalman filter
-
- OCV:
-
- Open circuit voltage
-
- RC:
-
- Resistor–capacitor
-
- SMO:
-
- Sliding mode observer
-
- SOC:
-
- State of charge
-
- TRZAFB:
-
- Tri-electrode rechargeable zinc–air flow battery
-
- UKF:
-
- Unscented Kalman filter
-
- ZAB:
-
- Zinc–air battery
Symbols
-
- Cp:
-
- ECM parameter: capacitance of RC loop (F/cm2)
-
- Cn:
-
- Nominal capacity (Ah)
-
- fobj:
-
- Objective function
-
- fVOC:
-
- Correlation function between OCV and SOC (V)
-
- Icell:
-
- Cell current density (A/cm2)
-
- k:
-
- Discrete time
-
- R0:
-
- ECM parameter: internal resistance (Ω∙cm2)
-
- Rc:
-
- ECM parameter: resistance of RC loop (Ω∙cm2)
-
- Rtotal:
-
- Total resistance: R0 + Rc (Ω∙cm2)
-
- Rz:
-
- Correlation of resistance (Ω∙cm2)
-
- SOC:
-
- State of charge
-
- SOC∗:
-
- Dummy state of charge
-
- SOCopt:
-
- optimized state of charge
-
- SR:
-
- Slope of total resistance
-
- Vcell:
-
- Cell voltage (V)
-
- Vn:
-
- Nominal voltage (V)
-
- VOC:
-
- Open circuit voltage (V)
-
- Vp:
-
- Constant overpotential (V)
-
- Vp,max:
-
- Maximum value of constant overpotential (V)
-
- VR0:
-
- Ohmic overpotential (V)
-
- VRC:
-
- RC loop overpotential (V)
-
- α, β, γ, δ, ε, θ, μ:
-
- Coefficients of correlations
-
- Δt:
-
- Sampling time (s).
Conflicts of Interest
The authors declare no conflicts of interest.
Author Contributions
Conceptualization, methodology: Woranunt Lao-atiman and Soorathep Kheawhom. Experiments, writing–original draft: Woranunt Lao-atiman. Formal analysis, writing–review and editing: Woranunt Lao-atiman, Pornchai Bumroongsri, Sorin Olaru, and Soorathep Kheawhom. Funding acquisition, supervision: Soorathep Kheawhom.
Funding
The Program Management Unit for Human Resources and Institutional Development, Research, and Innovation (B16F640166) is acknowledged. Woranunt Lao-atiman thanks Chulalongkorn Academic Advancement into its 2nd Century Project for Postdoctoral Fellowship.
Supporting Information
Additional supporting information can be found online in the Supporting Information section.
Open Research
Data Availability Statement
The data that support the findings of this study are available from the corresponding author upon reasonable request.


