Technoeconomic Feasibility of Renewable Energy Systems for Sporting Stadiums
Abstract
The 2024 Africa Cup of Nations (AFCON) in Côte d’Ivoire highlighted the substantial energy demands of major sporting events, traditionally met by conventional, and nonrenewable sources. This study investigates the technoeconomic feasibility and environmental benefits of integrating solar and wind energy systems into the six stadiums used for the 2024 AFCON to enhance sustainability, long-term economic benefits, and reduced carbon emissions. Utilizing the hybrid optimization of multiple electric renewables (HOMER) software for simulation and optimization, and the engineering equation solver for mathematical modeling, this study assesses the energy demand and potential renewable energy contributions for stadiums in Abidjan, Yamoussoukro, Bouaké, Korhogo, and San Pedro. The findings reveal that grid purchases dominate the energy mix across all cities, with varying contributions from solar and wind energy. Abidjan achieves 20.1% renewable energy penetration, while San Pedro reaches 69.9%. The proposed hybrid renewable energy systems offer substantial economic benefits, including payback periods of less than 2 years and high internal rates of return (IRR), with surplus energy generated in some locations potentially sold back to the grid. Additionally, the environmental impact assessment indicates an estimated annual CO2 reduction of 6518.25 metric tonnes cumulatively, equivalent to planting ~2.17 million trees over 20 years. This study provides a detailed technoeconomic analysis, demonstrating the viability of hybrid wind–solar systems in large sports venues and contributing valuable insights for future implementations of renewable energy technologies in the sports infrastructure sector.
1. Introduction
The 2024 Africa Cup of Nations (AFCON) in Côte d’Ivoire highlighted the significant energy demands placed on stadiums hosting major sporting events [1]. Extensive lighting, heating, broadcasting equipment, and other operational needs create substantial energy consumption during tournaments like AFCON 2024 [2]. Traditionally, these demands have been met with conventional, nonrenewable energy sources, raising concerns about environmental impact, and carbon emissions [3].
In the global fight against climate change, there is a growing emphasis on sustainability and adopting renewable energy sources [4]. This is particularly crucial for large-scale events and sports facilities. Cote D’Ivoire, with its abundant sunshine and wind potential, is well-positioned to leverage solar and wind energy for a more sustainable AFCON 2024, aligning with global sustainability goals and reducing reliance on conventional sources of energy [5].
The urgency to integrate wind and solar energy solutions into stadiums hosting major sporting events is undeniable, considering growing environmental concerns and the need to reduce carbon emissions [1]. Previous studies by Pourpakdelfekr and Oboudi [6] have underscored the importance of integrating renewable energy into sporting events to mitigate their environmental impact. Kiani and Nazari [7] emphasized the environmental pressures exerted by larger sporting events, emphasizing the need for sustainable development. Wilby et al. [8] highlighted research gaps, particularly in grassroots sports, certain regions, and specific sports disciplines vis-à-vis energy demand.
Research by Manni et al. [3] proposes strategies to enhance stadium energy efficiency, emphasizing the environmental benefits, while Méndez and Bicer’s [4] study on wind energy potential for stadiums hosting the 2022 World Cup in Qatar highlights its economic and environmental advantages. Additionally, Heynen and Ambeth [9] and Vanaraja’s assessment of sustainability in sports events reveals the importance of significant investment in renewable energy infrastructure.
Recent advancements in renewable energy technologies have further strengthened the case for their integration into sporting stadiums [10]. The efficiency and cost effectiveness of photovoltaic (PV) systems have improved over time making them a practical choice, for generating energy on a large scale [11]. According to a study by Hernández-Moro and Martínez-Duart [12], the declining costs and improved efficiency of solar PV systems have significantly enhanced their feasibility for large installations. According to a study, by Muller et al. [13], it has been proven that incorporating combined wind systems, in establishments can result in significant energy conservation and lower levels of greenhouse gas emissions.
A study by Wanless et al. [10, 12] highlighted that the adoption of renewable energy systems in sports stadiums not only reduces operational costs but also enhances the sustainability profile of the facilities. Similarly, research by Zhang and Yang [14] illustrated that hybrid renewable energy systems could provide a reliable and cost-effective power supply for large sports events, reducing dependency on traditional energy sources. Studies by El Hassani et al. [15] and Huda et al. [16] emphasized the importance of conducting detailed technoeconomic feasibility assessments to ensure the financial viability of these systems.
While significant progress has been made, there is a lack of comprehensive long-term studies evaluating the technoeconomic viability of renewable technologies in sports facilities [17]. The absence of extensive long-term data analysis regarding the performance of renewable energy installations in sports venues poses a challenge for a robust analysis and implementation plan for policymakers [18]. This study builds on these insights by conducting a detailed technoeconomic analysis of the proposed hybrid wind–solar system for AFCON 2024 stadiums, highlighting the potential for significant cost savings, environmental benefits, and a high return on investment.
This study aims to bridge this gap by focusing on a specific case: examining the feasibility of integrating wind and solar energy in the six Ivorian stadiums hosting the 2024 AFCON. The study evaluates the economic benefits of renewable energy systems over an extended period and employs detailed data and software modeling to assess the performance and effectiveness of proposed renewable energy solutions. This study seeks to contribute valuable insights for future implementations of renewable energy technologies in sports facilities.
Across diverse geographic contexts, researchers have predominantly focused on solar PV, wind, and hybrid energy technologies, identifying both technological potential and significant methodological limitations. The synthesized research underscores the necessity for comprehensive longitudinal studies that extend beyond technological feasibility to encompass economic viability, operational sustainability, and broader socioenvironmental impacts of renewable energy implementations in stadium environments. Table 1 presents a comprehensive overview of recent studies on renewable energy and sustainability in stadium design and operations across various geographical contexts.
| Study | System | Geographic scope | Key findings | Research gaps | Reference |
|---|---|---|---|---|---|
| Renewable integration in transmission grids | Solar PV + wind | Africa | Explored technical challenges of renewable grid integration, including intermittency and reliability | Limited analysis on how these challenges specifically affect stadium projects | [19] |
| Hybrid energy system for soccer stadium | Solar PV + piezoelectric technology | Tarkwa, Ghana, Africa | Combined use of solar PV and piezoelectric systems achieved energy savings of 99.94% (players) and 89.75% (spectators) | Lack of long-term operational data and cost-effectiveness analysis for widespread implementation | [20] |
| Politics of world cup stadium construction | Stadium construction for mega events | Cape Town and Durban, South Africa | Demonstrated that stadium construction for the 2010 FIFA World Cup was used as a national prestige project, driven by local-global dynamics involving FIFA, media, and corporations. Highlighted the political and economic influences shaping policy | Limited exploration of the long-term social and economic impacts of the stadiums on local communities | [21] |
| Toward sustainable mega sporting events | Wind and solar energy systems | Qatar | Demonstrated wind and solar energy potential for FIFA 2022 stadiums to reduce carbon emissions | Lacked long-term operational data and analysis on return on investment (ROI) of such systems | [4] |
| Environmental sustainability in FIFA 2022 Stadiums | Sustainable stadium construction and operations | Qatar | Evaluated the sustainability strategies for FIFA 2022 stadiums, highlighting Qatar’s achievements in delivering carbon-neutral stadiums. Identified key policies and the legacy framework supporting long-term environmental goals | Limited real-world evaluation of postevent stadium usage and long-term environmental outcomes | [22] |
| Smart energy management in stadiums | Hybrid renewable systems (solar + grid) | Global (conceptual framework) | Proposed an active energy management system to optimize energy use in stadiums, considering spectator preferences | Limited implementation case studies for large stadiums, especially in developing nations | [23] |
| Sustainable design of Olympic stadiums | Sustainability of stadium design for Olympic Games | Sydney (2000), Athens (2004), Beijing (2008) | Evaluated sustainability through urban, environmental, and social categories. High scores were achieved by stadiums designed for adaptability, flexibility, urban integration, and mixed usage. Reuse of overlays and energy-efficient systems were key contributors | Limited operational data to assess long-term sustainability and efficiency of stadiums postevent | [24] |
| Optimized energy use in Xi’an olympic center | Solar water heating + air heat pump | Xi’an, China | Showed significant energy savings by integrating solar heating with efficient air heat pumps | Requires long-term operational analysis and scalability to larger stadium complexes | [25] |
| Integration of renewable energy resources | Various renewables + grid integration | Global | Reviewed advancements in integrating renewables into power systems and stadium infrastructure | Limited focus on the socioeconomic impacts and consumer behavior in sports facilities | [2] |
| Energy transition in public facilities | Solar, wind, and hybrid systems | G7 countries | Identified factors influencing green energy adoption in public facilities, focusing on infrastructure | Limited application of findings to stadiums and sports-specific facilities | [17] |
| Kaohsiung world stadium | Solar panels | Taiwan | Fully solar-powered stadium demonstrating a net-zero energy design | Case study; lacks generalizable insights for stadiums in less favorable climates or smaller scales | [2] |
| Environmental sustainability in stadium design and construction | Energy consumption, material composition, and emergent technologies | Global | Systematic review identified energy efficiency and material choices as key drivers of environmental sustainability in stadiums. A practical definition and checklist for ESS were proposed | Lack of whole life-cycle analysis and best practices; limited focus on nonenergy sustainability attributes | [18] |
| Challenges and benefits of solar panels in sports stadiums | Solar energy | Global | Identified challenges of solar energy adoption in stadiums, including economic, social, structural, regulatory, and technical issues | Lack of quantitative analysis of solar energy systems’ cost–benefit balance and long-term policy frameworks for sports facilities | [26] |
2. Methods
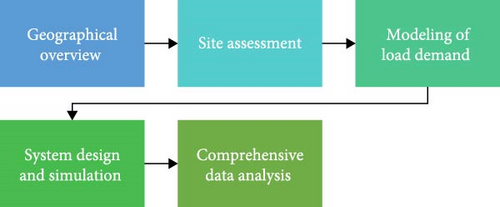
This section outlines the research methods employed to investigate the feasibility of integrating renewable energy sources (solar and wind) into the energy systems of the five Ivorian stadiums that hosted the 2024 AFCON. Figure 1 depicts the sequential process flow of methods employed in this study.
2.1. Geographical Overview
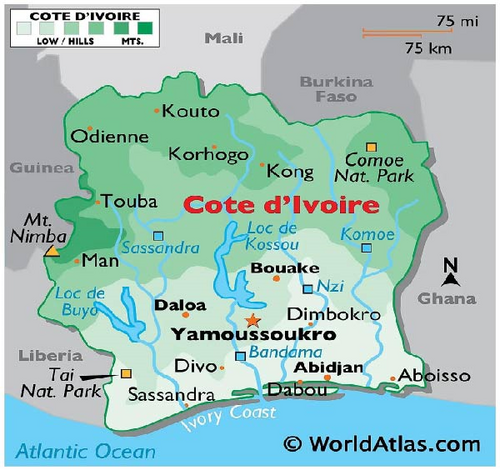
Côte d’Ivoire is situated in West Africa within the intertropical zone, it boasts a land area of 322,462 km2 [27] (Figure 2). To the south lies the vast Atlantic Ocean while it neighbors Ghana to the East and Burkina Faso and Mali to the North; to the West are Guinea and Liberia.
2.2. Site Selection
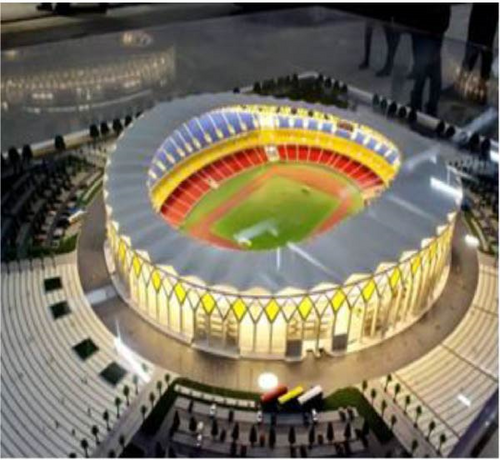
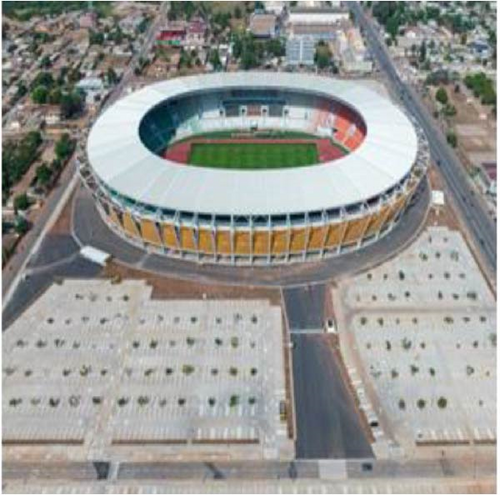
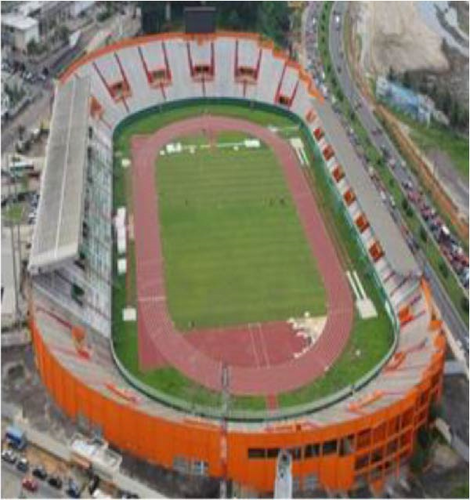
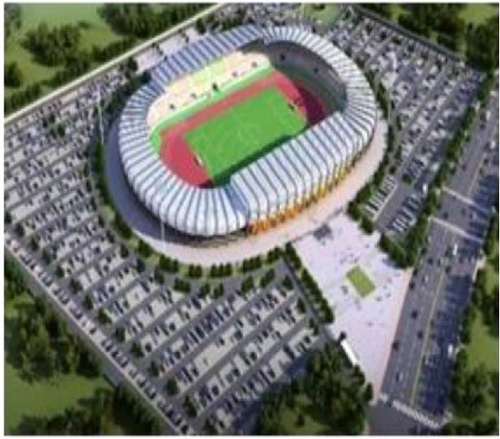
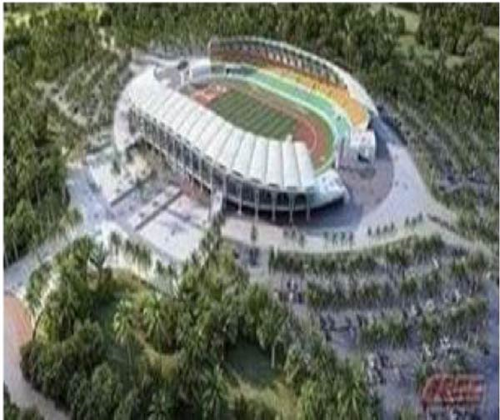
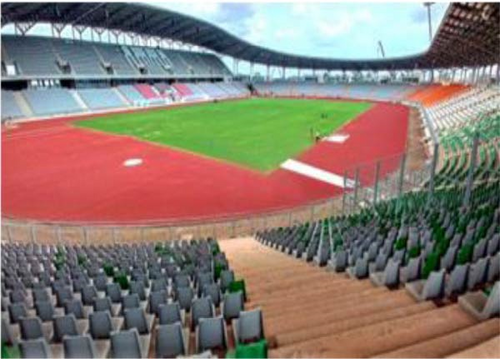
The 2024 total energies AFCON was hosted in Côte d’Ivoire from January 13 to February 11 by the Confederation of African Football (CAF) [28]. This prestigious tournament, marking its 34th edition, was hosted across six International FIFA standard stadiums located in five cities; Abidjan, Yamoussoukro, Bouaké, Korhogo, and San Pedro (Figure 3).
2.3. Assessment of Various Stadium Locations
Abidjan, the economic capital of Côte d’Ivoire, is home to two of the six stadiums for AFCON 2024: Stade Olympique Alassane Ouattara d’Ebimpé and Stade Félix Houphouët-Boigny. The Stade Olympique Alassane Ouattara d’Ebimpé, located in the Ebimpé suburb, is a modern construction completed in 2023 with a seating capacity of 60,000. The historic Stade Félix Houphouët-Boigny, established in 1952 and accommodating 35,000 spectators, is situated in the city center and hosted group matches as well as a quarterfinal.
Yamoussoukro, the national capital, features the Stade Charles Konan Banny. This centrally located stadium, with a capacity of 20,000 seats, is surrounded by significant governmental landmarks. It served as the venue for group matches and a quarterfinal. Bouaké, the second-largest city in Côte d’Ivoire, is where the Stade de la Paix is located. This stadium, with a seating capacity of 25,000, is set amid a bustling urban landscape. It hosted group matches and a round-of-16 encounter.
Korhogo, the third-largest city in the country, boasts the Stade Amadou Gon Coulibaly. Centrally located and equipped to host various group stage matches, this stadium seats 20,000 spectators. San Pedro, a port city in the southwest, features the Stade Laurent Pokou. With a capacity of 20,000 seats, this stadium hosted group stage matches.
2.4. Modeling of Load Data for Stadiums
In assessing the feasibility of renewable energy systems for the AFCON 2024 stadiums in Côte d’Ivoire, accurate energy demand estimations are vital for system design, sizing, and evaluating economic viability [29]. The primary estimation method used in this study relies on a linear extrapolation based on stadium seating capacity, utilizing existing research by Smulders’ survey, and findings by Khalid and Rogstam [30] was employed. Alternative methods, such as area-based, component-based, and event-based modeling, were considered to offer more precision by accounting for variables beyond seating capacity [31, 32]. In this analysis, we detail the current methodology, contrast it with alternative models, and perform comparative calculations to identify the optimal approach for this study.
This study uses energy consumption data from the literature—Khalid and Rogstam’s research on a reference medium-sized stadium with 55,000 seats. Smulders’s [33] survey data are used for comparative validation of this approach, although not explicitly integrated into the estimation process. Approximately 4000 stadiums in Europe that mostly use fossil fuels were investigated by Smulders [33], who calculated that their annual energy consumption may reach 40 TWh. According to Khalid and Rogstams [30] research findings, a contemporary midsized stadium, with 55,000 seats consumes an energy amount of 10,000 MWh (equating to 3600 tCO2 eq, per year).
2.4.1. Linear Extrapolation Method
- 1.
Direct proportionality between seating capacity and energy consumption, neglecting other energy-intensive stadium features [34].
- 2.
Omission of temporal variation.
- 3.
Limited facility differentiation.
2.4.2. Area-Based Method
- 1.
EUI: 300 kilowatt-hour (kWh)/m2/year, averaged for sports facilities in similar climates [36].
- 2.
Floor area is based on approximations for stadium size.
2.4.3. Component-Based Method
2.4.4. Event-Based Modeling
- 1.
Event days: 50 per year, with high-energy activities.
- 2.
Nonevent days: 315, with reduced operational load.
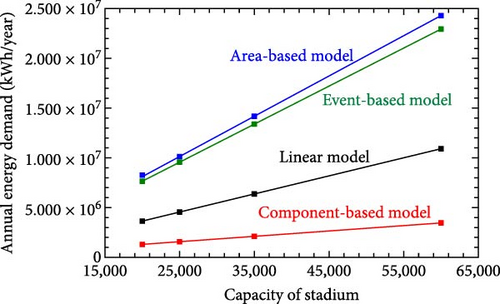
Figure 4 compares the estimated annual energy demand (kWh/year) across four different models (area-based, event-based, linear, and component-based) as a function of stadium capacity. The models illustrate varying energy demands, with the area-based model showing the highest estimates, followed by the event-based model, linear model, and component-based model. The event-based model is chosen for this study as it incorporates the distinction between high-demand event days and lower-demand nonevent days, aligning more closely with the actual operational patterns of stadiums.
2.5. System Design and Simulation
This study used hybrid optimization of multiple electric renewable (HOMER) Pro software to model the hybrid systems, for each of the five stadium locations [37]. Technical and economic feasibility of the proposed system was compared with a grid-tied system and configured the design of least-cost system combination.
2.5.1. System Architecture
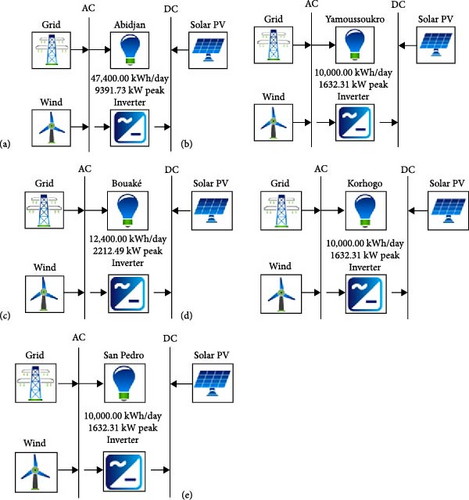
Figure 5 presents the system architecture considered for all five stadium locations.
2.5.2. Load Profile Analysis
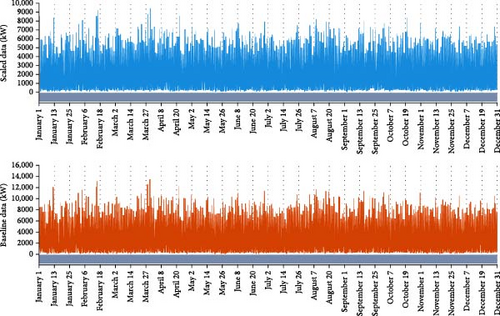
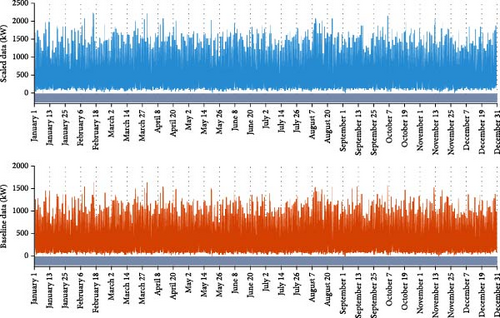
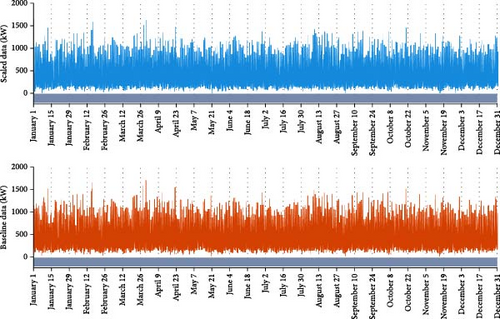
Figure 6–8 provides a comprehensive time series analysis, presenting hourly scaled and baseline load profiles for all five stadium locations (Figure 4).
2.5.3. Solar Global Horizontal Irradiance (GHI)
The GHI is referred to as the energy reaching the Earth’s surface from the sky without any tilt or obstruction. This includes both sunlight and scattered light [37]. Table 2 presents the average monthly solar GHI for the five stadium locations obtained from the National Renewable Energy Laboratory (NREL) solar radiation database and analyzed using HOMER Pro software.
| Month | Average monthly solar global horizontal irradiance (kWh m2/day) | ||||
|---|---|---|---|---|---|
| Abidjan | Yamoussoukro | Bouaké | Korhogo | San Pedro | |
| Coordinates | 5°19.5′N, 4°1.2′W | 6°49.0′N, 5°16.5′W | 7°41.4′N, 5°2.3′W | 9°28.0′N, 5°36.9′W | 4°45.5′N, 6°38.5′W |
| Jan | 4.794 | 5.063 | 5.335 | 5.504 | 4.833 |
| Feb | 5.136 | 5.150 | 5.662 | 6.014 | 4.906 |
| Mar | 5.240 | 5.080 | 5.412 | 5.687 | 5.024 |
| Apr | 5.238 | 5.198 | 5.422 | 5.804 | 5.002 |
| May | 4.933 | 4.727 | 5.095 | 5.362 | 4.377 |
| Jun | 4.395 | 4.183 | 4.538 | 5.056 | 3.874 |
| Jul | 4.443 | 3.980 | 4.214 | 4.488 | 3.965 |
| Aug | 4.315 | 3.685 | 4.334 | 4.526 | 4.022 |
| Sep | 4.685 | 4.345 | 4.626 | 4.867 | 4.326 |
| Oct | 4.811 | 4.309 | 5.064 | 5.327 | 4.553 |
| Nov | 4.729 | 4.375 | 5.169 | 5.533 | 4.692 |
| Dec | 4.541 | 4.788 | 5.231 | 5.485 | 4.625 |
| Average | 4.772 | 4.570 | 5.010 | 5.300 | 4.520 |
From Table 2, it can be observed that Cote d’Ivoire’s solar GHI resource varies across the five stadium locations. Abidjan averages 4.772 kWh/m2/day, while Yamoussoukro, Bouake, and San Pedro averages 4.57, 5.01, and 4.52 kWh/m2/day, respectively. Korhogo stands out with the highest average of 5.30 kWh/m2/day. The relatively uniform distribution of solar resources across the five cities in Côte d’Ivoire provides opportunities for a more balanced and widespread deployment of solar energy systems [5].
2.5.4. Wind Resource
In this study, wind resource data for the five stadium locations was collected from the NASA prediction of worldwide energy resource (POWER) database at an anemometer height of 10 m. The data were then analyzed using HOMER Pro software, which allows for detailed simulation and optimization of energy systems. The anemometer height was adjusted to 70 m, corresponding to the height of the Enercon E-101 E2 (3.5 MW) wind turbine selected for this study.
The analysis included determining the Weibull parameter K and the hours of peak wind speed. The Weibull parameter K, obtained to be 2 in this study, is a dimensionless shape parameter that characterizes the distribution of wind speeds at a given location [38]. A k value of 2 indicates a Rayleigh distribution, which is typical for locations with moderate wind variability. This parameter is crucial for accurately modeling wind speed distributions and subsequently predicting energy production from wind turbines. The hours of peak wind speed were determined to be 15 h. This metric represents the duration during which wind speeds are at their highest, significantly influencing the energy yield from the wind turbines [38].
Table 3 presents the monthly average wind speeds across the 2024 AFCON cities in Cote d’Ivoire. The cities considered are Abidjan, Yamoussoukro, Bouake, Korhogo, and San Pedro. Spanning from January to December, the data provide insights into the average wind speeds observed in these host cities.
| Month | Wind speed at 10 m height (m/s) | ||||
|---|---|---|---|---|---|
| Abidjan | Yamoussoukro | Bouake | Korhogo | San Pedro | |
| Coordinates | 5°19.5′N, 4°1.2′W | 6°49.0′N, 5°16.5′W | 7°41.4′N, 5°2.3′W | 9°28.0′N, 5°36.9′W | 4°45.5′N, 6°38.5′W |
| Jan | 3.44 | 3.36 | 4.04 | 5.24 | 3.72 |
| Feb | 3.96 | 3.67 | 4.08 | 4.86 | 4.10 |
| Mar | 4.18 | 3.92 | 4.18 | 4.38 | 4.04 |
| Apr | 4.14 | 4.03 | 4.38 | 4.64 | 3.96 |
| May | 3.91 | 3.97 | 4.29 | 4.58 | 4.14 |
| Jun | 4.29 | 4.06 | 4.32 | 4.45 | 5.03 |
| Jul | 4.86 | 4.42 | 4.68 | 4.48 | 5.46 |
| Aug | 4.90 | 4.45 | 4.70 | 4.46 | 5.53 |
| Sep | 4.39 | 3.81 | 3.78 | 3.59 | 5.26 |
| Oct | 3.75 | 3.42 | 3.46 | 3.51 | 4.69 |
| Nov | 3.23 | 3.27 | 3.37 | 3.62 | 3.93 |
| Dec | 3.12 | 3.13 | 3.56 | 4.65 | 3.54 |
| Average | 4.01 | 3.79 | 4.07 | 4.37 | 4.45 |
The observed variations in wind speeds across the cities reveal distinct climatic variations within the region. Notably, Abidjan consistently demonstrates relatively higher average wind speeds averaging at 4.014 m/s annually compared to the other host cities, while Yamoussoukro tends to record slightly lower speeds throughout the year. San Pedro exhibits notable fluctuations, particularly peaking in August, indicating potential seasonal wind patterns in this area.
2.6. Mathematical Modeling of PV and Wind Turbine Systems
Mathematical modeling of these systems provides a framework for analyzing their performance, optimizing their operation, and estimating the energy output in response to varying environmental conditions. This section presents the mathematical models used for simulating PV and wind turbine systems in this study, highlighting the key equations and parameters required to predict their performance.
2.6.1. PV System Modeling
2.6.2. Temperature Effect on PV Efficiency
2.6.3. Wind Turbine System Modeling
Wind turbines harness the power of the wind to generate electricity by converting its energy into energy first. The energy output of a wind turbine is primarily determined by wind speed, air density, and the characteristics of the turbine.
- •
Constant environmental conditions: Air density ρ and solar irradiance G are assumed constant for simplicity, but in reality, they fluctuate with altitude, humidity, and other atmospheric conditions.
- •
Fixed efficiency coefficients: PV efficiency ηPV and wind power coefficient Cp are assumed constant for simplicity, although they vary with conditions.
- •
Uniform load profile: Load demands are simplified and not adjusted for specific hourly or seasonal variations in this model [44].
2.7. System Design Considerations and Performance Evaluation Indices
Figure 9 illustrates a schematic representation of the hybrid system components considered for all five stadium locations.

2.7.1. PV System
The Peimar Inc. PV system boasts a nominal capacity of 370 kW, with a capital cost amounting to $236,800 and a levelized cost of electricity (LCOE) of 0.0346 $/kWh was chosen for this study due to its advanced PV technology and high-quality manufacturing standards. The SG370M model incorporates cutting-edge features that enhance efficiency and durability, ensuring that the system will perform optimally under the diverse climatic conditions present in Côte d’Ivoire [43]. Figure 10 depicts the output performance of the Peimar SG370M PV system.

2.7.2. Wind Energy System
The Enercon wind turbine system, rated at 3500 kW, features a capital cost of $350,000, a turbine lifetime of 20 years, and an annual maintenance cost of $90,000. The selection of the Enercon wind turbine system for this study is justified by its gearless drive concept, known for having fewer moving parts, results in reduced maintenance costs and higher reliability compared to geared turbines [45, 46]. The system’s demonstrated reliable performance and ensures consistent energy production [45]. Enercon’s innovative technology enhances efficiency, reduces noise, and increases durability, making the turbines well-suited to the varied environmental conditions in Côte d’Ivoire [47]. The output performance of the wind turbine is depicted in Figure 11.

The output performance of the Enercon wind turbine, as depicted in Figure 11, demonstrates its ability to deliver consistent and robust energy production. This reliability is crucial for meeting the high energy demands of the stadiums, particularly during large events.
2.7.3. Converter
The Leonics GTP-518HET(P) 680 kW converter has a rated capacity of 680 kW, with a maximum output of 341 kW and a capacity factor of 8%. The Leonics GTP-518HET(P) 680 kW converter was chosen for this study due to its high efficiency, reliability, and compatibility with both solar and wind energy systems [48, 49]. Its capacity of 680 kW makes it suitable for handling the substantial energy output from the Peimar PV system. Figure 12 illustrates the output performance of the converter.

2.7.4. Grid
In this study, the hybrid wind–solar system was juxtaposed with an established grid infrastructure system in Cote d’Ivoire as the base case scenario, featuring an electricity price of $0.250 per kWh and a grid sellback price of $0.150 per kWh according to the Ministry of Mines, Petroleum, and Energy (MMPE) in Cote d’Ivoire [50] (Figure 13).

2.8. Economic Feasibility Analysis
Table 4 presents the economic assumptions made for this study including the discount rate set at 8%, based on typical commercial lending rates in Côte d’Ivoire [51]. Electricity prices are detailed with a grid electricity purchase price of $0.250 per kWh and a sell-back price of $0.150 per kWh, with tariffs sourced from the MMPE in Côte d’Ivoire [50]. The system lifetime is estimated at 20 years, matching the expected lifespan of the Enercon wind turbines.
| Parameter | Details | Reference |
|---|---|---|
| Discount rate | 8% (based on typical commercial lending rates in Côte d’Ivoire) | World Bank Group [51] |
| Electricity prices | ||
| Grid electricity purchase price | $0.250 per kWh |
|
| Grid electricity sell-back price | $0.150 per kWh | |
| System lifetime | 20 years (aligned with Enercon wind turbines lifespan) | — |
| Capital costs | ||
| 370 kW peimar solar PV | $236,800 | — |
| 3500 kW wind turbine | $350,000 | — |
| 680 kW leonics converter | $204,000 | — |
| Operating costs | ||
| Annual wind turbine maintenance | $90,000 | — |
2.9. Environmental Impact Assessment (EIA)
3. Results and Discussions
This section provides an analysis of energy production and consumption patterns in five Ivorian cities’ stadiums: Abidjan, Yamoussoukro, Bouaké, Korhogo, and San Pedro. It explores the integration of solar and wind renewable energy sources into existing grid-dependent systems to diminish reliance on grid purchases and achieve cost savings. Findings reveal that grid purchases dominate the energy mix, but the proposed renewable energy integration substantially boosts the share of renewable energy generation across all locations. Renewable energy contribution varies, with Abidjan at 20.1% and San Pedro at 69.9%. Integrating renewables offers notable economic benefits, with payback periods of less than 2 years and high internal rates of return (IRR) for all cities. Moreover, in some instances, the proposed systems generate surplus energy, which can be sold back to the grid.
3.1. Production and Consumption Summary
Stadiums in Abidjan require an average daily energy consumption of 48,158 kWh, with a peak demand of 9392 kW (Figure 6). Figure 14 presents the proposed system which addresses the electrical load requirements of the stadiums through various generation sources. The energy production breakdown in Abidjan reveals that the solar PV component contributes 507,784 kWh/year, accounting for 2.89% of the total production. The wind energy component generates 3,019,254 kWh annually, representing 17.2% of the total. The majority of the energy, however, comes from grid purchases, amounting to 14,063,465 kWh/year, which constitutes 79.9% of the total energy production. Grid purchases dominate the energy supply, supplemented by wind sources, and some minimum contribution from solar energy.
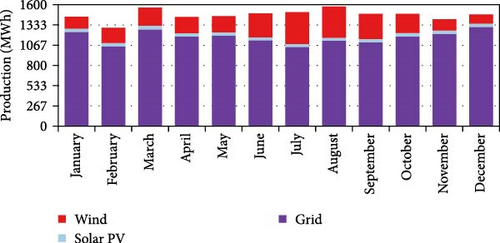
Yamoussoukro necessitates an average daily energy consumption of 11,888 kWh, with a peak demand of 3451 kW (Figure 7). Figure 15 presents the proposed system which utilizes different generation sources to meet the electrical load requirements majorly wind energy and grid purchases while supplemented by solar energy. The energy production breakdown in Yammousoukro indicates that the solar PV component produces 488,499 kWh/year, contributing 11.2% of the total production. The wind energy component generates 1,928,815 kWh annually, accounting for 44.3% of the total. Grid purchases provide 1,932,343 kWh/year, making up 44.4% of the total energy production.
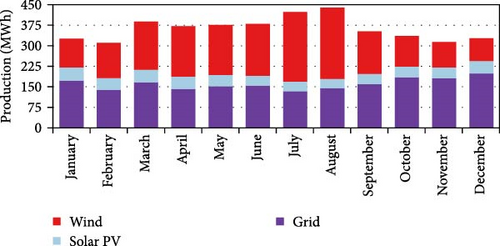
Bouaké requires an average daily energy consumption of 14,769 kWh, with a peak demand of 3624 kW (Figure 8). Figure 16 presents the proposed system which relies primarily on grid purchases and wind energy while supplemented by solar energy to meet the electrical load requirements. The energy production breakdown in Bouake shows that the solar PV component produces 537,227 kWh/year, contributing 9.95% of the total production. The wind energy component generates 2,401,137 kWh annually, accounting for 44.4% of the total. Grid purchases provide 2,463,602 kWh/year, making up 45.6% of the total energy production.
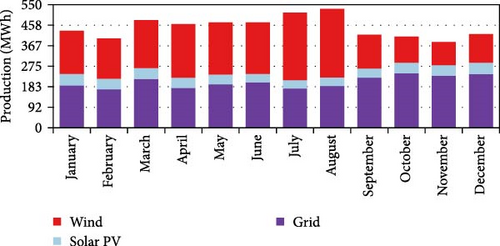
Korhogo requires an average daily energy consumption of 14,029 kWh, with a peak demand of 3686 kW (Figure 7). Figure 17 presents the proposed system which majorly utilizes wind energy followed by some grid purchases and then solar energy to meet the electrical load requirements. The energy production breakdown in Korhogo reveals that the solar PV component produces 571,733 kWh/year, contributing 11.1% of the total production. The wind energy component generates 3,001,478 kWh annually, accounting for 58.5% of the total. Grid purchases provide 1,555,706 kWh/year, making up 30.3% of the total energy production.
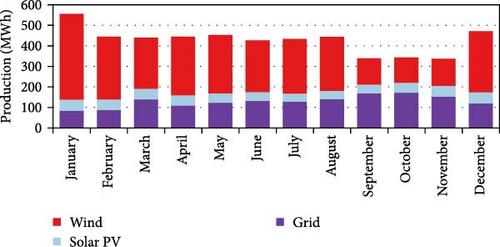
San Pedro necessitates an average daily energy consumption of 14,472 kWh, with a peak demand of 3672 kW (Figure 7). Figure 18 presents the proposed system which relies heavily on wind energy supplemented by grid purchases and solar energy to meet the electrical load requirements. The energy production breakdown in San Pedro shows that the solar PV component produces 480,981 kWh/year, contributing 9.08% of the total production. The wind energy component generates 3,221,369 kWh annually, accounting for 60.8% of the total. Grid purchases provide 1,592,842 kWh/year, making up 30.1% of the total energy production.
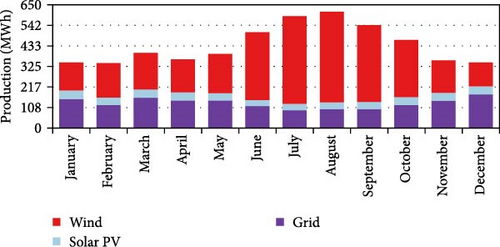
3.2. Instantaneous Renewable Output Percentage of Total Generation
Results obtained indicate that renewable energy can be incorporated into the energy supply, for stadiums in five cities in Ivory Coast to varying degrees. With sources contributing around 20% in Abidjan and up to 70%, in Korhogo and San Pedro. Different factors such as the availability of resources and the design of the system can affect how effective the deployment of energy is in meeting energy needs. Smaller towns such as Korhogo and San Pedro stand out for their reliance on energy sources compared to larger cities that heavily rely on the grid for power supply.
The renewable energy production accounts for 20.1% of the total generation in Abidjan (Figure 19).

The renewable energy production accounts for 55.6% of total generation in Yammousoukro (Figure 20).

The renewable energy production accounts for 54.4% of total generation in Bouake (Figure 21).

The renewable energy production accounts for 69.7% of total generation in Korhogo (Figure 22).

The renewable energy production accounts for 69.9% of total generation in San Pedro (Figure 23)

3.3. Cumulative Cash Flow Over Project Lifetime
This study proposes integrating 370 kW of PV and 3500 kW of wind generation capacity for stadiums in Abidjan. This adjustment would result in a reduction of operating costs to $4.55 million per year. The investment is projected to have a payback period of 1.03 years and an IRR of 97.3%. Figure 24 illustrates the cash flow analysis of the project over its lifetime, comparing the current system with the proposed system scenarios in Abidjan.
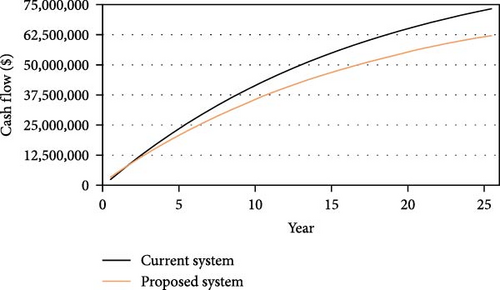
This study proposes integrating 370 kW of PV and 3500 kW of wind generation capacity in Yammousoukro. This adjustment is anticipated to lower operating costs to $680,148 per year. The investment is projected to yield a payback period of 1.80 years and an IRR of 55.3%. Figure 25 presents a comprehensive cash flow analysis of the project over its lifetime, examining both the current system and the proposed system scenarios in Yammousoukro.
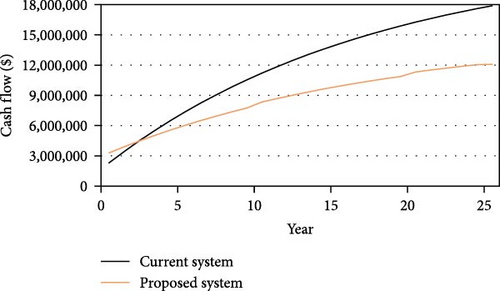
This study proposes integrating 370 kW of PV and 3500 kW of wind generation capacity in Bouake. This adjustment is projected to decrease operating costs to $820,642 per year. The investment is expected to yield a payback period of 1.45 years and an IRR of 69.0%. Figure 26 illustrates the cash flow analysis of the project over its lifetime, examining both the current system and the proposed system scenarios in Bouake.

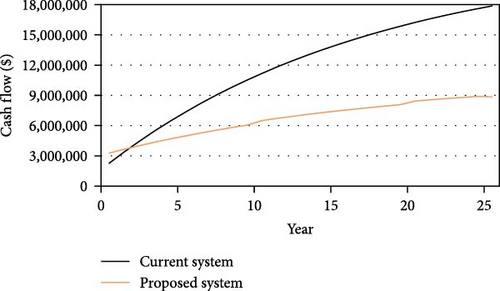
This study proposes integrating 370 kW of PV and 3500 kW of wind generation capacity in Korhogo. This adjustment is anticipated to lower your operating costs to $445,188 per year. The investment is expected to yield a payback period of 1.26 years and an IRR of 79.1%. Figure 27 provides a detailed cash flow analysis of the project over its lifetime, comparing the current system with the proposed system scenarios in Korhogo.
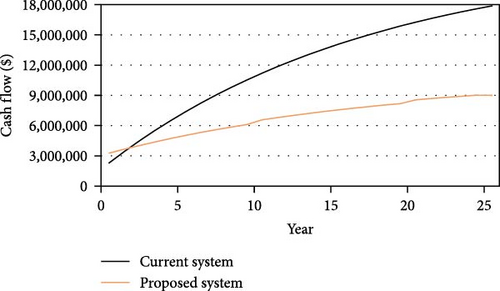
This study proposes integrating 370 kW of PV and 3500 kW of wind generation capacity in San Pedro. This adjustment is expected to decrease operating costs to $431,691 per year. The investment is projected to have a payback period of 1.24 years and an IRR of 80.5%. Figure 28 illustrates a comprehensive cash flow analysis of the project over its lifetime, comparing the current system with the proposed system scenarios in San Pedro.
3.4. Energy Sold to Grid
In the proposed system in Abidjan, the annual energy purchased from the grid amounts to 14,063,465 kWh, while the annual energy sold to the grid totals 281,378 kWh. Figure 29 presents a heat map depicting the energy sold to the grid infrastructure in a year.

The annual energy purchased from the grid in Yammoussoukro amounts to 1,932,343 kWh, while the annual energy sold to the grid is 691,841 kWh. Figure 30 illustrates a heat map representing the energy sold to the grid infrastructure in Yammoussoukro.

The annual energy purchased from the grid in Bouaké amounts to 2,463,602 kWh, while the annual energy sold to the grid is 867,370 kWh. Figure 31 presents a heat map illustrating the energy sold to the grid infrastructure in Bouaké.

The annual energy purchased from the grid in Korhogo totals 1,555,706 kWh, while the annual energy sold to the grid amounts to 1,469,768 kWh. Figure 32 depicts a heat map illustrating the energy sold to the grid infrastructure in Korhogo.

The annual energy purchased from the grid in San Pedro amounts to 1,592,842 kWh, while the annual energy sold to the grid totals 1,637,496 kWh. Figure 33 showcases a heat map visualizing the energy sold to the grid infrastructure in San Pedro.

3.5. EIA
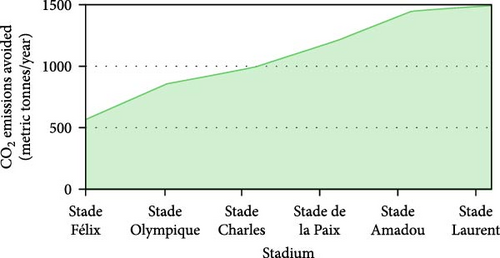
The environmental impact of the proposed hybrid renewable energy system was assessed by calculating the CO2 emissions avoided due to the displacement of grid electricity (Equation 10). Using the CO2 emission factor for Côte d’Ivoire, which is 0.4034 kgCO2e per kWh [52]. This study estimates a total annual CO2 reduction of 6518.25 metric tonnes. The Stade Laurent Pokou leads in impact, contributing 22.93% of the total emissions reduction. On average, each stadium prevents ~1086.38 metric tonnes of CO2 emissions per year, with specific reductions per seat capacity ranging from 74.74 kg CO2e/seat at Stade Laurent Pokou to 14.23 kg CO2e/seat at Stade Olympique Alassane Ouattara (Figure 34). The installations also improve local air quality by reducing particulate matter and other pollutants, contributing to healthier environments around stadium areas [53]. Resource conservation is another key benefit, including reduced water use and fossil fuel dependency, enhancing the sustainability of local resources [53, 54]. Over a projected 20-year lifespan, these systems are expected to avert 130,365 metric tonnes of CO2 emissions, equivalent to planting ~2.17 million trees, aligning with Côte d’Ivoire’s national climate objectives.
4. Conclusion
This study highlights the feasibility and benefits of integrating solar and wind renewable energy systems into the energy supply of stadiums in five Ivorian cities. The results demonstrate a significant reduction in grid dependency, with renewable energy contributions ranging from 20.1% in Abidjan to 69.9% in San Pedro. The proposed hybrid systems provide considerable economic advantages, including rapid payback periods (less than 2 years) and high IRR, with some cities generating surplus energy that can be sold back to the grid. Additionally, the environmental impact of the systems is substantial, with an estimated annual CO2 reduction of 6518.25 metric tonnes, contributing to Côte d’Ivoire’s climate goals and improving local air quality. Over a 20-year lifespan, these systems could prevent over 130,000 metric tonnes of CO2 emissions, aligning with sustainability objectives and fostering a cleaner, more resilient energy future for the nation.
5. Limitations of This Study
This study is subject to a key methodological constraint. Due to the unavailability of real-time energy consumption data for the stadiums, the study relied on an estimated demand approach. This methodological choice introduces potential variability in the analysis, as the estimated approach may deviate from actual energy consumption patterns.
6. Recommendation
Future research can build upon this foundation by exploring the integration of battery storage or green hydrogen technologies for grid stability and self-consumption, optimizing energy use within stadiums through behavioral changes and technology, conducting site-specific wind and solar resource assessments for improved design, and performing life-cycle assessments to understand the environmental impact of these hybrid systems.
Conflicts of Interest
The authors declare no conflicts of interest.
Funding
The authors declare that no financial support was received for the research, authorship, and/or publication of this article.
Acknowledgments
We extend our deepest gratitude to Richmond Kwesi Amoah (PhD) for generously offering guidance and support throughout the development stages of this study. Sincere appreciation to Carlos Miguel Mendez Delgado, for his feedback and suggestions that greatly enhanced the quality of this work.
Open Research
Data Availability Statement
The datasets used and/or analyzed in the current study are available from the corresponding author upon reasonable request.


