Research on Grid–Battery Hybrid Control Strategy of Online DC-Driven System
Abstract
In conjunction with the technical principles of eHighway and electric road system (ERS), the integration of online DC-driven system (ODS) with grid–battery hybrid technology offers a viable solution for sustainable long-distance heavy-duty transportation. In light of the inadequacy in system modeling and control strategy formulation within existing relevant studies, this paper establishes the system power flow model to quantify the energy transfer processes and consumption, encompassing the closed power supply circuit model and grid–battery hybrid power flow model. By analyzing the system model and operating scenarios, it is evident that long-distance transportation leads to significant grid power losses. Moreover, in multivehicle scenarios, sudden load fluctuations can pose risks to grid power supply stability. To enhance the economic efficiency and stability of the system, a globally optimal grid–battery hybrid control strategy (GBHCS) is designed, employing the battery state of charge (SOC) as the state variable and the battery’s charge–discharge power as the control variable. The results of the strategy validation demonstrate that the GBHCS achieves a rational allocation of grid and battery power during different driving phases. In the single-vehicle scenario, the proposed control strategy demonstrates significant efficiency improvements, achieving reductions of over 2% in total grid energy consumption and a remarkable 50% decrease in grid energy losses compared to the conventional whole-process grid direct drive approach under various high-speed cruise cycles. In multivehicle scenarios, the control strategy not only enhances grid energy efficiency and maintains SOC balance across vehicles but also protects the grid from adverse effects caused by pantograph–catenary contact inrush currents.
1. Introduction
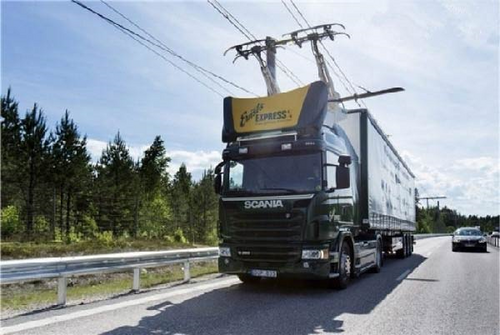
The electrification of road freight is a pivotal response to the global energy and environmental challenges. Siemens’ eHighway system (Figure 1a) represents a feasible solution for electrifying road freight [1, 2]. eHighway system uses dynamic charging infrastructure which combines the efficiency of electrified railroads with the flexibility of trucks into an innovative freight traffic solution that is efficient, economical, and environmentally friendly. Several countries, including Germany, Sweden, and the United States, have implemented test roads to explore the eHighway concept [3–5]. Professor Cebon’s team from Cambridge University has proposed the electric road system (ERS) in the United Kingdom based on eHighway and looked into its construction options and economics [6–9].
In order to evaluate the feasibility of the eHighway and ERS, Colovic et al. [10] from Polytechnic University has developed a multiobjective network design problem model to assess the system’s economic viability. Qiu et al. [11] has evaluated the potential applications of both conductive power transfer and in-motion wireless power transfer technologies on the eHighway. Their findings suggest that eHighway could emerge as economically viable transportation solutions [11]. Zheng et al. [12] at Tsinghua University has conducted comprehensive feasibility analyses and cost assessments. Jöhrens et al.’s [13] findings indicated that implementing an ERS on the five busiest roads in Sweden can lead to a reduction of approximately 20% in CO2 emissions.
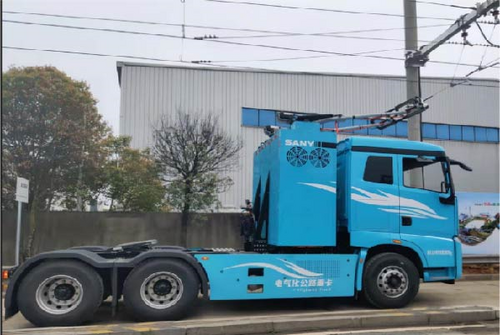
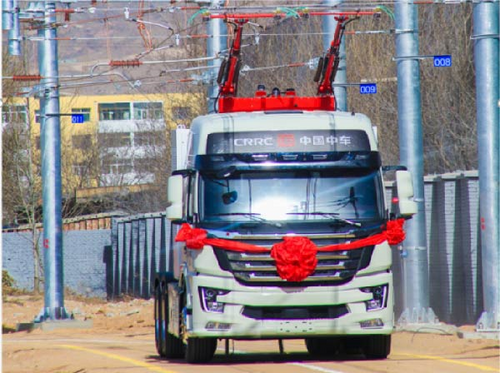
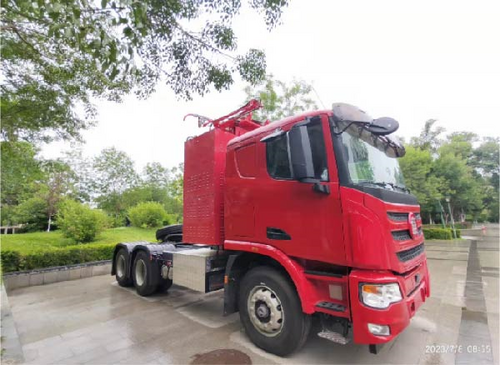
Since 2023, China has accelerated the development of ERS. On March 13, 2023, CRRC Zhuzhou announced the first model road “Tianxing” ERS (Figure 1b) [14]. Then, on March 14, 2023, led by CRRC Datong, the first model road of electric mine transportation system (Figure 1c) in China was built [15]. On July 8, 2023, CRRC Electric Vehicle Co., Ltd., demonstrated its self-developed “Zhidao” ERS (Figure 1d) in Urumqi, Xinjiang. Simultaneously, the “Signing Ceremony for the First Green eHighway System” marked a significant milestone in ERS deployment [16]. The establishment of the test line and the signing of the construction project contract contribute to the feasibility verification of the system scheme and accelerate the pace of its commercial operation.
All the above studies indicate that eHighway and ERS have high practicability, but there has been less research on the system power flow model schemes and energy control strategies. Sachse et al. [17] has conducted intelligent traffic control and optimization experiments on the eHighway, utilizing electrified highway infrastructure for heavy-duty vehicles and advanced traffic control centers with V2X communication to enhance traffic efficiency and safety. Additionally, extensive examination conducted across various traffic loads and proportions of ERS-powered vehicles has revealed the difficulty in consistently meeting reliability criteria. By considering commonly accepted system parameters such as substation DC voltage, substation distance, and feeding arrangement, they have determined that the maximum continuous current limit is the most crucial factor affecting ERS reliability. The foregoing studies demonstrate that the eHighway and ERS systems need more sophisticated theoretical models for the analysis and verification of the operational safety and stability and to establish reasonable control strategies to cope with these potential risks.
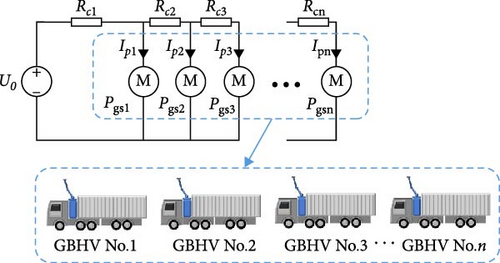
In response to the research on the system theoretical model and control strategy that still requires improvement in the abovementioned studies, this paper puts forward the concept of the online DC-driven system (ODS) and its operation scenarios and establishes the system power flow model. In real-world transportation scenarios, within a single power supply section, multiple vehicles concurrently receive power from the grid while in motion. Consequently, in such multivehicle settings, there is a complex interplay between the platoon’s driving dynamics and the system’s power transfer state. Any alteration in an individual vehicle’s driving state can impact the overall grid power supply condition. Based on the maximum power transfer theorem [18], abrupt changes in vehicle driving states can adversely affect the stability of the grid power supply. By analyzing the system model and integrating the existing research, this paper presents three control objectives: (1) reducing the grid energy loss; (2) avoiding the risk of the grid power supply instability; (3) maintaining the battery state of charge (SOC) balance. For the purpose of attaining the aforementioned control objectives, grid–battery hybrid control strategy (GBHCS) is introduced. This strategy optimizes the distribution of electric power from both the battery and the grid in grid–battery hybrid vehicles (GBHVs), enhancing grid energy efficiency and overall ODS performance.
2. System Power Flow Modeling
2.1. System Concept
As shown in Figure 2, ODS comprises three core components: the DC power supply grid (DCPSG), pantographs, and GBHVs. In contrast to storing the entirety of required electric energy in onboard batteries, GBHVs can draw power directly from the DCPSG in real-time [19]. This transfer of power occurs through contact between a pantograph, situated atop the vehicle, and an overhead catenary system suspended above the road. GBHVs are designed to carry only a small-capacity battery, primarily for short-distance driving once they have departed from the DCPSG. This innovative approach reduces the need for large and heavy batteries, optimizing the weight and energy efficiency of the GBHVs, while enabling them to operate efficiently within the ODS framework.


- a.
Single vehicle in a single cycle section (SVSCS).
- b.
Multiple vehicles in a single cycle section (MVSCS).
- c.
Multiple vehicles in multiple cycle sections (MVMCS).
DCPSG comprises traction substations and an overhead DC catenary. Each traction substation is strategically positioned in the center of its respective single cycle section. Independently, these substations provide DC power distribution, spanning from the center to both sides of the transportation road via the overhead DC catenary, effectively propelling the GBHVs.
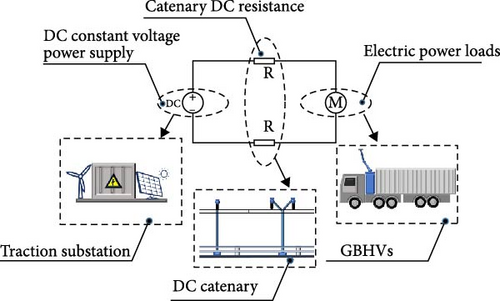
As illustrated in Figure 3, the traction substation serves as a DC constant voltage power supply responsible for maintaining a stable traction voltage and delivering electric power to fulfill grid power requirements. The overhead DC catenary comprises two parallel transmission lines functioning as electrical conductors, enabling real-time transmission of DC power from the traction substation to the GBHVs. Acting as electric power consumers, the GBHVs draw DC power from the traction substation via contact between their pantographs and the catenary.
2.2. Closed Power Supply Circuit Model
2.3. Power Flow Model of GBH System
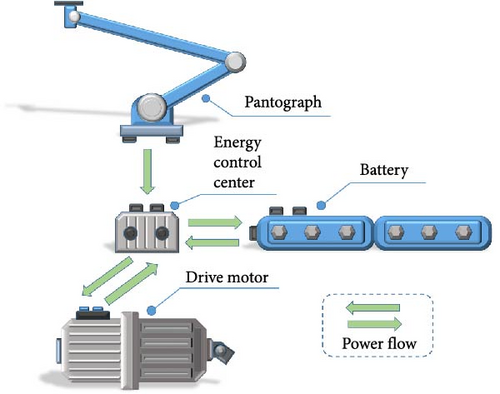
As shown in Figure 5, pantograph, energy control center (DC/DC control converter), battery, and drive motor are the key power devices of GBH system. According to the power flow, there are five working modes of GBH system as described below.
- 1.
Grid direct drive mode
- 2.
Battery direct drive mode
- 3.
Drive–charge mode
- 4.
Joint drive mode
- 5.
Energy recovery mode
3. Control Strategy Building
3.1. Control Objectives
- 1.
SVSCS: A solitary GBHV initiates its travel from the starting point of the section at a constant cruising speed and continues until it reaches the end point of the section.
- 2.
MVSCS: A convoy composed of multiple GBHVs successively enters the section at a constant cruising speed and a constant headway. The process commences when the first vehicle enters the section and concludes when the last vehicle exits the section.
- 1.
Reducing the grid energy loss
- 2.
Avoiding the risk of the grid power supply instability
- 3.
Maintaining the battery SOC balance
To minimize the grid power loss and avert the instability of grid power supply, the power battery needs to participate in power supply and drive the vehicle at an appropriate time to reduce the current in the catenary. Nevertheless, this will lead to a decrease in the power battery SOC. When the vehicles enter the next section, the energy consumption of the power battery in the previous section might influence the implementation of the control strategy within this section. Hence, it is required that when the vehicle reaches the end of the previous section during its travel, the power battery SOC should be replenished to the same level as at the initial moment, that is, to maintain the balance of the power battery SOC.
During the transportation process, through rational control of battery charging and discharging, maintaining the battery SOC within the healthy range is conducive to enhancing the battery lifespan.
3.2. GBHCS of SVSCS
3.3. GBHCS of MVSCS
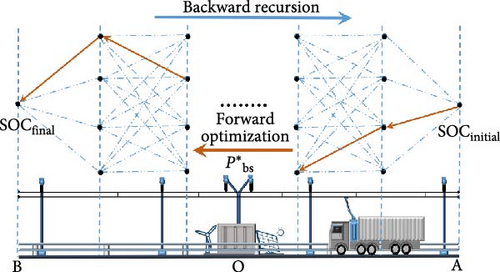
As shown in Figure 7, when the GBHV No. n enters the cycle section, the GBHCS initiates the allocation of optimal battery supply power based on the specific location of the GBHV. The entire transportation process in MVSCS commences with GBHV No.1 entering the cycle section and concludes when GBHV No. n exits the cycle section.

4. Results and Analysis
To validate the feasibility of the designed GBHCS for achieving the aforementioned control objectives, the transportation scenario addressed in this paper is a closed system logistics dedicated highway, where the road type is flat and straight. For the time being, the influences of factors such as weather and temperature on the operational effect of the system are not considered. In this paper, the system power flow model and the controller for GBHCS model are constructed based on the Matlab/Simulink platform.
Vehicle parameters primarily encompass longitudinal dynamics parameters and initial state parameters. These parameters are derived from the actual technical specifications of existing 49-ton pure electric heavy-duty trucks in China. The relevant parameters of the GBHV are shown in Table 1.
| Parameter | Value | Unit |
|---|---|---|
| Total mass of GBHV | 49,000 | kg |
| Frontal area | 8 | m2 |
| Drag coefficient | 0.6 | — |
| Mechanical efficiency | 0.88 | — |
| Rolling resistance coefficient | 0.012 | — |
| Electric power conversion efficiency, ηe | 0.94 | — |
| Battery charge–discharge efficiency, ηb | 0.96 | — |
| Rated capacity of battery, Q | 50 | kWh |
| Initial battery SOC | 0.6 | — |
The selection of the rated traction voltage parameter is based on China’s existing and technologically mature 1500 V DC traction power supply system, which is predominantly employed in China’s metro systems. The selection of the power supply section length is based on a thorough evaluation of the system’s operational and construction costs. During actual deployment, local conditions must also be considered. Furthermore, this paper accounts for the need for a longer section length and simulation time to more effectively present and analyze the verification results of the proposed strategy. Therefore, a single power supply section length of 20 km is chosen in this paper. The relevant parameters of the power flow model are shown in Table 2.
| Parameter | Value | Unit |
|---|---|---|
| DC resistance of single transmission line per km, rc | 0.041 | Ω/km |
| Output voltage of traction substation, U0 | 1500 | V |
| Total length of the single cycle section, LS | 20 | km |
The optimal working range for power batteries is between 0.4 and 0.8 SOC. The charging and discharging power range is determined according to the current specifications of high-rate batteries, which can achieve a maximum charging rate of 8 C, corresponding to a maximum charging power of 400 kW.
As shown in Table 3, the basis for selecting the penalty coefficient λ value of the GBHCS in this paper is as follows: Based on the weight equilibrium of the two penalty terms, under the identical grid power supply Pgs and the charge–discharge power of battery Pbs, the numerical magnitude of the grid energy loss during a state transition process is equivalent to that of the change in the SOC of the power battery. Hence, the penalty coefficient λ value for the variation of SOC is chosen as 1. The relevant parameter settings of the controller are presented in Table 4.
| (a) | ||||
|---|---|---|---|---|
| Cost function term 1 | ||||
| Decomposition | Pgpl(i, j, k) | Tstep | 3600 | Wgel(i, j, k) |
| Units | kW | s | — | kWh |
| Numerical magnitude | 101 | 101 | 103 | 10−1 |
| (b) | ||||
| Cost function term 2 | λ|SOC(i + 1, k) − SOCref| | |||
| Decomposition | SOC(i + 1, k) | SOCref | λ|SOC(i + 1, k) − SOCref| | |
| Numerical magnitude | 10−1 | 10−1 | 10−1 | |
| Parameter | Value | Unit |
|---|---|---|
| Upper limit of battery SOC, SOCmax | 0.8 | — |
| Lower limit of battery SOC, SOCmin | 0.4 | — |
| Maximum battery discharge power, Pdischrg_max | 200 | kW |
| Maximum battery charge power, Pchrg_max | 400 | kW |
| Number of discrete points, n | 100 | — |
| Number of discrete points, m | 100 | — |
| Penalty coefficient, λ | 1 | — |
4.1. Results of SVSCS
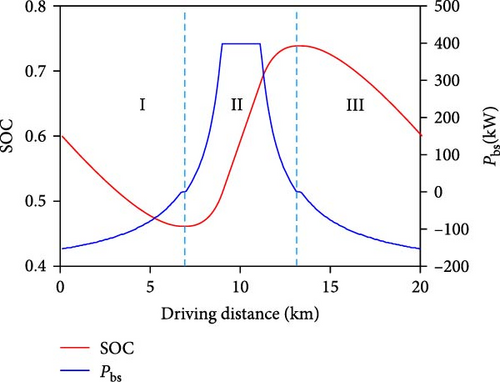
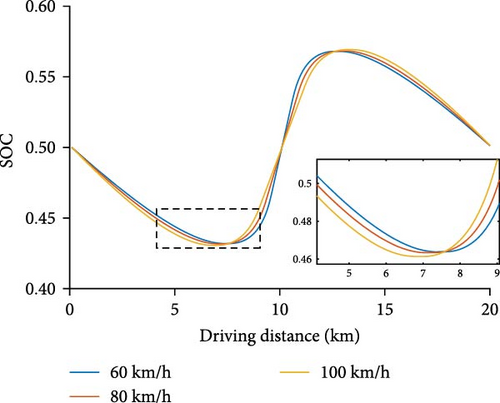
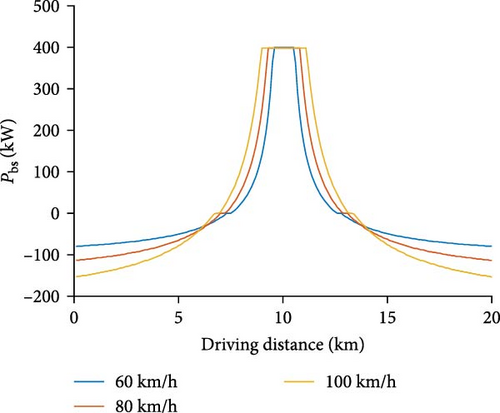
The GBHCS optimization results for GBHV cruise speed ua of 60, 80, and 100 km/h are compared and the whole optimization driving process can be divided into three phases based on the charging and discharging conditions of the battery, which are as shown in Figure 8.
- 1.
Phase I: 0 km–7 km
Upon entering the designated section, the GBH controller receives the drive motor’s demand power signal and the vehicle’s position signal. It then adjusts the output power of the power battery in accordance with the predefined control strategy. The GBHV operates in the joint drive mode during this period. The initially high battery discharge power is due to higher catenary DC resistance, particularly early on, which amplifies the impact of grid supply power on grid power losses. To reduce grid power losses, increasing the battery discharge power ratio in the joint drive mode is crucial. As the vehicle travels an increasing distance, the catenary DC resistance gradually decreases. This reduction in resistance diminishes the impact of resistance on grid power losses. Consequently, the discharge power of the battery continuously decreases and ultimately reaches zero. As can be observed from Figure 9b, under the same vehicle position, an increase in the cruise speed of the vehicle leads to a corresponding rise in the power demand of the drive motor. Consequently, a higher discharge power from the power battery is required to meet the vehicle’s driving power requirements and minimize the grid power loss on the catenary.
- 2.
Phase II: 7 km–13 km
- 3.
Phase III: 13 km–20 km
The GBHV shifts back to the joint drive mode, with the battery contributing power to propel the vehicle. During this phase, the battery SOC steadily decreases until it reaches its initial SOC. As the GBHV approaches the end of the single cycle section, the catenary DC resistance gradually escalates to its maximum value. Consequently, grid power loss becomes increasingly sensitive to grid supply power. To mitigate grid power losses, the battery must engage in joint drive with DCPSG. The battery power charged by the DCPSG during phase II is harnessed to meet the discharge requirements in this phase.
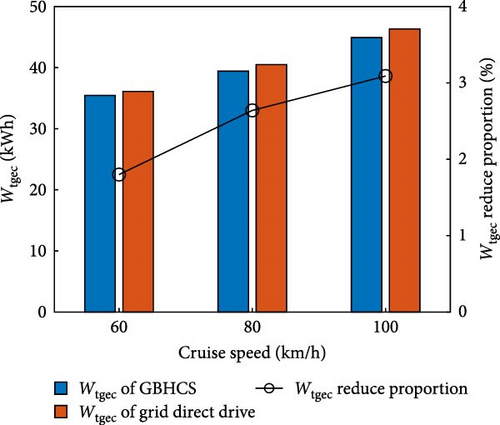
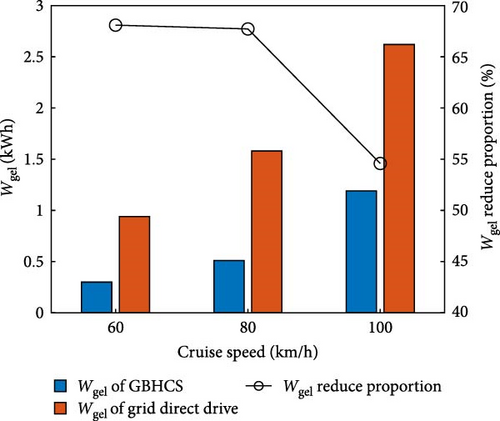
The results of grid energy losses and total grid energy consumption are shown as Figure 10. Compared with conventional whole-process grid direct drive, the application of GBHCS has achieved better optimization results for the grid energy loss and total grid energy consumption across various cruise speeds. Grid energy loss can be reduced by 54%–68% and total grid energy consumption by 1.8%–3.1%. Notably, the optimization effect becomes more pronounced with higher cruise speeds, highlighting the advantages of this approach.
4.2. Results of MVSCS
In MVSCS transportation, GBHVs enter the section sequentially. For this paper, GBHVs platoon are set to cruise at a speed of 90 km/h, with a 200-m gap between two adjacent GBHVs. The application scenarios of this system are mostly directed at high-speed cruising situations. A cruise speed of 90 km/h is more in line with the actual driving state, the corresponding driving power of the vehicle is higher, and the power flow of the system is also higher. The control results at this speed can better reflect the control effect of the strategy. The 200 m headway value was selected based on the safe braking distance of heavy-duty trucks.
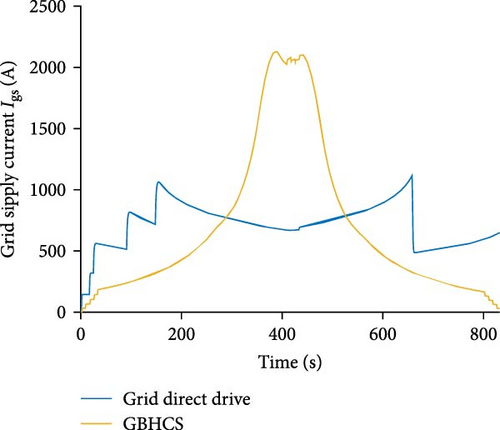
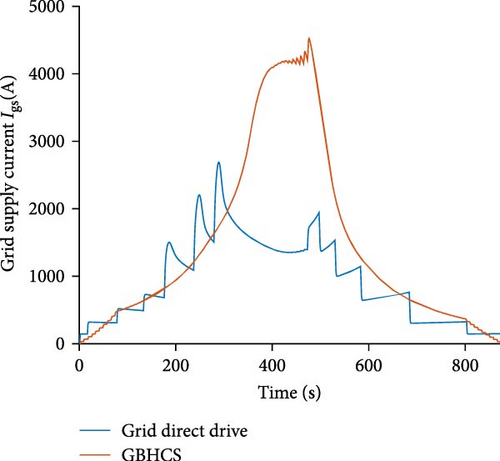
As shown in Figure 11, to ensure the stability of DCPSG output voltage and current, a period of time after GBHVs enter the section in succession without the use of the GBHCS, the trailing GBHVs temporarily employ the battery direct drive mode for propulsion. During the process of driving towards the end of the section, as the GBHVs are farther away from the center of the section, the grid power loss increases gradually. The leading GBHVs need to proactively switch back to the battery direct drive mode to prevent the output voltage and current instability of DCPSG. Therefore, there are two defects in the whole transport process of MVSCS can be avoided with GBHCS:
- 1.
Current inrush to DCPSG
As depicted in Figure 11, in the absence of the GBHCS, when the GBHVs are connected to the DCPSG with full power demand and subsequently disconnect during grid direct drive mode, the instantaneous surges in current can adversely affect the stability of power supply to both the DCPSG and the power devices of the GBHVs. This phenomenon may lead to potential ramifications, including compromised service life and safety hazards.
- 2.
Battery SOC imbalance
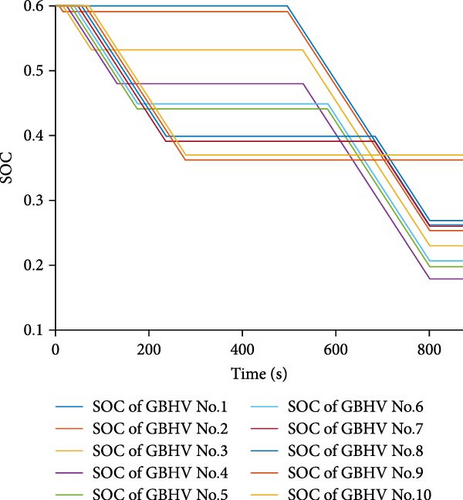
Figure 12 clearly demonstrates that in the absence of the GBHCS, the battery SOC decreases significantly. In the MVSCS scenario with 5 GBHVs, the SOC drops from the initial 0.6 to a final level of 0.43, and in the case of 10 GBHVs, it declines even further to a final SOC of 0.18. This decrease in SOC can become problematic, especially if the battery is unable to recharge promptly. An imbalance in SOC may hinder GBHVs from successfully completing the driving process of the next cycle section. GBHCS effectively addresses this concern by optimizing SOC balance and ensuring the feasibility of subsequent cycles.
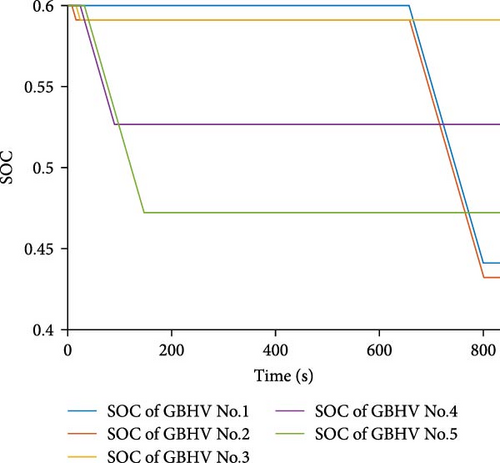
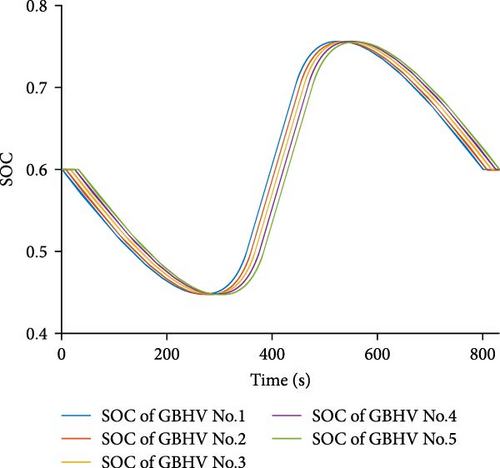
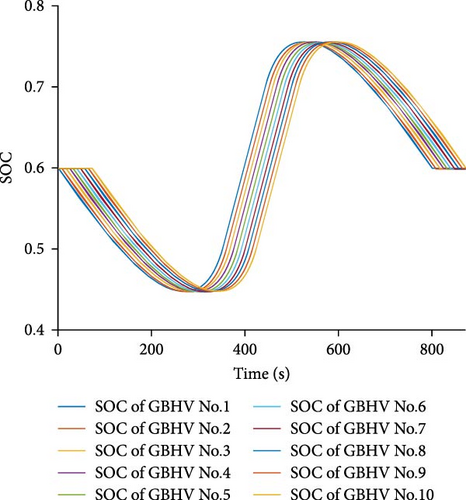
GBHCS can effectively address the issue of battery SOC imbalance, which are shown in Figure 13. In the MVSCS scenario, each individual GBHV undergoes an optimization process akin to the single GBHV in the SVSCS situation, but independently. Consequently, the battery SOC of each GBHV in the MVSCS can maintain balance at the outset and conclusion of the entire driving process within the cycle section. This ensures that there are no concerns regarding the occurrence of DCPSG instability, thereby enhancing the stability and reliability of the system.
In addition to avoiding adverse effects, GBHCS also delivers significant energy consumption optimization in MVSCS. As presented in Table 5, in the absence of GBHCS, the proportions of total battery energy consumption relative to total process energy consumption rise to 9.82% for five GBHVs platoon and 33.70% for 10 GBHVs platoon. Similarly, the proportions of total grid energy loss to total grid energy consumption reach 20.43% for five GBHVs platoon and 25.24% for 10 GBHVs platoon. In contrast, with the implementation of GBHCS, the proportions of total grid energy loss to total grid energy consumption declined to 6.67% for five GBHVs platoon and 15.76% for 10 GBHVs platoon. Compared to grid direct driving, this represents a remarkable reduction of 68.42% for five GBHVs platoon and 37.56% for 10 GBHVs platoon. These results underscore the substantial energy efficiency improvements achieved through GBHCS in the MVSCS scenario.
| Vehicle platoon type | 5 GBHVs | 10 GBHVs |
|---|---|---|
| Headway in the platoon (m) | 200 | 200 |
| Vehicle platoon speed (km/h) | 90 | 90 |
| Grid energy loss Wgel (kWh) | ||
| Grid direct drive | 50.35 | 84.64 |
| GBHCS | 15.90 | 84.03 |
| Grid total energy consumption Wtgec (kWh) | ||
| Grid direct drive | 246.47 | 335.39 |
| GBHCS | 238.28 | 533.26 |
| Total energy consumption of power batteries (kWh) | ||
| Grid direct drive | 26.86 | 170.5 |
| GBHCS | 0 | 0 |
| Proportion of Wgel in Wtgec (%) | ||
| Grid direct drive | 20.43 | 25.24 |
| GBHCS | 6.67 | 15.76 |
| Proportion reduction (%) | 68.42 | 37.56 |
5. Conclusions
This paper addresses the lack of systematic theoretical models and control strategies in current research on ERS by proposing ODS. To quantify the energy dynamics of this system, a closed power supply circuit model is formulated, along with power flow models for each working mode of the GBH system. Among these modes, grid energy loss emerges as a pivotal factor influencing energy utilization efficiency and the joint drive mode proves to be instrumental in mitigating grid energy loss.
The GBHCS based on global optimal design ensures that the power battery provides a specified proportion of motor demand power during the initial driving phase when the catenary resistance is high. This reduces the current in the catenary, thereby minimizing the grid power loss. As the vehicle approaches the substation, it switches to the driving–charging mode to recharge the battery, ensuring SOC balance and maintaining optimal energy efficiency.
In the context of SVSCS, GBHCS not only maintains battery SOC balance but also achieves reductions exceeding 2% in total grid energy consumption and a 50% reduction in grid energy loss compared to whole-process grid direct drive. The optimization benefits of GBHCS become more pronounced at higher cruising speeds. In the MVSCS scenario, GBHCS consistently achieves favorable energy consumption optimization while maintaining battery SOC balance. Moreover, GBHCS effectively mitigates the adverse impacts of current inrush on the DCPSG. These combined advantages position GBHCS as a valuable solution for enhancing energy efficiency and system stability in long-distance heavy-duty transportation.
In future work, more efficient methods will be employed to enhance the real-time performance of optimization strategies. Future studies will investigate the influence of weather and temperature on system operations by integrating relevant impact mechanisms into the system model. Advanced scenarios that reflect actual traffic conditions will be incorporated into both simulation and field tests to evaluate the efficiency and resilience of the strategies. In subsequent research efforts, we will carefully examine the role of smart grids and propose a comprehensive framework for grid–vehicle collaborative control. This will involve integrating intelligent grid control and sophisticated grid–vehicle information interaction into the system’s energy management strategy.
Nomenclature
-
- ODS:
-
- Online DC-driven system
-
- DC:
-
- Direct current
-
- AC:
-
- Alternating current
-
- DCPSG:
-
- DC power supply grids
-
- GBH:
-
- Grid–battery hybrid
-
- GBHV:
-
- Grid–battery hybrid vehicle
-
- GBHCS:
-
- Grid–battery hybrid control strategy
-
- SVSCS:
-
- Single vehicle in a single cycle section
-
- MVSCS:
-
- Multiple vehicles in a single cycle section
-
- MVMCS:
-
- Multiple vehicles in multiple cycle sections
-
- SOC:
-
- State of charge
-
- DP:
-
- Dynamic programming.
Disclosure
An earlier version of this paper has been presented as Preprint in SSRN according to the following link: [https://papers.ssrn.com/sol3/papers.cfm?abstract_id=4574031] [20].
Conflicts of Interest
The authors declare no conflicts of interest.
Author Contributions
Gaoxin Bi contributed to conceptualization, funding acquisition, investigation, methodology, project administration, supervision, writing–original draft, writing–review and editing. Weidong Liu performed conceptualization, methodology, writing–review and editing. Yuhai Wang performed conceptualization, funding acquisition, methodology, writing–review and editing.
Funding
This work was supported in part by Qingdao Municipal Bureau of Science and Technology: “Projects of Key Technology Research and Industrialization Demonstration in Qingdao” (Grant 23-1-2-qljh-14-gx) and “The Science and Technology Planning Projects of Qingdao” (Grant 22-5-1-yfzt-4-jch).
Acknowledgments
The authors have nothing to report.
Open Research
Data Availability Statement
The data will be made available on request.


