Development of New Prediction Model for Thermal–Electrical Characteristics of Lithium-Ion Batteries Including Low-Temperature Conditions
Abstract
The development of an accurate and robust analytical model for battery thermal–electrical characteristics is crucial to ensuring stable and reliable operation. In this context, this study proposes a new prediction model that estimates the thermal–electrical characteristics of a lithium (Li)-ion battery with high accuracy and low computational cost. Unlike existing models, the proposed thermal–electrical model (TEM) accurately predicts temperature and voltage for both static and dynamic cycles across a wide range of temperature conditions, requiring fewer initial parameters and equations. The proposed model demonstrated its ability to accurately predict the battery temperature under static discharge conditions with maximum errors of 0.8 and 1.6 K for batteries at 0 and −20°C, respectively. Additionally, it predicted battery voltage with an accuracy of 0.054 and 0.088 V for the two dynamic driving cycles of New European Driving Cycle (NEDC) and US06, respectively, with a maximum error of 0.054 V. Furthermore, the proposed model successfully predicted the battery temperature and voltage during driving cycle at −10°C. It was further extended to predict the battery temperature of a 4S1P module unit with an accuracy of up to 1.8 K, thereby demonstrating that it can replace existing models, even at the module level.
Summary
- •
A novel battery prediction model with high accuracy and low computational cost is proposed.
- •
The thermal–electrical characteristics of the battery are utilized to predict battery behavior.
- •
The accuracy of the prediction values of the proposed model is shown to be higher through comparison with Newman–Tiedemann–Gu–Kim (NTGK).
- •
The model predicts battery performance under static and dynamic cycles and over a wide temperature range with an accuracy of 1.6 K and 0.088 V.
- •
The model predicts battery temperature within 1.8 K even at 4S1P module units and shows scalability with battery thermal management system (BTMS) of electric vehicle (EV) and HEV.
1. Introduction
Hybrid and electric vehicles (EVs) have become promising alternatives to replace conventional cars with internal combustion engines to combat the climate crisis caused by extreme environmental pollution [1]. Lithium (Li)-ion batteries, which are used as energy sources for these vehicles, have the advantages of high voltage, high energy density, and low self-discharge rate and are attracting attention as an energy source for automobiles and other fields [2]. However, the temperature and voltage of Li-ion batteries must be within allowable ranges stable operation. The suitable temperature range for these batteries is 15–35°C, and if the battery does not work, various problems will occur [3]. Operating the battery at high temperatures can cause problems, such as solid electrolyte interface layer degradation, swelling owing to electrolyte degradation, and thermal runaway, which can cause the battery to catch fire or explode [4]. In addition, operating the battery at low temperatures can slow its internal reactions, preventing it from charging and discharging smoothly, permanently reducing the capacity owing to Li plating or Li dendrite growth, or damaging the battery by causing an internal short circuit [5]. In addition to these temperature-related problems, battery voltage can be a problem if it is outside the safe voltage range. Charging above the allowable voltage of the battery can cause swelling and thermal runaway, similar to a high-temperature situation, whereas discharging below the allowable voltage of the battery can cause the decomposition of the current collector, which can cause problems with battery stability [6]. Therefore, the temperature and voltage of the battery need to be predicted and checked to ensure its stability.
The electrochemical processes inside Li-ion batteries need to be understood to predict their temperature and voltage [7]. The battery voltage is determined by the open-circuit voltage (OCV) and internal resistance of the battery, which correspond to the voltage of the battery when no other external load is applied [8]. The OCV varies with the state of charge (SOC) of the battery. The voltage of the battery varies not only with the SOC of the battery, but also with the temperature of the battery and the current rate (C-rate), which is the C-rate during charging and discharging [9]. The temperature of the battery is determined by its calorific value, which is determined using the Bernardi et al. [10] equation. The battery heat equation can be simplified to express the calorific value of the battery because less heat is present owing to enthalpy mixing and phase change [11]. According to this equation, the heating of a battery comprises Joule heating owing to internal resistance and entropic heating owing to electrochemical reactions. Joule heat is generated by the resistance to the movement of Li ions inside the battery [12]. The amount of heat generated from the internal resistance varies depending on the C-rate and SOC. The amount of heat generated from entropic heating is determined by the battery operating current, temperature, and internal entropy change [13]. Internal entropy change refers to the change in the reaction entropy of the active material on the anode, which can be translated into the entropic coefficient of the battery (dVoc/dT) [14]. As with Joule heating, the calculation of entropic heat depends on the SOC and discharge of the battery. Therefore, to determine the temperature and voltage of a battery, the various electrochemical reactions in the battery need to be understood and a model that accurately predicts the temperature and voltage as functions of the heat output of the battery needs to be developed.
Several studies have been conducted to predict the temperature and voltage of batteries for their reliable use [15]. Three main battery models have been proposed to predict the temperature and voltage of a battery [16–18]. First, the Newman–Tiedemann–Gu–Kim (NTGK) model predicts the OCV and electrical conductivity of a battery using its charge and discharge data to predict its thermal and electrical behaviors [19]. This model accurately predicts the behavior of a battery by combining its thermal and electrical characteristics and predicts its temperature and voltage. Madani et al. [20] used the NTGK model in ANSYS Fluent to determine the calorific value of a battery with a high discharge rate of 15 C and a thermal abuse model to build a simulation model for thermal runaway. Using the NTGK model, Morali [21] implemented discharges at different battery C-rates to demonstrate that the C-rate and convective heat transfer coefficient significantly affect the maximum temperature and internal temperature difference of the battery. Zhang et al. [22] developed an existing NTGK model using Gaussian process regression and implemented the model at the discharge rates of 1, 2, 3, and 5 C in single cells and modules. However, obtaining the data required to implement the model is time-consuming and implementing the accurate model using data is difficult.
The equivalent circuit model (ECM) predicts the behavior of a battery by simplifying the battery into its constituent electrical elements, such as resistors, capacitors, and OCVs [23]. The ECM describes the battery by analyzing its characteristics as a resistor and capacitor through experiments and makes real-time predictions regarding the dynamic behavior of the battery. Baveja et al. [24] used COMSOL and MATLAB Simulink to model a battery module in which the parameters of the components of the ECM change with the temperature and SOC, using the results of pulse discharge tests at 25.5, 35.5, and 45.5°C. Koseoglou et al. [25] used electrochemical impedance spectroscopy and hybrid pulse power characterization (HPPC) techniques to implement current–voltage characteristics under different battery SOCs and temperatures for a 3.25 Ah cylindrical battery to advance the ECM. Tang et al. [26] used an ECM fused with a neural network that utilized the temperature–SOC characteristics of the battery for SOC estimation and predicted the cylindrical battery voltage to within 18 mV root mean square error (RMSE) for multiple driving cycles at 10, 20, 30, and 40°C. Despite these advantages, the ECM has disadvantages in terms of prediction accuracy: linear predictions are involved and the model is difficult to implement owing to the increased number of resistors and capacitors required to describe the state of a complex load.
Unlike the two previous models, the Newman pseudo-two-dimensional (P2D) model is theoretical. P2D model was described battery components such as the battery electrodes, electrolyte, and separator, which were used to predict the voltage and temperature of the battery [27]. For diverse types of batteries, variables such as electrical conductivity, Li-ion concentration, and electrolyte diffusivity were used to describe precise internal electrochemical reactions, resulting in accurate temperature and voltage predictions. Panchal et al. [28] implemented P2D models for 18,650 cylindrical batteries at 1, 2, 3, and 4 C using ANSYS Fluent. Yu et al. [29] reduced the computational cost of building a P2D model by creating algorithms to speed up the calculation of the input parameters and outputs of the P2D model or to increase its accuracy and increase the accuracy of voltage prediction to 0.4 mV. Gu et al. [30] simplified an existing complex P2D model and validated it in static and dynamic discharge situations, improving the performance by reducing the time required to calculate the model parameters by one-tenth without reducing the accuracy of the model. Although accurate prediction performance of P2D model, the disadvantages included a considerable number of variables required to implement the model and high computational cost.
According to the literature reviews, various models have been developed to predict the temperature and voltage of batteries for their reliable use. These models predicted the behavior of batteries by modeling the electrochemical reactions inside the battery. However, the complexity of the computations in developing the models resulted in long construction times or, in the case of simplified computations, poor model accuracy. In addition, the developed models only considered the characteristics of batteries near 25°C and did not make predictions for batteries in low-temperature environments. Therefore, in this study, a model that enables accurate temperature and voltage predictions for batteries with reduced complexity was proposed. Furthermore, by reflecting the characteristics of batteries at low temperatures, the same model could make predictions not only at 25°C, but also at low temperatures.
The battery prediction model in this study established heat and voltage equations to calculate the voltage and temperature through battery modeling. Data maps built through basic experiments at room and low temperatures were used to calculate the internal resistance and entropic coefficient of the battery as a function of the initial temperature, SOC, and C-rate of the battery. For the internal resistance, the relationship between the OCV and the actual voltage of the battery was used, and for the entropic coefficient, the inverse heat transfer analysis (IHTA) method was used to calculate the dynamic entropic coefficient of the battery. In addition, the constructed model was used to validate the predictions of temperature and voltage for the dynamic behavior of the battery, demonstrating the predictability of the dynamic cycle at low temperatures. Furthermore, the scalability of the implemented model was demonstrated through module-level predictions, demonstrating that the proposed model was suitable for use beyond the battery module level at room and low temperatures. The above results confirm that the developed model is a simple and precise predictive model for the battery temperature and voltage, which is required for stable battery operation.
2. Numerical Model Concepts
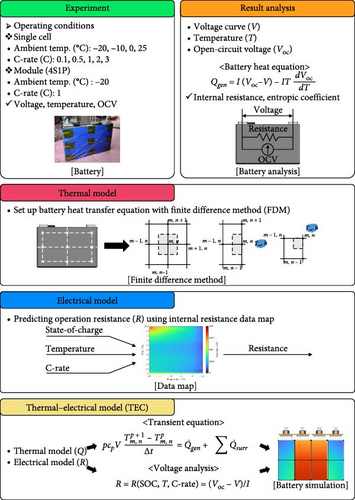
The equations and characteristics of the commonly used NTGK, ECM, and P2D models for predicting the temperature and voltage of the battery and the model proposed in this study are shown in Table 1. In conventional battery models, accurately predicting the temperature and voltage of batteries involves calculating several equations related to electrochemical reactions within the battery, such as the P2D model, or the model was built by describing the inside of the battery with various components, such as the ECM, and various experiments were conducted to calculate the values of the components. By contrast, NTGK models, which describe the battery behavior through simple modeling, use relatively little experimental data to predict the temperature and voltage of the battery. However, these models have a disadvantage: achieving high computational accuracy for describing battery behavior is computationally expensive and models using simple battery modeling have low prediction accuracy or can only describe simple behavior. The proposed model utilized the results of typical battery operation experiments and simple battery modeling consisting only of the OCV and internal resistance to describe the thermal and electrical behavior of the battery, resulting in a simpler and more accurate battery model than existing models to overcome these limitations. Although detailed electrochemical processes such as diffusion or phase transitions are not explicitly modeled, their aggregate effects are embedded in the experimentally derived parameter maps (resistance and entropic coefficient), which vary with SOC, temperature, and C-rate. Utilizing the thermal–electrical characteristics derived from these basic heat-generation equations for batteries, the model can be used not only for the NMC batteries used in this study, but also for any battery type for which internal resistance and entropy coefficients are determined. A schematic of the thermal–electrical model (TEM) developed in this study is shown in Figure 1. As illustrated, the characteristics of the battery are calculated from its operational results across a wide range of initial temperatures. The internal resistance or entropic coefficient was calculated using the battery calorific value and simple battery modeling. These calculated resistances and coefficients are subsequently used to perform the thermal and electrical modeling of the battery, enabling the construction of the predictive model for battery temperature and voltage. The battery calorific value, entropic coefficient, finite difference method (FDM), and internal resistance used to construct the model are described in the following sections.
| Model | Governing Equation | Characteristics |
|---|---|---|
| NTGK |
|
|
| ECM |
|
|
| P2D |
|
|
| Proposed model |
|
|
2.1. Thermal Modeling
The left-hand term in Equation (1) represents the calorific value of the battery, and the first term on the right-hand side represents the irreversible Joule heat generated by the internal resistance of the battery. In addition to the battery current (I) and battery voltage (V), the OCV (Voc) of the battery is required to quantitatively calculate the Joule heat. In general, the OCV of the battery can be obtained through the galvanostatic intermittent titration technique; however, accurately measuring the SOC is difficult owing to the characteristics of the battery, in that the capacity changes as the temperature decreases. Therefore, in this study, the OCV was measured by changing only the temperature of the battery and measuring the voltage at thermal and electrical equilibrium after adjusting the SOC between 0% and 100% in intervals of 5% at 25°C. The second term at the center of Equation (1) represents the reversible heat generated by a change in the internal entropy of the battery, which requires the calculation of the entropic coefficient. The entropic coefficient was usually measured through a potentiometric or calorimetric method; however, as both methods were expensive, this study applied Han et al.’s [31] IHTA method to quickly calculate the entropic coefficient directly from the battery-heating equation via backward calculation. The calculated entropic coefficient was used to determine the heat generation of the battery as a function of its charging and discharging. Because these values were calculated for a wide range of initial temperatures, C-rates, and SOCs, they could be used to predict the temperature of the battery for any battery cycle. For a more precise battery temperature prediction, the FDM was used to utilize the heat generation of the battery to build heat transfer equations for the top, middle, and bottom parts of the battery, using six nodes representing the battery used in each charge/discharge cycle. Figure 2a,b shows the geometry of a single cell and module using the FDM and a figure of the case used for the FDM. The heat transfer equations used in the FDM case, as shown in Figure 2c, are expressed by Equations (2)–(4).
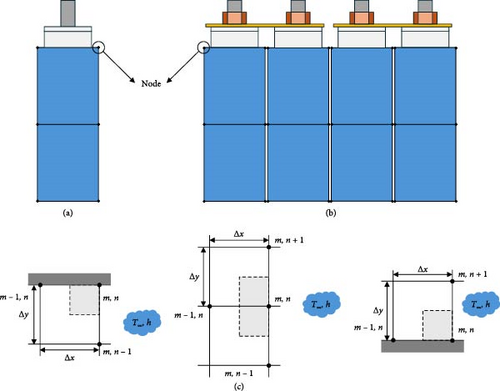
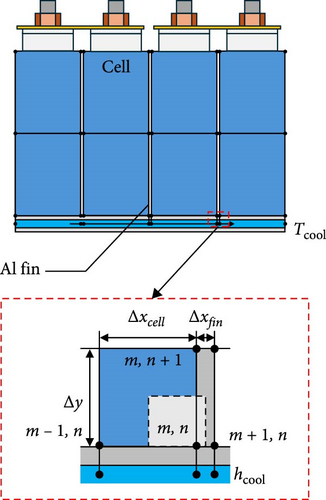
The equations were applied between each node to describe the heat conduction inside the battery and represent the overall effect of the heat generated by charging and discharging the battery over time. The thermal equations for the battery nodes were calculated using battery specifications to establish a heat conduction equation that reflects the heat transfer area and thermal conductivity. For the thermal model with the FDM, not only was the internal heat of the battery analyzed, but the heat transfer with the surroundings was also considered to enable the temperature description of the actual battery. In the equation, h, which represents the heat transfer coefficient to the outside, was calculated using the method of Han et al. [31] and Δx and Δy were applied to the gap between the thermocouples (TCs) of the battery to describe the temperature distribution of the actual battery using the model. The heat generation according to the C-rate of the battery, predicted based on the battery temperature characteristics, was substituted for the heat generation of the battery area included in the node to reflect the battery heat generation according to the charge/discharge cycles. By calculating the time-varying heat transfer between battery nodes using this model, we could predict the temperature of the battery as it changes dynamically over the charge and discharge cycles.
2.2. Electrical Modeling
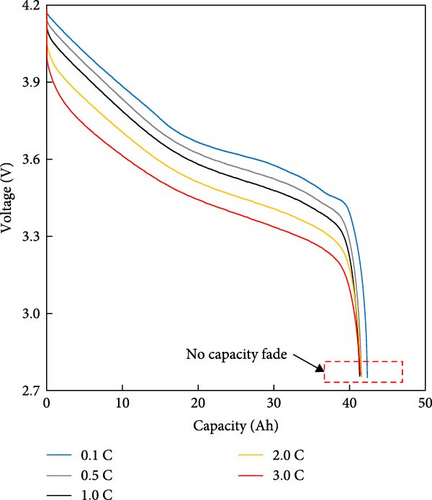
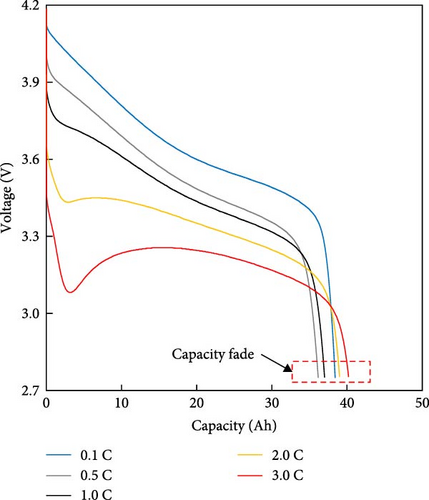
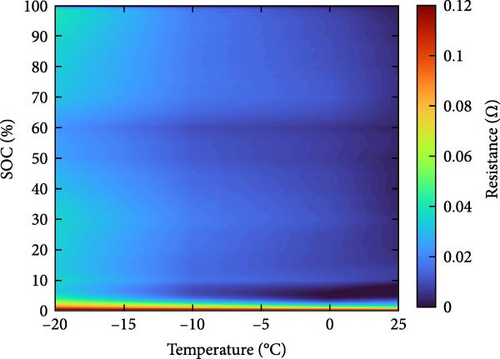
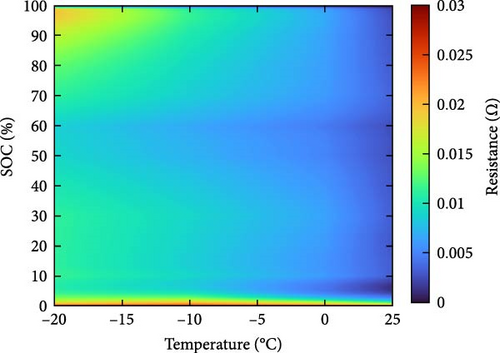
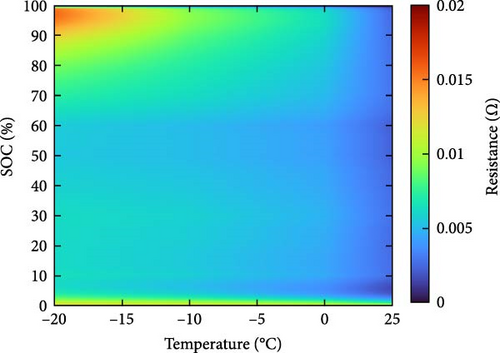
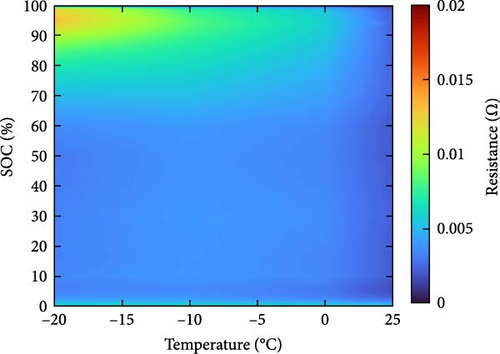
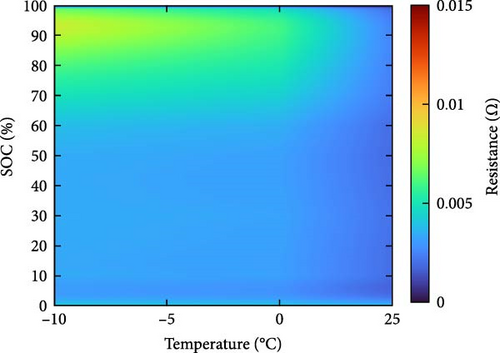
The resistance of the battery, as calculated using the equation above, is influenced by the voltage of the battery, which varies depending on its SOC and temperature. The criteria for evaluating battery resistance under normal and low-temperature conditions should differ to account for the SOC variations. In Figure 3, the discharge curves of a battery at 25 and −10°C are shown, and the voltage as a function of capacity is plotted for various C-rates from 0.1 to 0.5, 1.0, 2.0, and 3.0 C. In Figure 3a, the voltage of a battery at 25°C is shown. The initial voltage drop is large depending on the C-rate, but the difference in capacity between C-rates is not significant. In contrast, Figure 3b depicts the behavior of the battery at −10°C, where the initial voltage drop is more pronounced compared to Figure 3a, and the discharge capacity varies significantly with each C-rate. In Figure 3a, the reason for the change in capacity according to the C-rate is that the higher the C-rate, the more the internal ionic imbalance of the battery increases during discharge and charge, and the internal resistance increases, resulting in a larger voltage drop; thus, the discharge cutoff voltage is reached faster and the capacity decreases. However, in Figure 3b, the capacity at 3 C is the largest, which is the opposite of the previous result because the battery starts to discharge at a lower temperature. For batteries in a low-temperature environment, the internal resistance increases owing to a decrease in the temperature of the electrolyte inside the battery. As this increased resistance is dissipated by the heat generated by the battery discharging at a high C-rate, the increase in resistance caused by the lower-temperature electrolyte is gradually reduced as the temperature increases, leading to an increase in the battery voltage, which in turn allows the battery to be used for longer, thereby increasing its capacity. This change in resistance owing to capacity fading must be applied to various temperatures and SOCs to predict the resistance of the battery accurately. Therefore, for the battery resistance at the low temperatures, we calculated the resistance of the battery in various states by constructing a data map as a function of the initial temperature, SOC, and C-rate of the battery, as shown in Figure 4.
2.3. Experiment Setup
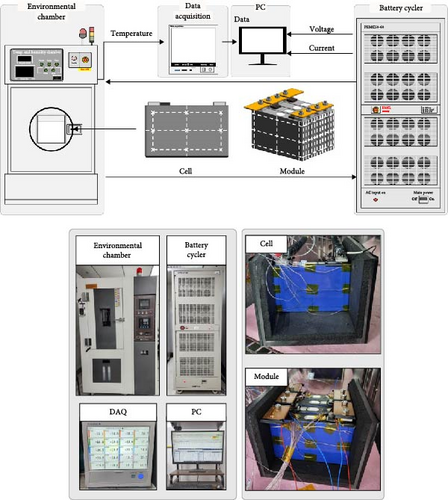
The experiments were conducted under different conditions to develop TEM model. The battery charge–discharge cycles designed for the experiments are shown in Figure 5. The battery was charged and discharged using a battery cycler and an environmental chamber was employed to verify the battery’s temperature characteristics under constant ambient conditions. During the experiment, the voltage and current of the battery during charging and discharging were recorded using a control PC. The equipment specifications are listed in Table 2. The specifications of the battery used in this study are listed in Table 3. The battery used in the experiment was a 40 Ah prismatic battery of the LiNiMnCo type. TC sensors were used to measure the temperature of the battery during charging and discharging, as shown in the photographs of the battery cell and module in Figure 5. The experiments on the battery cell and module required to carry out the thermal and electrical modeling proposed in this work were carried out using an environmental chamber to achieve different environmental temperatures (−20 to 25°C) and a charger to provide different charge and discharge conditions (0.1–3 C). For the battery cell and module, for consistency with the thermal model using FDM, they were assumed to be insulated by wrapping them on the sides and bottom with containers made of acrylic and insulation, as shown in Figure 5. The temperatures measured by the TC sensors attached to the battery surface were recorded using a data acquisition system from YOKOGAWA and viewed on the control PC.
| Equipment | Manufacturer | Model | Operating range | Accuracy (F.S) |
|---|---|---|---|---|
| Battery cycler | PNE Solution | PEMC 50-60 |
|
|
| Environmental chamber | Won Technology | WTHWF-192-Ex | −40 to 150°C | ±0.5°C |
| Thermocouple sensor | JIS-28G-TEF-T | T-type | −50 to 200°C | ±0.5°C |
| Parameters | Value |
|---|---|
| Mass (g) | 850 |
| Width (mm) | 148 |
| Length (mm) | 92 |
| Thickness (mm) | 27 |
| Nominal voltage (V) | 3.7 |
| Density (kg·m−3) | 2312 |
| Thermal conductivity (W·m−1·k−1) |
|
| Specific heat (J·kg−1·K−1) | 1024 |
| Nominal capacity (Ah) | 40 |
The battery temperature and C-rate were varied to verify the low-temperature characteristics of the batteries. The battery temperature was reduced to −20, −10, 0, and 25°C to assess the differences compared to its characteristics at 25°C, and the battery was discharged at various loads from 0.1 to 0.5, 1, 2, and 3 C to measure the change in battery characteristics as the battery load varied. The battery discharges were used to measure the low-temperature characteristics of a single cell. However, in real-world applications, such as EVs and energy storage systems, Li-ion batteries are often used in module rather than in single cells. Therefore, low-temperature discharge at −20°C was performed not only on single cells but also on module of 4S1P. The discharge results from the module were used to validate the module temperatures predicted using the low-temperature characteristics of the single cell.
3. Result and Discussion
3.1. Cell Level
In the previous section, the temperature-dependent characteristics of the battery were confirmed and analyzed through low-temperature discharge experiments. Additionally, data maps of the battery’s internal resistance and entropic coefficient were constructed to develop thermal and electrical models for the battery. In this section, TEM for the temperature and voltage of the battery is presented. The model was used to predict the single-cell discharge and automobile driving cycle. The prediction was also performed at the module level of 4S1P to demonstrate the model’s scalability to the module level.
3.1.1. Temperature Prediction
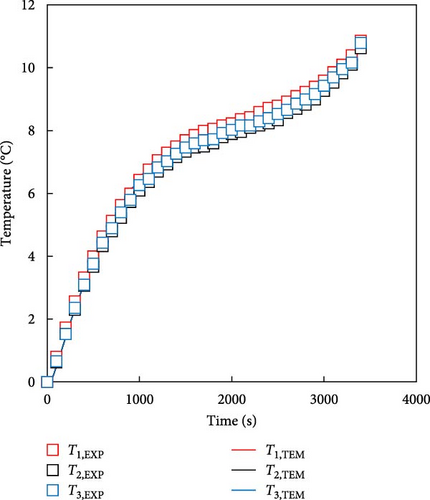
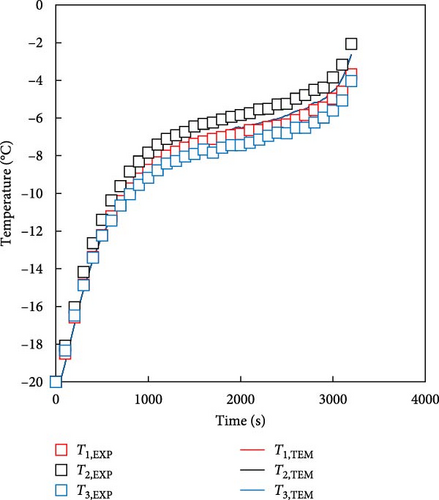
The battery thermal model was developed using the battery heating equation and data map described in the previous section. The proposed temperature prediction model simplifies the representation of a battery’s thermal characteristics by calculating the exothermic behavior of the battery (Equation (1)) through the values of the internal resistance and entropic coefficient of the battery rather than describing the internal electrochemical reaction of the battery through multiple equations, which is the heat prediction method of existing models. Furthermore, the calculated heat generation values were incorporated into the FDM using Equations (2)–(4), along with the battery specifications. This integration allowed the prediction of transient temperature changes through the heat transfer equation for the six nodes shown in Figure 2a for better accuracy. The predicted temperatures from TEM were compared with the actual experimental values during the discharge of low-temperature batteries and the battery temperature of the 1 C discharge experiment for batteries at 0 and −20°C. In the experiment, the battery temperatures were measured as T1, T2, and T3, representing the average temperatures of the top, middle, and bottom sections of the battery, respectively. The temperature of the FDM model was calculated as simulated T1, T2, and T3, which are the average temperatures of the nodes corresponding to the same locations in the single-cell model and the two sets of values were compared. The results of the 1 C discharge experiment of the battery at 0°C and the battery temperature predicted by the FDM are shown in Figure 6a. The temperature of the battery experiment and that predicted by the FDM are in good agreement, without significant differences. The maximum temperature errors for the top, middle, and bottom parts of the battery are 0.8 K. The RMSE value at each point shows a difference of up to 0.5 K, indicating high accuracy. The results of the experiment and model at −20°C are shown in Figure 6b, which is the same as the previous condition. When comparing the experimental and FDM-predicted values, depending on the measured and predicted locations, the battery temperature differed by up to 1.6 K, and the RMSE differed by up to 1.1 K. In Figure 6, the error of −20°C was slightly larger than the predicted error of 0°C. This is because the heat generation increased due to the increase in the resistance of the battery in a low temperature environment and the temperature deviation according to the internal structure of the battery occurred more greatly. In the case of Figure 6b, the temperature of the middle and upper part where the tabs were located was relatively high, and although the FDM of this model cannot describe the actual internal structure of the battery and has equivalent heat generation conditions, even if the cause is accepted, it was confirmed that there was a small error of up to 1.6 K. These results indicate that the thermal model developed using battery-specific characteristics can predict battery temperatures with minimal discrepancies.
3.1.2. Voltage Prediction
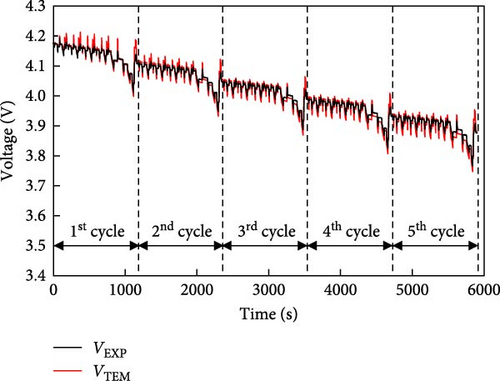
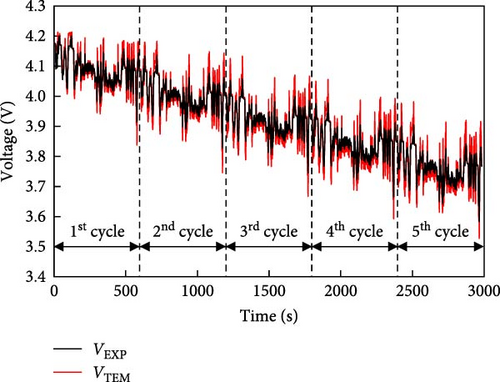
In this section, a simple battery electrical model is developed using the internal resistance of the battery and prediction results are compared with those of an experiment over the driving cycle of a typical EV. Unlike existing models for predicting battery voltage, this model simplifies calculations by describing the battery using only its OCV and a single resistance. For the battery voltage prediction model, the internal resistance of the battery was first calculated and the voltage predictions were made using the relationship among resistance, OCV, and actual voltage as defined by Equations (5)–(7). The resistance value used was determined by the external temperature, SOC, and C-rate and was calculated using the resistance value that fits the conditions at the time of battery operation. In addition, because the OCV of the battery was different during charging and discharging, the resulting values for both charging and discharging were used to show the driving cycle rather than applying a constant current. The driving cycle included a temperature of 25°C with five consecutive cycles of both the New European Driving Cycle (NEDC) and US06, the voltage predictions obtained from the electrical model were compared with the experimental results. A comparison between the voltage calculated using the electrical model and that obtained from the driving-cycle experiment using a battery is shown in Figure 7. In the prediction using the NEDC cycle shown in Figure 7a, the black line represents the driving cycle voltage curve obtained from the experiment and the red line represents the predicted voltage of the driving cycle calculated using the electrical model. The maximum voltage difference between the two lines for five NEDC cycles was 54 mV and the RMSE was 12 mV. Therefore, the predicted voltage trend closely agrees with the experimental voltage trend. The results of the comparison under the same conditions are shown for the US06 cycle in Figure 7b. For five US06 cycles, the difference between the maximum voltage predicted by the electrical model and the actual experiment was 88 mV and the RMSE was 28 mV. Similar to the NEDC cycle, the decreasing voltage trends were almost identical. This difference in the prediction error is because the prediction of the change in the internal resistance of the battery using the model is affected by the resistance value according to the internal ion distribution rather than the constant current–based resistance of the data map of this model in the driving cycle with rapid current changes. Due to this difference, a prediction error occurs in the voltage of US06, but the numerical value is less than 0.1 V, which is a very small error, and as shown in Table 4, it can be confirmed that there is no significant difference in the error value compared to other models. Therefore, the simple battery model using a single resistor has been proven to be suitable for predicting battery operation. However, for this error, the model would be develop to reflect the resistance due to the change in internal ion distribution through additional model improvement research in the future.
| Method | Computational cost | Prediction accuracy | Dynamic response | Temperature range | Interpretability | Author | Model accuracy | Temperature range (°C) | Ref | |
|---|---|---|---|---|---|---|---|---|---|---|
| Temperature error (K) | Voltage error (V) | |||||||||
| NTGK | Low | Moderate | Low | Limited | Low | Zhang (2023) | 1.7 | — | 30 | [22] |
| Morali (2022) | 1.7 | — | 25 | [33] | ||||||
| Hussain (2023) | 1.2 | 0.115 | 25 | [34] | ||||||
| ECM | Moderate | Moderate–high | Moderate | Wide | Moderate | Koseoglou (2023) | — | 0.033 | 15 | [25] |
| Li (2021) | — | 0.134 | 0, 25, 45 | [35] | ||||||
| Feng (2015) | — | 0.078 | 20 | [36] | ||||||
| P2D | High | High | High | Very wide | High | Li (2021) | — | 0.074 | 0, 25, 45 | [35] |
| Xu (2015) | 2 | 0.07 | 20 | [37] | ||||||
| Ozdemir (2024) | 1.41 | 0.56 | 20, 50 | [38] | ||||||
| Proposed model | Low | High | Moderate–high | Very wide | Moderate | — | 1.6 | 0.088 | −20, −10, 0, 25 | — |
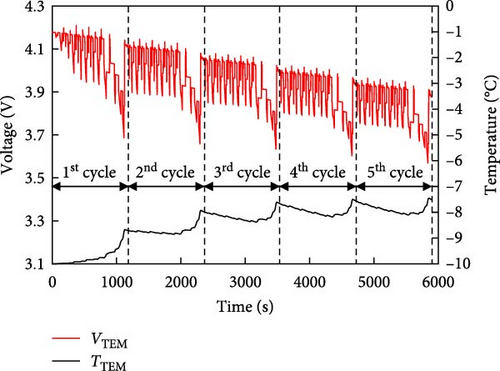
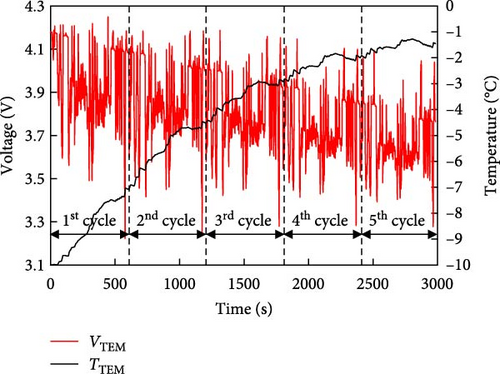
Figure 7 shows the prediction of the electrical model at 25°C, which was consistent with the experimental results. The thermal model was validated using the results in Figure 6. The battery characteristics at low temperatures were used to predict the battery discharge cycle using these validated models, which were not evaluated in the experiment. The results of the NEDC and US06 cycles predicted using the electrical model for a battery with a low temperature of −10°C are shown in Figure 8a,b. A combination of thermal and electrical models was used to predict the temperature and voltage simultaneously. First, the battery internal resistance and entropic coefficient were predicted using the battery temperature, SOC, and current applied to the battery and heat generation was predicted by substituting it into the battery heat generation equation (Equation (1)), to predict the average temperature change in the battery. In addition, based on the predicted battery temperature, the discharge voltage of the battery was predicted using the predicted internal resistance of the battery and OCV. The NEDC and US06 cycles shown in Figure 8 exhibit a slightly larger decrease in voltage than the voltage shown in Figure 7. The predicted battery temperatures in two driving-cycles were −7.5 and −1.5°C, respectively, which indicates that, for an EV with a temperature of −10°C, the large difference in voltage fluctuations owing to high resistance imposing a higher load on the battery. This can accelerate the degradation of the battery pack and reduce its lifespan. Hence, the need for additional equipment to warm up the battery for operation at low temperatures has also been confirmed.
3.2. Module Level
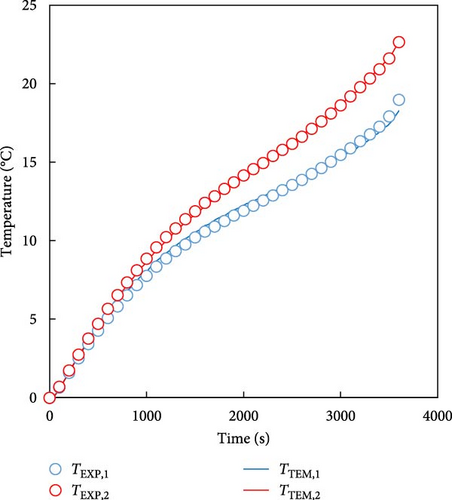
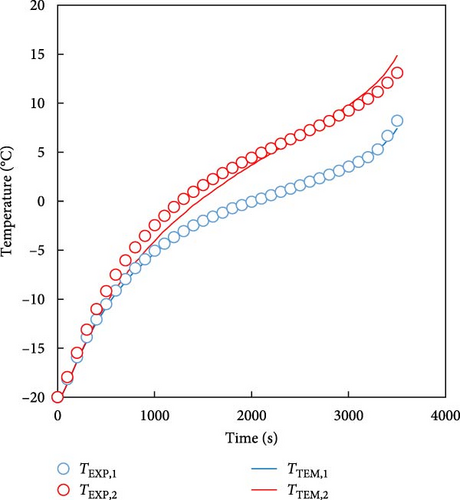
In the previous section, TEM was used to predict the temperature of a single battery and the behavior of a low-temperature battery over a driving cycle. However, in real-world applications, such as EVs, batteries are not used as single cells, but are arranged in modules or packs. Therefore, in this section, we demonstrate that the developed model can predict the characteristics of the battery, even for modular batteries. The battery module used in the experiments and predictions was the 4S1P module, which comprises four batteries connected in series; its experimental and simulated geometries have been presented in Sections 2.1 and 2.2. Because the 4S1P module had two batteries symmetrically connected on the left and right sides, the temperature predictions focused on two representative cells: Cell 1 (outermost cell) and Cell 2 (central cell). The measured temperature curve for a 1 C discharge of the battery module for the temperatures of 0 and −20°C and the temperature predicted by the model are plotted in Figure 9. Cell 1 was the outermost cell in the module and Cell 2 was at the center of the module. As in the previous case shown in Figure 6, the solid line represents the temperature predicted by the model and the marks represent the temperatures obtained experimentally. For the 0°C condition shown in Figure 9a, the temperature prediction for Cell 1 deviated from the experimental values by approximately 0.9 K, while the prediction for Cell 2 deviated by approximately 0.3 K. In the case of predicting the temperature at −20°C in Figure 9b, the temperature was predicted within an error of 1.3 K for Cell 1 and 1.8 K for Cell 2. These results confirm that the proposed model can accurately predict the battery temperature at both single cell and module levels, demonstrating its applicability to real EV battery systems and the FDM extension of the cell-level model to the 4S1P module can also be used for module-level and larger-scale battery modules and packs.
3.3. Comparison of Developed Model With NTGK
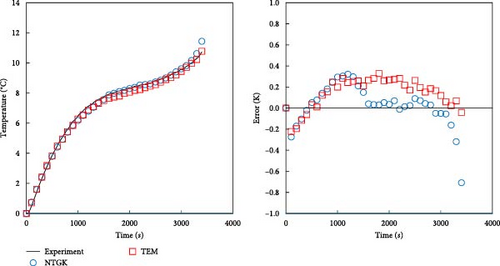
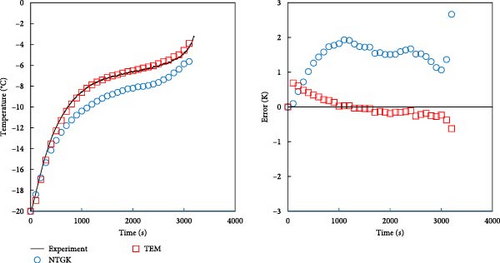
As described in the previous section, the developed model effectively predicts the behavior of batteries, particularly under low-temperature conditions, and accurately forecasts voltage during dynamic operations. In this section, a comparison with the NTGK model is presented to demonstrate that the developed model is more accurate than the existing NTGK model. Figure 10 shows the temperature and its error for a 1 C discharge for a battery at 0 and −20°C. In Figure 10a, the temperature curve of a 1 C discharge at 0°C and its error are shown. Both the NTGK and proposed models predicted the temperature of the battery with an accuracy within 1 K. Both models predicted the temperature of 0°C smoothly. However, for the 1 C discharge of a battery at −20°C shown in Figure 10b, the developed model had an accuracy within 1 K, whereas the NTGK model had an error of approximately 2.5 K. These results indicate that the proposed model provides more accurate temperature predictions across a broader range of operating temperatures. Figure 11 shows a comparison of the predicted values of the two models when predicting the battery voltage under the same conditions as in the temperature prediction above. In Figure 11a, for the prediction value for 1 C discharge at 0°C, both the NTGK and proposed models appear to fit well, but the proposed model shows a very small error of 3 mV compared with the error of 70 mV for the NTGK model. Thus, the proposed model shows a more accurate voltage prediction performance than the NTGK model. Figure 11b shows the 1 C discharge prediction result of the battery at −20°C. The difference between the predicted voltages of the NTGK and proposed models is larger than that at 0°C. In conclusion, Figures 10 and 11 confirm that the proposed model predicts battery temperature and voltage with high accuracy, even at a low temperature of −20°C and its performance is more accurate than that of the NTGK model.
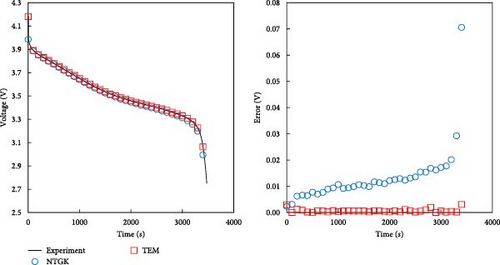
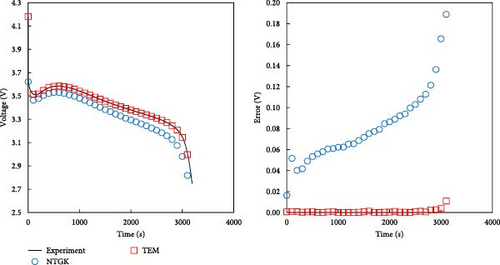
Although the performance of the proposed model has been validated through experiments under various thermal and electrical conditions—including subzero temperatures such as −20°C—it is also important to position its capabilities relative to widely used battery models. As summarized in Table 4, the NTGK model is a simple, empirical approach based on experimental fitting, but it is primarily designed for static operating conditions with constant C-rates and lacks the ability to capture dynamic behavior. In our validation cases, the NTGK model showed larger prediction errors, with up to 1.7 K in temperature and 0.115 V in voltage, particularly under transient conditions. The ECM and P2D models, while capable of handling dynamic operations, require significantly more modeling effort. Reported prediction errors for these models are in a similar range to research results, typically around 0.1 V for voltage and 2 K for temperature. However, both rely on complex parameter identification. ECM models require impedance characterization to determine resistance and capacitance values, while P2D models involve solving coupled electrochemical equations with dozens of internal parameters. In contrast, the proposed model achieves comparable or better predictive accuracy—with voltage and temperature errors of 0.088 V and 1.6 K, respectively—using only three directly measurable inputs: OCV, internal resistance, and entropic coefficient. Moreover, it maintains high accuracy across a broader temperature range (−20 to 25°C). These results highlight the proposed model’s superior balance of accuracy, simplicity, and computational efficiency, making it a highly practical solution for thermal management systems and real-time battery control applications.
3.4. Model Application in Thermal Management System
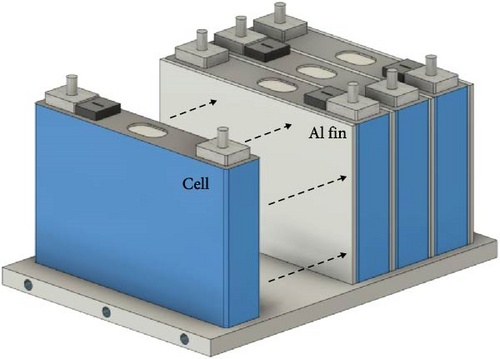
In this section, the developed TEM is applied at the module level within a battery thermal management system (BTMS). From previous sections, it was shown that the predictive model developed in this study can predict battery heat generation and voltage according to various SOC, C-rate, and temperature. By utilizing this, it can preemptively predict changes in battery temperature and voltage due to battery thermal management in the parts where the thermal management system of EV and HEV is applied and predict the required thermal management capacity according to the environment. To demonstrate this, this section shows that the model is predictable through combination with a thermal management system that utilizes basic fins among BTMSs. In the FDM model for describing the internal temperature distribution of the battery in the thermal model of this study, heat transfer through the fin between the batteries is added and the temperature is compared with the temperature when the thermal management system is absent in the battery, and the thermal electrical characteristics are reflected again by reflecting the change according to the temperature change of the battery. Figure 12 illustrates the 4S1P battery module, which is equipped with an aluminum plate for bottom thermal management and fins to enhance thermal dissipation. In general, BTMSs used in hybrid or EVs regulate battery heat via a plate installed at the bottom of the battery, through which coolant flows, as shown in Figure 12a. To evaluate the impact of these system changes, the predicted thermal and electrical behaviors of battery modules with and without BTMS are shown in Figure 13. Since the 4S1P module is symmetrical, regardless of whether a BTMS is applied, temperature and voltage predictions were performed only for one cell as depicted in Figure 12b. The graph on the left of Figure 13 displays the voltage predictions for a 1 C-rate discharge of the battery module at −20°C, while the graph on the right illustrates the corresponding temperature predictions. The prediction for the 4S1P module in Figure 13 includes two scenarios: one without BTMS and another with BTMS, which incorporates battery heating simultaneously with discharge. Moreover, with BTMS case, the predictions were conducted with the various ambient temperatures such as −20, −10, 0, and 25°C so the model could show its performance in wide temperature range. For the BTMS scenario, the heating system was modeled using a 1:1 ethylene glycol–water coolant at 35°C with a flow rate of 30 g·s−1. The FDM equations were utilized to predict both temperature and voltage under these conditions. As shown in Figure 13, the electrical model predicts that the cell voltage with BTMS is higher than cell without BTMS. Moreover, the model predicts the voltage in high ambient temperature higher than that in low temperature. This improvements is attributed to reduced voltage drops as internal resistance decreases during the heating process and ambient temperature rises. Specifically, cells with BTMS demonstrated a voltage increase of up to 0.11 V during discharge compared to cells in the module without BTMS. This result highlights the ability of the developed model to predict the recovery of battery electrical performance facilitated by thermal management. In the case of Figure 13b, the model with BTMS not only accounts for the heat generated by the battery but also incorporates additional heating. As a result, the cell temperature with BTMS exhibited a steeper rise and reached higher levels compared to the cell without BTMS. For example, cell with BTMS showed temperature increases of 14.7 K, compared to cell without BTMS. In addition, when the ambient temperature of the battery changed, the predictive model was able to calculate the cell temperature as the discharge progressed and the heat being heated by the BTMS, enabling predictions over a wide temperature range. These results show that the model is able to predict the temperature of the battery with the inclusion of the BTMS over a wide range of ambient conditions. From these predictions, it can be concluded that the developed TEM is capable of accurately simulating not only simple charge and discharge scenarios, but also those involving thermal management systems, as illustrated in Figures 12 and 13. In addition, these predictions can be utilized in predicting the performance of vehicle thermal management systems because it can be used to analyze the required thermal management capacity for normal operation of the battery in various environments of EVs and HEVs through changes in temperature and voltage.


4. Conclusions
- •
In this study, TEM was built to predict the behavior of batteries accurately using simple battery modeling, unlike existing models, by calculating the thermal and electrical characteristics of batteries using the battery heat equation.
- •
For the thermal model of the battery using the entropic coefficient data map of the battery and FDM, the error of the temperature prediction value was predicted within 0.8 and 1.6 K for a 1 C discharge of a battery at 0 and −20°C, respectively, and the RMSE was accurate within 0.5 and 1.1 K, respectively. The battery voltage was accurately predicted using the electrical model.
- •
In the electrical model, the battery voltage was predicted using the resistance data map, showing errors within 54 and 88 mV for the dynamic operating conditions of the NEDC and US06 cycles, respectively, thus, proving the accuracy of the prediction. Then, using both the thermal and electrical models, the temperature and voltage of the driving cycle at a low temperature of −10°C were predicted.
- •
Furthermore, temperature prediction was performed for a 4S1P battery module using the TEM. The temperature could be predicted within a maximum error of 1.8 K, confirming that the FDM-based predictive model is effective at both the module level and for modules equipped with BTMS. Moreover, the developed model outperformed the NTGK model in predicting both temperature and voltage.
In conclusion, the proposed prediction model showed that the temperature and voltage of a battery could be predicted with high accuracy under various conditions. In particular, the battery temperature and voltage could be predicted using the same model by analyzing and characterizing the battery behavior at low and room temperatures. The proposed model achieved similar or superior accuracy compared to existing prediction models, while requiring simpler calculations. However, the voltage prediction error in dynamic cycles such as NEDC and US06 (up to 88 mV) indicates that the model’s quasi-steady-state assumptions may limit its ability to fully capture transient effects during rapid current fluctuations. To address this, future work will focus on integrating dynamic resistance terms and imbalance heat modeling to improve prediction accuracy under high C-rate conditions. These enhancements aim to bridge the gap between simplified modeling and high-fidelity electrochemical frameworks while maintaining computational efficiency.
Nomenclature
Symbols
-
- A:
-
- Area (m2)
-
- Cp:
-
- Specific heat (J·kg−1·K−1)
-
- h:
-
- Heat transfer coefficient
-
- I:
-
- Current (A)
-
- k:
-
- Thermal conductivity (W·m−1·K−1)
-
- m:
-
- Mass (kg)
-
- Q:
-
- Heat (W)
-
- T:
-
- Temperature (°C)
-
- R:
-
- Resistance (Ω)
-
- t:
-
- Time (s)
-
- V:
-
- Voltage (V)
-
- ε:
-
- Emissivity
-
- ρ:
-
- Density (kg·m−3)
-
- σ:
-
- Stefan–Boltzmann constant (J·s−1·m−2·K−4)
-
- Δx:
-
- x-direction grid size (mm)
-
- Δy:
-
- y-direction grid size (mm)
Abbreviations
-
- BTMS:
-
- Battery thermal management system
-
- C-rate:
-
- Current rate (C)
-
- DAQ:
-
- Data acquisition system
-
- ECM:
-
- Equivalent circuit model
-
- EV:
-
- Electric vehicle
-
- FDM:
-
- Finite difference method
-
- F.S.:
-
- Full scale
-
- HPPC:
-
- Hybrid pulse power characterization
-
- IHTA:
-
- Inverse heat transfer analysis
-
- NEDC:
-
- New European Driving Cycle
-
- NTGK:
-
- Newman–Tiedemann–Gu–Kim model
-
- OCV:
-
- Open-circuit voltage
-
- P2D:
-
- Pseudo-two-dimensional
-
- RMSE:
-
- Root mean square deviation
-
- SOC:
-
- State of charge
-
- TC:
-
- Thermocouple
-
- TEM:
-
- Thermal–electrical model
-
- US:
-
- United States
Subscripts
-
- batt:
-
- Battery
-
- conv:
-
- Convection
-
- EXP:
-
- Experiment
-
- FDM:
-
- Finite difference method
-
- gen:
-
- Generation
-
- loss:
-
- Loss to surroundings
-
- max:
-
- Maximum
-
- m,n:
-
- Central node
-
- oc:
-
- Open circuit
-
- sur:
-
- Surrounding
-
- t:
-
- Previous time step
-
- t+1:
-
- New time step
-
- ∞:
-
- Ambient
-
- ||:
-
- In-plane
-
- ⊥:
-
- Through-plane.
Conflicts of Interest
The authors declare no conflicts of interest.
Funding
This research was supported by Ministry of Trade, Industry and Energy (Grant RS-2024-00403403).
Acknowledgments
This study was supported by the Korea TechnoComplex Foundation Grant and Technology Innovation Program (Grant RS-2024-00403403, Development of fast charge thermal management system active control multifaceted cooling technology) funded by the Ministry of Trade, Industry and Energy (MOTIE, Korea).
Open Research
Data Availability Statement
The data that support the findings of this study are available on request from the corresponding author. The data are not publicly available due to privacy or ethical restrictions.


