Multilayer Collaborative Optimization for the System Configuration, Operation, and Maintenance of Smart Community Microgrids
Abstract
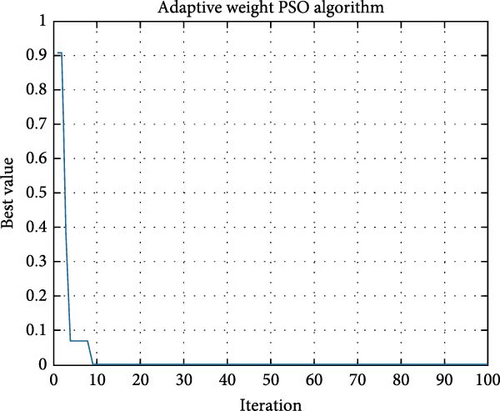
Smart community microgrids are capable of efficiently addressing the energy and environmental challenges faced by cities. However, the inherent instability of renewable energy sources and the diverse nature of user demands pose challenges to the safe operation of community power systems. In this article, we first introduce a comprehensive system architecture, and an operational framework based on Energy Internet of Things (EIoT), which considers system-level safety, reliability, and cost-effectiveness, thereby enhancing the system’s coordination and performance. Next, we propose a bi-level coordinated optimization method based on the users’ electricity consumption behaviors. At the planning level, we employ a multiobjective optimization approach to determine the most suitable microgrid configurations that cater to the requirements of various user groups, and the results derived from adaptive weight particle swarm optimization (PSO) algorithm are fed back to the operational level. At the operational level, a 24-h time scale is selected, and the economic efficiency problem is addressed using a linear programming method. The operational decision results are then fed back to the planning level for major maintenance of the microgrid system. Meanwhile, we employ trend prediction methods to categorize maintenance tasks into short-term and long-term operations based on an analysis of daily operational data. The short-term prediction results can serve as a reference to guide daily short-term operations and maintenance tasks, while the long-term prediction results can inform renovation and reconstruction initiatives for community microgrid. Finally, we choose a community as the subject of our study, and the results indicate that our research can provide new methods for the design and operation of microgrid in smart communities, thereby improving the scalability of the community’s power system.
1. Introduction
Energy has become an increasingly significant role in the development of various aspects of human societies [1]. However, as the scale of the grid continues to expand, community grids are increasingly reliant on external electricity, and fossil fuels are putting pressure on environmental protection. Traditional power systems struggle to meet the growing demand for reliability and diverse power supply needs from users, etc. [2]. With the recent progress in Internet of Things (IoTs), data analysis, and power control technology, smart energy systems have become essential in addressing these challenges [3]. As a typical smart energy system, community microgrid consists of renewable distributed generation (DG, e.g., wind turbines (WT), photovoltaic (PV)), responsive loads, and battery energy storage systems (BESS), as shown in Figure 1. It can provide energy to communities based on real-time load demands from the internal power sources as well as the public grid, which also supports the development of smart and low-carbon cities and communities.
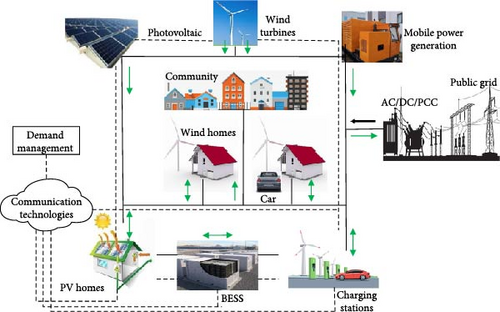
However, the unpredictable and fluctuating nature of renewable energy resources, coupled with the consumption characteristics of load users, introduces multiple uncertainties into the microgrid system. The large-scale deployment of intermittent renewable energy not only affects the accuracy of power system forecasting and scheduling but also tends to cause safety and quality issues. This amplifies the complexity and decision risks in the system design and scheduling of microgrids. Therefore, community microgrid grappling with fluctuations and safety concerns stemming from the integration of renewable energy sources require an urgent adoption of a new approach. The approach should consider optimized design and flexible control mechanisms to facilitate real-time operational control and energy management of intermittent renewable energy sources. It is vital for the sustainable development of communities and cities.
Addressing these challenges requires various computational, control, and analytical techniques tailored to the specific characteristics of microgrids [4]. Previous research has focused on the architecture and strategies for integrating microgrids into smart communities, considering factors such as DG output, energy storage capacity, and operational control methods [5]. For instance, Tercan [6] argued that optimizing the sizes and locations of DG units could mitigate the intermittent and uncontrollable nature of renewable energy sources. Although their approach effectively addressed reliability challenges associated with DG integration, it did not specifically consider the challenges arising from the increasing number of DG units in the power grid. Studies by Tan et al. [7] and Yan et al. [8] examined the impact of growing DG on the network and introduced a reactive power optimization method along with a genetic algorithm (GA) that accounts for the output characteristics of the DG sources. However, the optimization method may not be well-suited for complex microgrid scenarios, as it relies on the traditional linear weighting approach to reduce multiobjective optimization to a single-objective problem [9, 10]. While these studies provided valuable insights into the monitoring and operation of microgrids and addressed some DG related challenges, they often overlooked other critical aspects, such as system economics [11] or reliability [12].
To enhance the economic, reliability, and security aspects of new community energy systems integrating microgrids, researchers have explored various approaches, including architecture, planning, design, and operational optimization methods, all aimed at improving the economic and environmental benefits of microgrid operations [13]. Research on microgrid architecture design has primarily focused on operation modes, energy sources, and load composition, including islanded microgrids [14], grid-connected microgrid [15], and hybrid grid-connected configurations. Further attention has been directed towards the architectural configuration of microgrids [16]. Although these approaches offer simplicity in implementation, they often depend heavily on available resources and specific application scenarios, lacking a comprehensive approach to architectural planning across diverse application contexts.
Optimizing the design of microgrids—including layout, planning, and operation—and implementing effective control strategies can enhance their scalability, applicability, and flexibility. Microgrid design optimization is a complex, multivariable, multiconstrained, and nonlinear multiobjective optimization problem. Commonly used optimization algorithms include particle swarm optimization (PSO) [17], GA [18], and nondominated Sorting Genetic Algorithm-II (NSGA-II) [19]. These methods typically focus on specific scenarios and often lack consideration for personalized and diverse user needs, resulting in limited generalizability in design and planning. To address this, researchers are increasingly incorporating scenario-specific characteristics into design and planning, leading to the development of new optimization algorithms for contexts. Examples include Sequential Quadratic Programming with Gradient Sampling (SQP-GS) [20], Nelder-Mead method [21], and the Sine augmented scaled arithmetic optimization algorithm (SCA-AOA) [22]. Although these studies improve the generalizability of microgrid designs to some extent, they often overlook specific characteristics of community microgrids (e.g., user preferences, microgrid online/offline states), which may impact the safety and stability of the distribution network.
To address these challenges, some scholars have proposed hierarchical division methods that facilitate complementary balance in operational decisions, thereby ensuring the safe and stable operation of the distribution network. Examples include hierarchical optimization [23], bi-level robust optimization [24–26], and tri-level optimization [27]. While multilevel optimization can integrate diverse energy sources and improve energy utilization efficiency, these architectural designs and methods often overlook or underemphasize coordination optimization across different levels, potentially resulting in imbalances in community energy distribution and load.
- a.
Community microgrids face stemming from the complexity and diversity of electricity consumption behaviors, as existing architecture often lack compatibility and synergy for efficient and secure power delivery.
- b.
The integration of multiple energy sources and devices exhibiting stochastic behaviors complicates the optimization of system parameters, and current approaches struggle to generalize effectively across diverse user needs.
- c.
Incorporating new energy sources introduces operational uncertainties and intermittency; however, short-term and long-term forecasting and maintenance strategies for community microgrids are still significantly underdeveloped.
- a.
This article investigates the safety, reliability, and economic challenges of community microgrid in power systems operating under uncertain conditions. It introduces community microgrid architecture based on EIoT that enables seamless coordination among energy components for power balance and optimization, while supporting effective monitoring and management for power systems.
- b.
A multilayer collaborative optimization method for the system design, energy allocation, and operation management of community microgrid is presented. At the planning level, analysis and constraint models are developed based on energy resources and electricity demand, while at the operational level, microgrids are allocated and scheduled based on real-time demand and supply. The interaction between the two layers ensures economic, safe, and stable operation of the microgrid.
- c.
The approach predicts future operational trends by using the operational results of the community microgrid, provides contingency plans for short-term daily operation and maintenance, and offers safety strategies or upgrade guidelines after the microgrid’s long-term operation.
The remainder of this article is organized as follows. In Section 2, we introduce a bi-level optimization method and present a comprehensive system architecture for the community microgrid. Section 3 offers a case study to validate the proposed approach and delves into the results obtained from the study. Finally, Section 4 offers a summary of our work and outlines potential future research directions.
2. Materials and Methods
2.1. Overall Architecture of the Proposed Approach
Figure 2 illustrates the comprehensive system configuration, operation, and maintenance architecture of the proposed smart community microgrid approach. Our approach adopts a data-driven architecture built upon the EIoT framework, leveraging original power consumption data sourced directly from the community. This architecture comprises four main components: power user analysis and classification, design and operation, short-term daily operation, and long-term redesign.
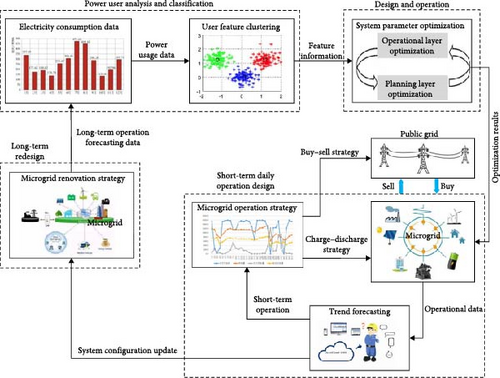
As delineated in Figure 2, the process encompasses several key steps: gathering real-time power consumption data, conducting sample analyses, extracting user group information, and formulating a design-operation dual optimization model based on the power consumption behavior characteristics of different user groups (e.g., elderly, office workers, etc.). The system parameters obtained from the operational aspect are then integrated into the microgrid for its operation. Using daily operational data as a basis, we analyze both short-term and long-term operations of the community microgrid. In the short term, considerations include options such as purchasing or selling power to/from the microgrid and the public grid, as well as managing the charging or discharging of the BESS. For long-term operations, leveraging historical microgrid usage data is invaluable. Predictive insights derived from this analysis can guide decisions regarding redesigning the current microgrid or transitioning energy within older residential areas.
In Figure 2, energy storage systems (ESSs) play a pivotal role in optimizing the operation of microgrids, achieved through a combination of real-time and predictive charging and discharging strategies. Real-time charging and discharging operations are crucial for maintaining a dynamic balance between supply and demand within the grid at any given moment. Conversely, predictive charging and discharging techniques offer additional opportunities for enhancing microgrid efficiency by forecasting future power requirements and availability. Further insights into these strategies are elaborated upon in Part Three.
The secure and stable operational system architecture of the community microgrid depicted in Figure 2 cannot be adequately addressed by traditional monitoring and data collection system architectures. They lack the capability to manage the transitions between on-grid and off-grid operations, coordinate control, and oversee the operation management of the distributed entities within the microgrid. Therefore, this article proposes a community microgrid systems architecture based on EIoT, as illustrated in Figure 3. In this architecture, EIoT serves as the essential cornerstone for enabling “thing-to-thing connectivity” and facilitating information exchange across different layers. It plays a crucial role in ensuring the secure and stable operation of every aspect of the microgrid system, including generation, transmission, transformation, distribution, and utilization. Additionally, the operational architecture depicted in Figure 3 forms the foundation for the overall architecture of the community microgrid in Figure 2. It seamlessly integrates various phases of the energy life cycle, encompassing production, distribution, transmission, and consumption. Furthermore, it fosters seamless connectivity between decentralized energy sources, storage solutions, and the public grid.
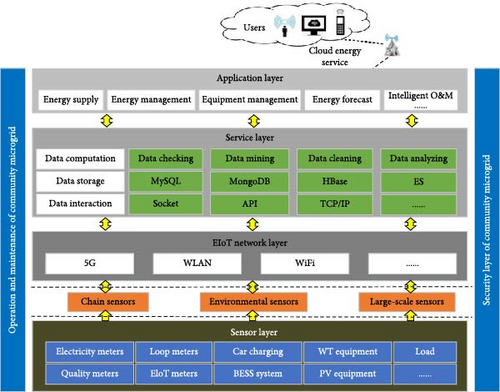
The operation architecture based on EIoT comprises five layers: the sensor layer, network layer, service layer, application layer, and security layer. EIoT and security mechanisms span the entire system. At the sensor layer, hardware, load, and distributed energy sensors are deployed to provide basic data. The network layer is responsible for uploading collected data to the server via various transmission networks. The service layer, which constitutes the system’s core, includes data storage and computation. The application layer handles business applications and system display, including management and maintenance. Additionally, data related to community energy can be uploaded to a cloud energy server, enabling users to access and review diverse real-time data and information through the client interface, ensuring secure and dependable energy resource management.
By integrating the architectures depicted in Figures 2 and 3, the system incorporates two control algorithms for grid connection and islanding modes, facilitating smooth switching between the two operating modes. Furthermore, the system can predict both short-term and long-term electricity consumption, enabling advanced energy management of the microgrid system through predictive analysis to ensure efficient and safe operation. The system supports cross-platform operation and can be deployed on operating systems such as Windows and Linux, in addition to being compatible with nationwide production platforms.
2.2. User Classification Method
Analysis of community residents’ power use behavior is pivotal for the foundational aspects of microgrid planning, energy efficiency optimization, and effective energy dispatch management [28]. The intricacies of electricity data provide insights into user consumption patterns. It is imperative to sift through extensive datasets to derive meaningful insights into users’ electricity behavior. By doing so, we can analyze the specific consumption patterns of community residents. Such an approach not only mitigates the adverse effects of uneven load distribution within communities on the broader power grid but also enhances the reliability and resilience of the microgrid system [29]. Furthermore, it paves the way for tailored microgrid configurations and customized electricity services, catering to the diverse needs of various community types. Ultimately, this fosters a harmonious integration between decentralized energy sources and the primary power grid, establishing a robust foundation for smart grid management and sustainable energy practices in advanced communities [30].
As shown in Figure 4, the analysis of community user electricity consumption behavior is structured around three primary steps:
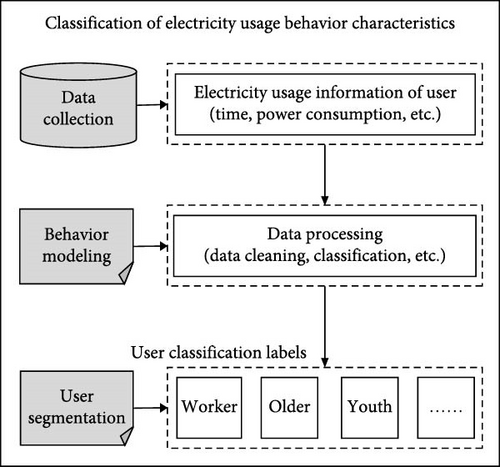
Step 1. Gathering electricity consumption data: This step involves collecting detailed data on electricity consumption from individual users within the community. The data should include metrics such as time of use, load levels, voltage, and current. This information is fundamental for understanding the patterns and trends in electricity consumption.
Step 2. Processing and refining data using machine learning: Once the data is collected, machine learning techniques are employed to process and refine it. This may include data cleaning to remove errors or inconsistencies, outlier removal to eliminate extreme values that could skew the analysis, and categorization to group similar consumption patterns together. Machine learning algorithms can also help identify hidden patterns and correlations within the data that might not be immediately apparent.
Step 3. Labeling users based on characteristics: In this step, users are categorized based on their demographic characteristics, such as age group (elderly, middle-aged, young adults), which can influence their electricity consumption behavior. Understanding these differences can help tailor energy services and microgrid configurations to better meet the needs of different community members.
With the increase in smart home appliances and the adoption of new energy vehicles, the dataset reflecting residential electricity consumption has become increasingly multidimensional. These intricate datasets provide a wealth of information for both research endeavors and practical applications. However, given the interconnected nature of various data dimensions, it is imperative to delve deeply into this vast, multidimensional dataset to discern underlying patterns. Predominantly, the analytical tools applied to decipher residential electricity consumption data encompass machine learning methodologies, such as clustering algorithms [31], support vector machine (SVM) techniques [32], and decision tree algorithms [33].
Given the similarities in electricity consumption data among residents of a community, clustering algorithms prove invaluable in grouping objects with closely aligned attribute characteristics. This approach not only ensures the differentiation of various categories but also enhances computational efficiency in data mining endeavors [34]. In this research, the k-means algorithm is utilized to analyze residential electricity consumption data, leading to the identification of distinct behavioral patterns and operational scenarios [35–37]. Through a detailed clustering analysis of residents’ electricity consumption behaviors, pivotal features were identified to construct the ultimate feature model.
In the matrix described by Equation (2), each row signifies the electricity consumption load data for a single user, while each column denotes the total electricity consumption load for all users during the same period [38, 39].
During the data processing phase, any missing values are eliminated, and metrics are established to assess daily electricity consumption patterns. Within the electricity dataset L, prevalent feature metrics include the peak load rate, off-peak load rate, base load rate, average load, load factor, load skewness coefficient, and load variation coefficient, as detailed in Table 1 [40–42].
| Feature parameters | Feature description |
|---|---|
| Peak load rate | The ratio of electricity consumed during peak hours to the daily electricity consumption |
| Off-peak load rate | The ratio of electricity consumed by users during off-peak hours to the daily electricity consumption |
| Base load rate | The ratio of electricity consumed outside of peak and off-peak hours to the daily electricity consumption |
| Daily load rate | The ratio of the electricity load within a day to the maximum load |
| Load factor coefficient | The ratio of average load to maximum load per user |
| Load skewness coefficient | The ratio of the third central moment to the cube of the standard deviation |
| Load variation coefficient | The ratio of the standard deviation of daily electricity consumption sequence to the average load |
In the equation, Lm stands for the normalized daily average electricity consumption of user m, while represents the unnormalized daily average electricity load for the same user. The terms “max” and “min” denote the maximum and minimum values within that user’s daily average electricity load range.
In the equation, N represents the total number of samples, a (i) denotes intracluster cohesion, b (i) stands for intercluster separation, Ninside is the number of sample points in the cluster to which pi belongs, Noutside is the number of samples outside the cluster to which pi belongs, pj represents the other samples in the same cluster as pi, and qj represents the samples outside the cluster.
2.3. Bi-Level Optimization Method
Based on the characteristics of the energy supply mode, which involves multiple power sources complementation, active load coordination, and two-way electrical energy interaction, the basic bi-level optimization model for a community microgrid is formulated using bi-level planning theory, as illustrated in Figure 5. The upper level functions as the system design module, determining the optimal configuration of the microgrid system (e.g., the number and capacity of WTs, PV panels, and energy storage units). Once these system parameters are determined, the lower level serves as the system scheduling module, deciding the optimal operational strategy for the microgrid system in daily scheduling (e.g., how much electricity is purchased from or sold to the public grid each day). Over time, operational decision results from the lower level, including capacity adjustments and deployment methods, are fed back to the upper level for major maintenance and adjustments of the microgrid system (e.g., adding or decommissioning certain WTs, PV panels, and energy storage units).
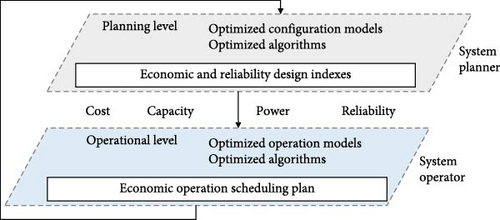
Utilizing the principles of bi-level optimization, we develop a model to tackle the planning and operational challenges inherent in wind–solar battery systems within community microgrid. The upper-level optimization primarily focuses on optimizing capacities, power configurations, and related parameters. Concurrently, the lower-level optimization aims to enhance the economic efficiency of microgrid operations. The specific modeling process is outlined as follows.
2.3.1. Planning Level Analysis Models
2.3.1.1. Objective Functions
In this article, system planning during the construction cycle of a community microgrid is assessed using indicators such as system economy and environmental friendliness, which aligns with the approach described in reference [45].
- 1.
Economic Objectives
- 2.
Environmental objectives
2.3.1.2. Constraints
As this constitutes a multiobjective optimization problem, it is necessary to constrain the objective function within a specific range to ensure that the optimization goal remains within an acceptable limit.
2.3.2. Operational Level Analysis Models
2.3.2.1. Objective Functions
In this study, the selected time scale for the operational-level scheduling optimization is 24 h, with the daily operation cost serving as the objective function. This cost primarily comprises the daily expenses for power purchase and the revenue from power sales [49, 50].
2.3.2.2. Constraints
- 1.
Power balance constraint
- 2.
Energy storage state of charge (SOC) constraint
- 3.
System operating constraint
2.3.3. System Analysis Models
2.3.3.1. PV Analysis Model
2.3.3.2. WT Analysis Model
2.3.3.3. BESS Analysis Model
2.3.4. Solving Method for Bi-Level Optimization
Building on the described microgrid architecture that leverages EIoT and the bi-level optimization approach for planning and operational levels, the overall process for collaborative optimization of community microgrid systems is illustrated in Figure 6.
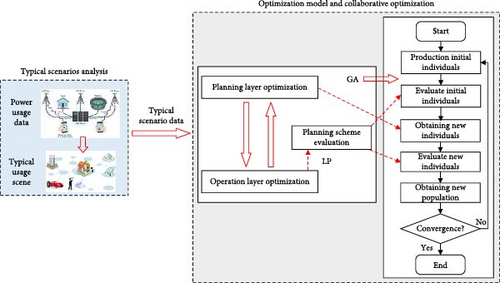
By utilizing clustering validity metrics, we meticulously determined the optimal number of clusters, thus generating representative and diverse typical operational scenarios. Subsequently, a bi-level collaborative optimization is employed, grounded in these typical user profile scenarios.
The planning layer is tasked with coordinating the optimized configuration of distributed renewable energy generation (DREG) systems and ESSs. Through the meticulous optimization of installation capacity, grid connection points, and system types of DREGs and ESSs, a comprehensive balance is struck between the economics, reliability, and environmental impact of the microgrid systems.
The operational layer fully integrates the active participation of the ESS in the management of the microgrid system. By refining the operational plans of the ESS across various typical scenarios, the economic efficiency and reliability of the microgrid system’s operation are significantly enhanced [56–58].
The fundamental process of bi-level collaborative optimization unfolds as follows:
Step 1: Establish the system’s objectives and parameters through independent analysis of electricity demand, forecasts, environmental factors, and community microgrid development trends.
Step 2: Construct the microgrid structure based on this analysis, incorporating energy siting and planning. Define objective functions and constraints for optimization at the planning level and select an appropriate algorithm to solve for the microgrid’s optimization parameters.
Step 3: Simulate the microgrid’s actual operation using the optimal design parameters derived from the planning level. Formulate the operational efficiency optimization model and constraints. Develop an optimization algorithm to address the problem and obtain the optimal operational dispatch results for the community microgrid.
2.4. Electricity Load Forecasting Method
The current configuration of electric power resources is inefficient and urgently requires optimization. Specifically, issues such as an unclear distribution of electrical energy consumption, low equipment utilization rates, uneven load distribution, and underutilized equipment capacities are evident. Consequently, accurate forecasting of electricity load is crucial for integrating new energy sources and facilitating the expansion and transformation of distribution grids.
Forecasting plays a pivotal role in the safe allocation and economic operation of power systems. The accuracy of these forecasts directly influences reliability, economic efficiency, and quality of power supply. Therefore, selecting an appropriate load forecasting method to improve prediction accuracy is of considerable practical importance.
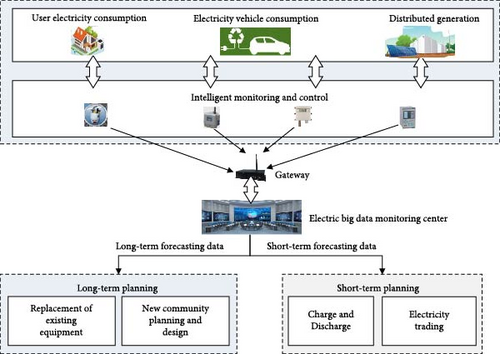
The system can predict both long-term and short-term electricity consumption of the load, thereby enabling advanced energy management of the microgrid system. Through predictive analysis, it ensures efficient and safe operation by forecasting load demand, WT output, PV output, and the status demand of the BESS. Figure 8 illustrates the necessity for adjustments to the microgrid in the context of short-term maintenance tasks, including charge and discharge management, as well as electricity trading. Furthermore, for long-term community planning and operation, factors such as residential needs, ecological considerations, and regional variations in sun exposure must be considered, necessitating further adjustments to the microgrid. These adjustments provide a valuable reference for long-term operational strategies and new grid construction projects.
3. Results and Discussion
3.1. Experimental Scenario Setup
To assess the viability of the models and methodologies presented in this article, we have selected a residential community as the focus of our case study. Electricity consumption data has been collected from the community’s residents and supplemented with datasets from online sources [60, 61]. The models and methodologies have been implemented on a simulation platform using MATLAB R2024b and Python 3.11, in conjunction with the YALMIP optimization tool, CPLEX solver, and Sklearn library. This platform runs on a computer equipped with Intel i7-11700 processor and a GTX1660 Ti-6G discrete graphics card.
As shown in Figure 9, the community’s distributed power sources comprise PV, WT, and BESS systems, among others. These systems are strategically located in open areas or alongside roads within the community and are ultimately into the public grid, providing electrical power to community residents. Given that the BESS in the microgrid has a maximum charging and discharging power of 30 kW and a capacity of 50 kWh and considering that the interruptible load accounts for 15% of the total load, the detailed power parameters of the microgrid are presented in Table 2. Additionally, the time-of-use electricity tariff is outlined in Table 3.


| Type | Power (kW) | Cost (¥/kW) | Life (a) | |
|---|---|---|---|---|
| Max | Min | |||
| WT | 30 | 0 | 0.0296 | 10 |
| PV | 180 | 0 | 0.0096 | 20 |
| BESS | 30 | 0 | 0.0401 | 10 |
- Abbreviations: BESS, battery energy storage system; PV, photovoltaic; WT, wind turbine.
| Time | Buy price (¥/kWh) | Sell price (¥/kWh) |
|---|---|---|
| 00:00–06:00 | 0.25 | 0.22 |
| 06:00–09:00 | 0.53 | 0.42 |
| 09:00–14:00 | 0.82 | 0.62 |
| 14:00–17:00 | 0.53 | 0.42 |
| 17:00–22:00 | 0.82 | 0.65 |
| 22:00–00:00 | 0.53 | 0.42 |
3.2. Analysis and Discussion of Electricity Usage Characteristics
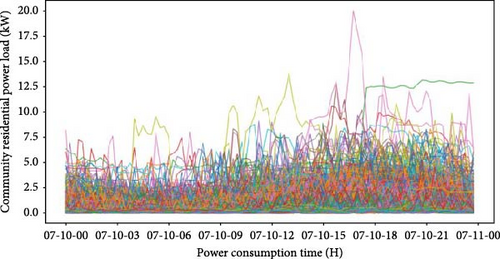
Building on the community microgrid systems architecture described previously, daily electricity consumption data is harnessed from power users within a specific community. This data is sampled at 15-min intervals, yielding 96 load data points per day. Subsequently, the daily electricity data undergoes normalization, and an initial feature set is established based on usage characteristics. Characteristic curves are then plotted to illustrate electricity consumption patterns for different users at various time intervals, as shown in Figure 10. The figure demonstrates that different colors represent distinct electricity usage patterns associated with various user types. Furthermore, the observed user characteristics exhibit considerable variability and necessitate further refinement.
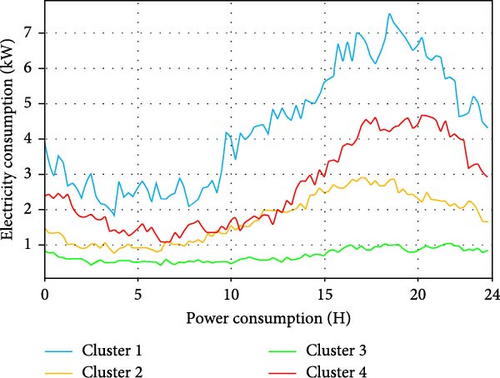
As illustrated in Figure 11, based on their electricity usage behavior characteristics, community users have been classified into four distinct categories: the first category encompasses commercial users; the second category comprises working-class households; the third category includes households with elderly residents; and the fourth category consists of households that include both elderly and working-class members.
3.3. Typical User Community Microgrid Optimization Analysis
Based on the community electricity consumption data, the range of values for determining the primary load feature parameters has been set to [0,1], and numerical identifiers have been assigned to these parameters.
Figure 12 illustrates the Pareto frontier solution, showcasing the optimal configuration of the community microgrid at the planning level, considering both economic and environmental considerations. The graph reveals a tradeoff between the costs related to environmental sustainability and economic benefits. Three representative regions are highlighted for further discussion.
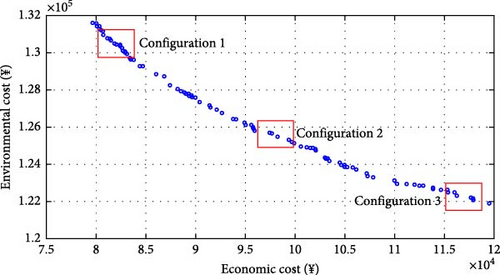
Given the varying requirements of different communities for power supply system attributes, the corresponding microgrid structures and configuration parameters differ accordingly. Communities that prioritize higher economic efficiency may opt for a configuration nearer to region 1. In this case, the community would establish a smaller microgrid and purchase a larger proportion of electricity from the external grid, resulting in increased environmental treatment costs.
Conversely, communities that emphasize clean and environmentally friendly energy solutions may choose a configuration closer to region 3. In this scenario, the microgrid is designed to minimize environmental output costs, although this may come with higher construction costs.
For communities seeking a balance between economic efficiency and environmental friendliness, the configuration parameters in region 2 would be ideal. In conclusion, communities have the flexibility to choose a microgrid planning approach that aligns with their specific needs and priorities.
To further assess the feasibility of the methodology proposed in this article, the optimized configuration for the microgrid in region 2 has been selected. Table 4 presents a comparative cost analysis, contrasting the results with those obtained from the original configuration.
| Various costs | Original configuration (10,000 ¥/kW) | Optimized configuration (10,000 ¥/kW) |
|---|---|---|
| CWT | 0.85 | 0.61 |
| CPV | 1.48 | 1.15 |
| CBESS | 2.30 | 1.96 |
| Ctrans | 0.22 | 0.14 |
| IR | 0.09 | 0.07 |
| f2 | 0.46 | 0.37 |
- Abbreviations: BESS, battery energy storage system; PV, photovoltaic; WT, wind turbine.
As illustrated in Table 4, in comparison to the original configuration, the optimized configuration presented in this study significantly enhances overall economic efficiency, strengthens the microgrid’s robustness against the uncertainties associated with new energy sources, and diminishes both energy procurement costs and carbon emissions. The scheme proposed here offers robust support for advancing the clean and low-carbon transition of community energy systems, and the results presented validate the accuracy of our findings.
Figure 13 illustrates the SOC of the BESS within the community microgrid for working-class households. Notably, the SOC of the BESS undergoes a significant decrease during two distinct periods: from 10:00 to 15:00 in the afternoon and from 18:00 to 21:00 in the evening. A comparison of the output curve of the wind–solar power unit with the load output curve reveals a substantial disparity, indicating an inability to meet the load demand during these timeframes.
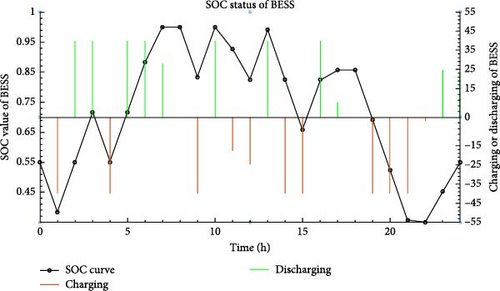
To address this challenge while ensuring economic efficiency, the BESS intervenes to compensate for the power deficit. This enables the comprehensive utilization of renewable energy and achieves the goal of minimizing energy storage operation costs. Furthermore, real-time electricity power dispatching, based on the SOC curve of the BESS, has proven effective in peak shaving and valley filling for the larger electricity grid, thereby significantly reducing the operational costs of the community microgrid.
Throughout the operational phase of smart microgrid, a strong correlation is observed between the interactions of the microgrid with the main grid and the charging and discharging activities of ESSs. Formulating effective strategies for microgrid transactions and energy storage operations requires a comprehensive assessment of various factors, including energy balance, coordinated functioning, and environmental benefits, among others. Additionally, the pursuit of optimal decision-making is further influenced by considerations such as grid stability, the characteristics of storage equipment, and prevailing market demands.
Figure 14 presents the analysis results of a community microgrid operating with a bi-level optimal configuration solution over the course of a typical working day. During peak nighttime hours, the community experiences a significant increase in power demand, which poses a challenge for the PV arrays to meet the electricity needs on their own. Consequently, a combination of WT and BESS is employed to address the heightened load.
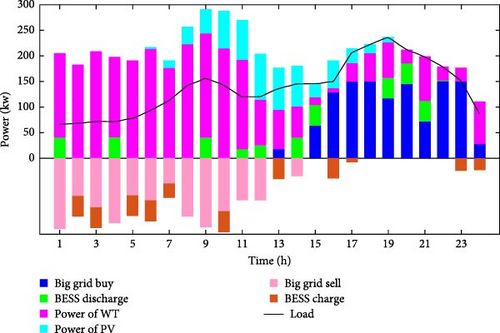
Furthermore, the operation of the community microgrid is influenced by time-of-use tariffs. During periods of lower and standard tariffs, purchasing electricity from the public grid to charge the BESS becomes a viable option. Conversely, during high-tariff periods, the microgrid prioritizes the utilization of WT and PV to meet the community’s load demands. Any shortfall in load is compensated by discharging the BESS, thereby avoiding the need to purchase electricity from the public grid. During periods of lower load, the BESS is charged to prepare for future demand.
The microgrid dynamically monitors the output power of the WT and PV, continuously assesses the SOC of the BESS, and adjusts the output power accordingly to minimize BESS charging cycles and enhance its lifespan. In practical applications, real-time charging and discharging, coupled with predictive strategies, synergize to optimize the operation of microgrid systems. Real-time actions ensure a precise balance between supply and demand, thereby reducing energy wastage resulting from either shortages or surpluses.
However, real-time operations are limited to reacting to current grid conditions and cannot predict or manage potential fluctuations in future power demand or supply. To address this limitation, predictive charging and discharging strategies are employed. By forecasting power needs and availability, these strategies enable the proactive formulation of sensible charging and discharging plans. This foresight helps to alleviate grid supply pressure and enhances the efficiency and cost-effectiveness of energy systems.
3.4. Prediction and Analysis of Electricity Consumption Trends
Based on forecasted WT, PV, and power load data, a bi-level collaborative optimization model was utilized to plan and schedule the operation of the community microgrid. Using a single day as the calculation cycle and collecting data every 15 min (resulting in a total of 96 data points), the predicted trends for typical daily load, PV, and WT output were obtained, as illustrated in Figure 15. This approach allows for a detailed and accurate assessment of the microgrid’s performance and enables optimal decision-making to ensure reliable and cost-effective energy supply.
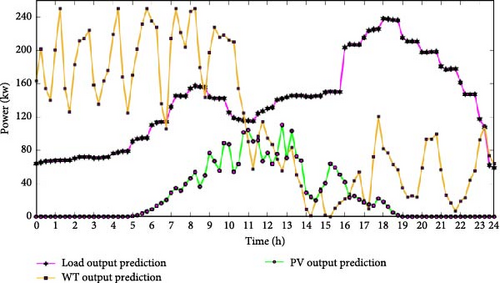
Predicting and analyzing electricity consumption trends is crucial in modern energy management and planning. With the continuous growth in electricity demand, understanding consumption patterns and making informed predictions are essential for ensuring a stable and efficient energy supply. This article delves into the methodologies and insights surrounding the prediction and analysis of electricity consumption trends, particularly within the context of microgrid.
Microgrids represent dynamic energy systems whose electricity consumption patterns are influenced by a multitude of factors. Below, we present a comprehensive guide outlining strategies for both short-term charging and discharging practices, as well as insights into long-term strategic replanning to achieve optimal performance and sustainability.
3.4.1. Short-Term Charging and Discharging Recommendations
- a.
Load management: Optimize electricity usage patterns by implementing load management techniques. Charge during periods of low electricity prices and reduce consumption during high-price periods to minimize electricity costs.
- b.
Energy storage: Enhance energy storage capabilities with devices such as batteries or ESSs. This allows for the release of energy during demand peaks, balancing supply and demand discrepancies and reducing reliance on the main power grid.
- c.
Intelligent charging control: Utilize intelligent charging control systems to adjust charging and discharging processes based on factors like energy prices, load demand, and battery status. This improves energy utilization efficiency and optimizes system performance.
- d.
Optimization of renewable energy: Schedule charging and discharging periods based on weather forecasts and real-time output of PV and WT power generation units. This maximizes the utilization of renewable energy and reduces carbon emissions.
3.4.2. Long-Term Replanning Recommendations
- a.
Network expansion and optimization: Consider expanding the microgrid’s scale or increasing distributed energy resources based on future demand forecasts. This ensures the growing electricity demand is met and optimizes the power supply network structure.
- b.
Diversification of energy sources: Introduce a variety of energy resources, such as solar, wind, and biomass energy, to reduce dependence on traditional energy sources. This enhances the reliability and stability of the energy supply.
- c.
Intelligent management systems: Implement intelligent management systems that leverage advanced data analysis and prediction technologies for real-time monitoring, optimization scheduling, and fault diagnosis of microgrid systems. This boosts system operation efficiency and reliability.
- d.
Participation in power markets: Explore opportunities for microgrid participation in power markets, such as selling surplus electricity or engaging in energy trading. This maximizes economic benefits and supports the sustainable development of microgrid.
In conclusion, adopting these short-term charging and discharging recommendations alongside long-term replanning strategies enables microgrid to better adapt to changing electricity demand and energy environments. This enhances the stability, reliability, and economic efficiency of the system, ensuring a sustainable and resilient energy future.
4. Conclusions
- a.
An overall and operation architecture of community microgrid based on EIoT was proposed, which addressed the challenges of seamless integration and flexible grid connection of distributed renewable energy sources, enhanced the reliability of community microgrid power supply, and facilitated efficient utilization of diversified energy sources.
- b.
A bi-level coordinated optimization method has been developed for community microgrid, considering user electricity consumption behaviors. It obtains configuration parameters and operational data of the community microgrid through adaptive weight PSO and linear programming algorithms, ensuring optimal operation of community microgrid under varying conditions.
- c.
The short-term daily intelligent operation strategies and long-term maintenance plans for community microgrids are systematically integrated through the prediction of electricity usage trends using machine learning algorithms, resulting in a substantial enhancement of the scheduling and operational efficiency of community energy systems.
One limitation of this study is that the optimization models do not account for various application scenarios in microgrid clusters. To address this, future research will employ new optimization methods and models to further enhance the environmental adaptability and operational stability of community microgrid.
Conflicts of Interest
The authors declare no conflicts of interest.
Funding
National Key Research and Development Program of China under Grant No. 2022YFB4702400, National Natural Science Foundation of China under Grant No. 52005328. National Natural Science Foundation of China under Grant No. 52305489.
Acknowledgments
This study was supported by the National Key Research and Development Program of China under Grant No. 2022YFB4702400, National Natural Science Foundation of China under Grant No. 52005328, and National Natural Science Foundation of China under Grant No. 52305489.
Open Research
Data Availability Statement
The authors do not have permission to share data.


